

- Market Size (2026)
- USD 512.0 Mn
- Forecast (2036)
- USD 988.5
- CAGR (2026 to 2036)
- 6.8%
Engine Inlet Anti-Ice and De-Ice Systems Market Outlook for 2026 to 2036
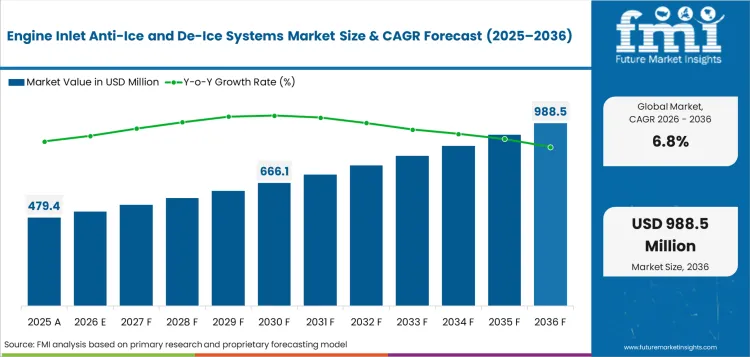
Engine inlet anti-ice and de-ice systems market was valued at USD 479.4 million in 2025 and is expected to reach USD 512.0 million in 2026. Demand is forecast to reach USD 988.5 million by 2036 at 6.8% CAGR. Integrated systems are forecast to represent 55.0% of integration-level demand in 2026. Turbofan applications are expected to account for 54.0% of engine-type demand in 2026.
Engine-inlet anti-ice and de-ice systems are shifting from basic hardware supply to certified protection support. The eCFR requirement for turbine engines pushes suppliers to prove performance across Appendix C and O icing conditions, including at least 30 minutes of ground-idle testing at 0.3 g/m³ water concentration. This makes test evidence along with thermal-margin data and approved documentation more important in supplier selection.
Fleet actions are adding service demand as well. In May 2024, FAA AD placed attention on Boeing 787-8, 787-9 and 787-10 inlet seal degradation, which supports MRO work around seal replacement and approved repairs. In June 2024, FAA AD added another demand route for Boeing 737-8 and 737-9 aircraft through electrical changes and power-test support. Over the forecast period, suppliers with certified designs with repair documentation and retrofit support are expected to be better placed as airlines manage icing safety without adding avoidable aircraft downtime.
Summary of the Engine Inlet Anti-Ice and De-Ice Systems Market
- Demand and Growth Drivers
- Airlines need engine inlet protection to keep ice away from the intake area. Clean airflow is important because the engine must receive steady air during cold-weather flight.
- New aircraft programs support demand because inlet protection is built into the nacelle before the aircraft enters service. Certified heating systems help aircraft makers meet safety rules during icing conditions.
- Replacement demand is coming from routine aircraft maintenance. Older heaters and valves need checks during nacelle service, which keeps MRO demand active.
- Product and Segment View
- Bleed-air systems are widely used because they use engine heat to protect the inlet lip. Airlines and maintenance providers understand this system well, so it stays a trusted option.
- Electro-thermal systems are gaining attention as aircraft designs use more electrical control. These systems can heat selected inlet areas and may reduce dependence on pneumatic parts.
- Integrated systems are preferred because heaters and related parts can be tested as one approved package. This makes certification and service planning easier for aircraft makers.
- Geography and Competitive Outlook
- China and India are seeing stronger demand as airlines add aircraft and expand route networks. More aircraft in service means more need for certified inlet protection systems.
- The United States and France hold important positions because both countries have deep aerospace manufacturing and nacelle system experience. Suppliers in these countries can support new aircraft and replacement programs.
- The United Arab Emirates supports service demand because hub airlines operate many long-distance aircraft. Suppliers with proven thermal design and quick MRO support will be better placed.
- Analyst Opinion
- FMI Principal Consultant Nikhil Kaitwade says, “Engine inlet anti-ice and de-ice systems are becoming a reliability decision for aircraft operators. A small failure near the inlet lip can affect aircraft readiness during winter operations. Suppliers with certified thermal control and nacelle integration proof is expected to be preferred across new aircraft and retrofit programs.”
- Engine Inlet Anti-Ice and De-Ice Systems Market Value Analysis
- Inlet protection adds value as it keeps ice away from intake surfaces and lowers avoidable engine performance risk during winter flight.
- Integrated systems reduce qualification effort since heaters and controllers can be tested as one certified package.
- Turbofan aircraft keep demand active as commercial jet fleets use certified nacelles across frequent route networks.
- Aftermarket demand improves as replacement heaters and valves are needed during nacelle inspection and engine service work.
- Suppliers with proven thermal control and aviation test equipment access can support faster certification checks for new inlet protection designs.
Key Takeaways, Market Size, and Forecast
- Engine inlet anti-ice and de-ice systems market stood at USD 479.4 million in 2025.
- By 2036, the industry is forecast to reach USD 988.5 million.
- Market value is expected to expand at 6.8% CAGR during the forecast period.
- Market value is expected to add USD 476.5 million in incremental opportunity from 2026 to 2036.
- Integrated systems are expected to lead integration-level demand with 55.0% share in 2026.
- Turbofan applications are forecast to represent 54.0% of engine-type demand in 2026.
- China at 8.8% CAGR and India at 8.5% CAGR are expected to record steady expansion during the forecast period.
Engine Inlet Anti-Ice and De-Ice Systems Market Definition
The engine inlet anti-ice and de-ice systems market covers certified aircraft systems that prevent or remove ice from engine intake areas. These systems protect airflow into the engine during cold-weather flight and support safe aircraft operation.
Engine Inlet Anti-Ice and De-Ice Systems Market Inclusions
The market includes inlet lip heaters, bleed-air ducts, valves, sensors, controllers, harnesses, and retrofit kits. Key stakeholders include aircraft OEMs, engine manufacturers, nacelle suppliers, airlines, MRO providers, defense operators, and aviation certification bodies. Core roles include aircraft original equipment manufacturers and engine manufacturers. Nacelle suppliers and airlines are covered. Maintenance providers and certification bodies are also included.
Engine Inlet Anti-Ice and De-Ice Systems Market Exclusions
The market excludes airport de-icing trucks, runway de-icing equipment, de-icing fluids, aircraft windshield heaters, wing de-icing boots, ground handling services, general cabin heating systems, and non-certified thermal parts used outside engine inlet protection.
Engine Inlet Anti-Ice and De-Ice Systems Market Research Methodology
- Primary Research: FMI analysts reviewed nacelle suppliers and engine integration programs. MRO needs and certified component pricing were checked across aviation countries.
- Desk Research: The study used aviation regulator guidance and airline activity data. Official supplier releases and public aerospace association records supported market checks.
- Market Sizing and Forecasting: Market size was built through fleet fitment and component value per aircraft. Replacement cycles and supplier capability checks were used for forecast validation.
- Data Validation: Forecast checks compared airline traffic and aircraft use. Nacelle integration needs and certified anti-ice system replacement activity were reviewed.
Why is the Engine Inlet Anti-Ice and De-Ice Systems Market Growing?
-
Aircraft need clean airflow during cold-weather flight. Ice near the engine inlet can disturb airflow and affect engine performance.
- Certified inlet protection is built into aircraft safety planning. Engine inlet systems must prove safe performance under icing conditions before aircraft enter service.
- Airlines and MRO providers need reliable replacement parts. Older heaters and sensors are checked during nacelle service work.
Engine inlet protection demand is moving with aircraft safety and service reliability needs. Federal rules under 14 CFR § 33.68 require engines with icing protection systems to operate safely under defined icing conditions. Certified systems must keep airflow stable before ice affects the engine intake area. Inlet heaters and valves therefore become part of aircraft readiness planning, not just spare parts replacement. Demand for aircraft sensors also supports better monitoring around ice detection and thermal control.
Market Segmentation Analysis
- Integrated systems are expected to lead integration level with 55.0% share in 2026.
- Turbofan applications are forecast to represent 54.0% of engine-type demand in 2026.
- Part 25 aircraft are expected to account for 52.0% share in 2026.
- Bleed-air systems are forecast to hold 47.0% share in 2026.
- Aftermarket supply is expected to account for 46.0% share in 2026.
- Titanium is forecast to account for 39.0% share in 2026.
- Narrowbody aircraft are expected to take 31.0% of demand in 2026.
- Heaters are expected to hold 24.0% share in 2026.
Engine inlet anti-ice and de-ice systems market is segmented by protection method, bleed-air, electro-thermal, pneumatic, fluid-based, component type, heaters, valves, ducts, controllers, harnesses, sensors, boots, manifolds, material, titanium, aluminum, composites, elastomers, aircraft type, narrowbody, widebody, regional, turboprop, business jet, helicopter, military, engine type, turbofan, turboprop, turboshaft, integration level, integrated systems, semi-integrated, retrofit kits, sales channel, aftermarket, OEM supply, MRO, and certification class, part 25, part 23, part 27, part 29.
Insights into Engine Inlet Anti-Ice and De-Ice Systems Market by Protection Method
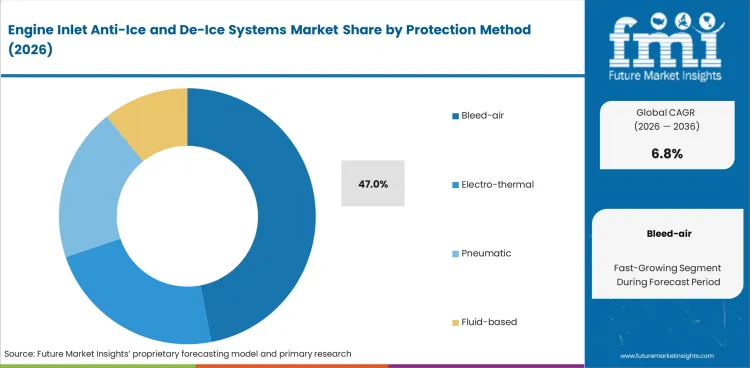
- Bleed-air systems are expected to hold 47.0% share in 2026. Airlines use this method widely because engine heat can protect the inlet lip during icing conditions.
- Electro-thermal systems are drawing more attention as aircraft designs use more electrical control. These systems can heat selected inlet areas and work with aircraft sensors for better ice detection.
Insights into Engine Inlet Anti-Ice and De-Ice Systems Market by Component Type
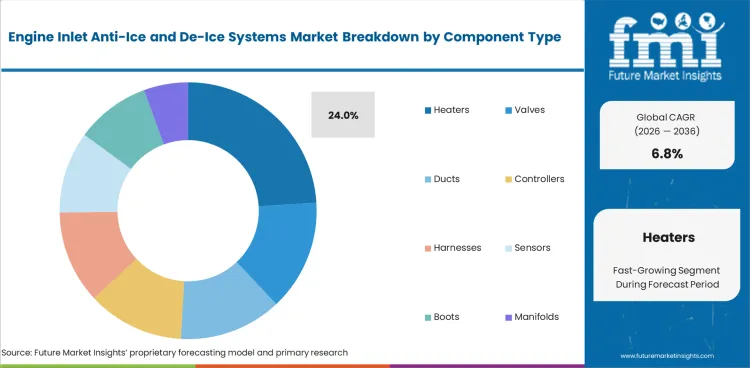
- Heaters are forecast to account for 24.0% share in 2026 as inlet lips need direct thermal protection. Their role is important because heat must reach the intake area before ice affects airflow.
- Valves and controllers support the same protection system by managing heat flow and system response. Ducts and harnesses help carry air or power across the inlet package.
Insights into Engine Inlet Anti-Ice and De-Ice Systems Market by Material
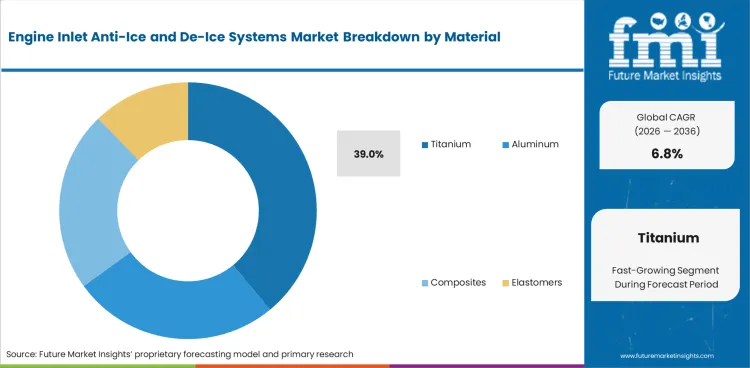
- Titanium is expected to hold 39.0% share in 2026 as inlet lips need heat tolerance and strength. The material suits areas exposed to repeated heating during cold-weather flight.
- Aluminum and composites are used when aircraft makers want lighter nacelle parts. Elastomers support sealing around inlet systems, which keeps aircraft seals important in thermal control.
Insights into Engine Inlet Anti-Ice and De-Ice Systems Market by Aircraft Type
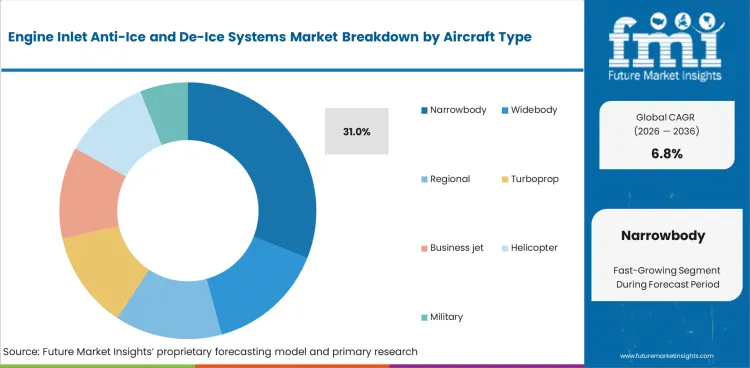
- Narrowbody aircraft are forecast to account for 31.0% share in 2026. These aircraft fly frequent short routes, so inlet parts face regular inspection and replacement needs.
- Widebody aircraft need larger inlet protection systems because their engines are bigger. Regional aircraft use smaller systems, but certified protection is still needed for safe winter operations.
Insights into Engine Inlet Anti-Ice and De-Ice Systems Market by Engine Type
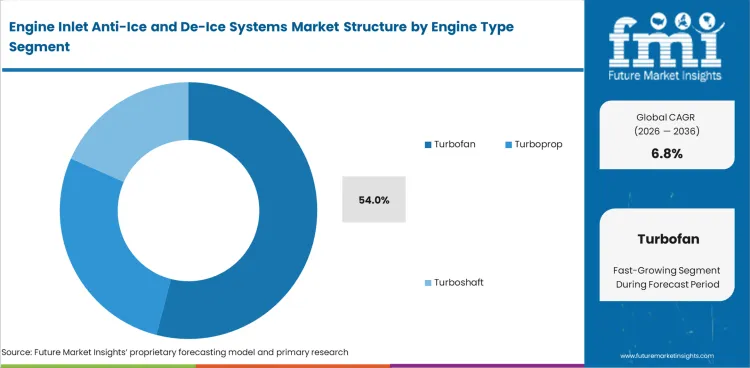
- Turbofan engines are expected to represent 54.0% share in 2026. Commercial aircraft use these engines widely, so inlet protection is closely tied to turbofan engines and nacelle design.
- Turboprop and turboshaft engines need different inlet layouts. Their systems are smaller, but icing protection still has to meet aircraft safety rules.
Insights into Engine Inlet Anti-Ice and De-Ice Systems Market by Integration Level
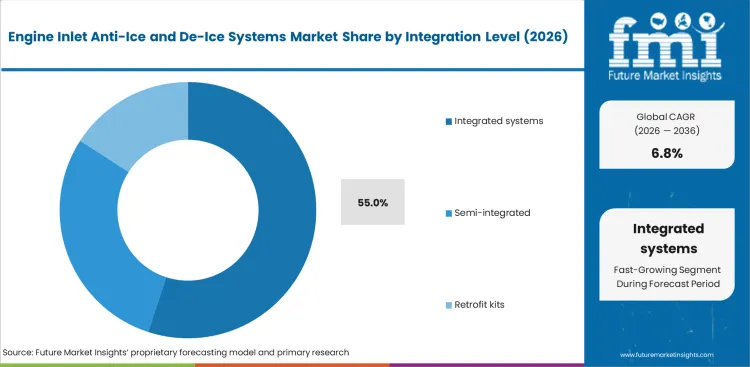
- Integrated systems are forecast to hold 55.0% share in 2026. Aircraft makers prefer these systems because heaters and controls can be tested as one approved package.
- Semi-integrated systems support aircraft that need partial replacement. Retrofit kits help older aircraft upgrade inlet protection without changing the full nacelle package.
Insights into Engine Inlet Anti-Ice and De-Ice Systems Market by Sales Channel
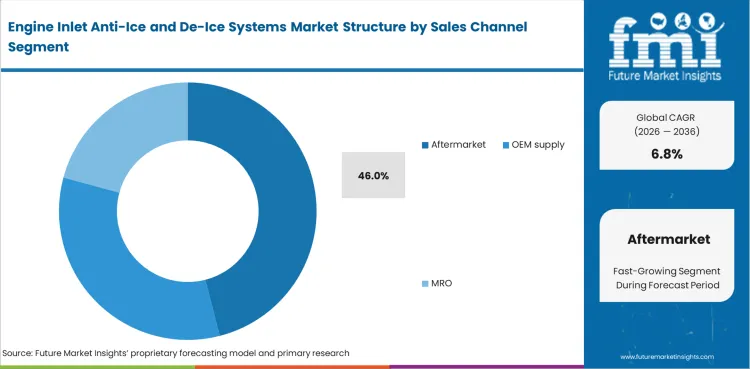
- Aftermarket supply is expected to account for 46.0% share in 2026 as operators replace heaters and valves during service checks. MRO providers need approved parts that can be cleared quickly.
- OEM supply supports new aircraft programs because inlet protection must match nacelle design before certification. Early supplier involvement helps reduce approval delays.
Insights into Engine Inlet Anti-Ice and De-Ice Systems Market by Certification Class
- Part 25 aircraft are forecast to hold 52.0% share in 2026. Transport aircraft need strict icing proof because they carry larger passenger loads and operate on busy routes.
- Part 23 aircraft and rotorcraft create smaller demand pockets. These aircraft still need reliable inlet protection, but system size and service needs differ by platform.
Engine Inlet Anti-Ice and De-Ice Systems Market Drivers, Restraints, and Opportunities
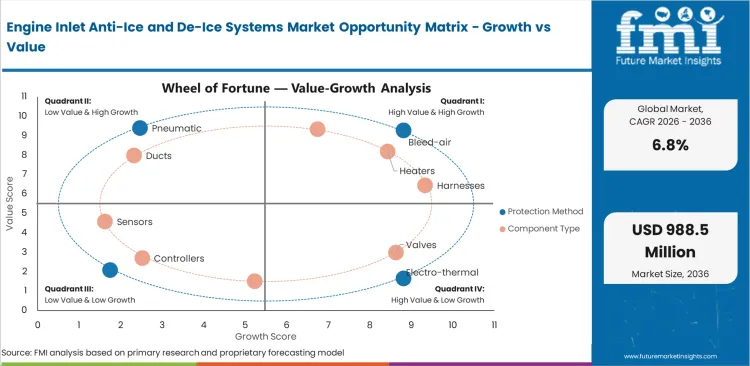
- Certified inlet protection supports aircraft safety by keeping ice away from the engine intake. Airlines need systems that work well during cold-weather routes.
- Retrofit work can be slow because inlet changes must pass strict safety checks. Each heater and controller must match the aircraft design.
- Electro-thermal systems create a cleaner upgrade route for selected aircraft. These systems use electrical heat and can work with sensor-based control.
Certified Inlet Protection Supports Safer Winter Flight
Engine inlet systems protect the intake area before ice affects airflow. Certified heating systems stay important because aircraft need stable airflow during cold-weather flight. Broad use across aircraft programs shows why proven heating systems stay important. Operators want parts that are already trusted during winter operations. Inlet seals are part of the same check because aircraft seals help manage air leakage and thermal performance near nacelle structures.
Retrofit Cost Slows Small Fleet Upgrades
Older aircraft may need inlet heater or valve replacement during service checks. The challenge is that any change near the engine intake can affect safety approval. Small operators often delay retrofit work if parts need long qualification steps. Certified kits with clear documentation can reduce service delays and help MRO providers plan replacement work better.
Electric Heat Creates a Better Upgrade Path
Electro-thermal systems are becoming more useful as aircraft use more electrical control. These systems can heat selected inlet areas and reduce dependence on pneumatic routing. Sensor-based control can also help apply heat only when icing risk is present. The shift connects with turbofan engines as newer propulsion programs need better nacelle thermal control.
Analysis of Engine Inlet Anti-Ice and De-Ice Systems Market by Key Countries
.webp "Top Country Growth Comparison Engine Inlet Anti Ice And De Ice Systems Market Cagr (2026 2036)")
| Country | CAGR |
|---|---|
| China | 8.8% |
| India | 8.5% |
| United Arab Emirates | 7.6% |
| Brazil | 6.4% |
| United States | 6.0% |
| France | 5.9% |
| United Kingdom | 5.7% |
Source: Future Market Insights, 2026.
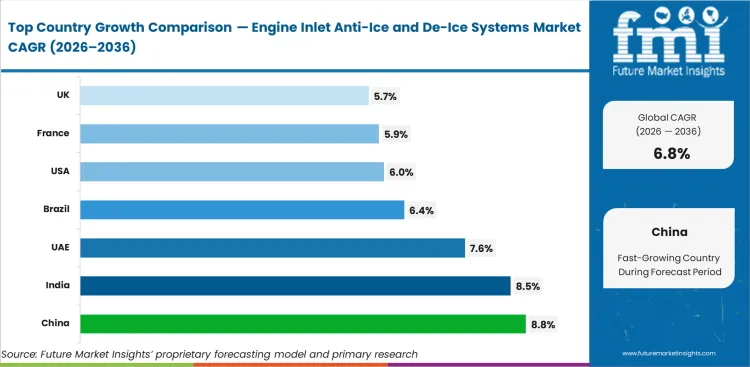
Engine Inlet Anti-Ice and De-Ice Systems Market CAGR Analysis by Country
- China is expected to record 8.8% CAGR between 2026 and 2036.
- Airport traffic and fleet additions are expected to place India at 8.5% CAGR during the forecast period.
- The United Arab Emirates is forecast to advance at 7.6% CAGR by 2036.
- Brazil is expected to expand at 6.4% CAGR from 2026 to 2036.
- The United States is forecast at 6.0% CAGR during the forecast period.
- France is expected to reach 5.9% CAGR by 2036.
- The United Kingdom is forecast at 5.7% CAGR during the forecast period.
Sales Analysis of Engine Inlet Anti-Ice and De-Ice Systems Market in China
China is expected to record 8.8% CAGR through 2036 as airline activity and domestic aircraft programs increase demand for certified inlet protection. CAAC reported 770 million passengers in 2025 and 5.547 million flight movements across civil aviation. Higher flight activity raises the need for reliable inlet heaters and valves during aircraft service. Domestic aircraft programs also create more room for local nacelle qualification work.
- New aircraft programs support first-fit demand for integrated inlet protection.
- MRO providers need approved heaters and valves as airline fleets stay active.
Demand Outlook for Engine Inlet Anti-Ice and De-Ice Systems Market in India
Aircraft use is rising in India as airlines add capacity and airports handle more traffic. The market in India is forecast to expand at 8.5% CAGR through 2036. Press Information Bureau data stated Indian airports handled 412.0 million passengers in FY2025 and are expected to handle 665.0 million by FY2031. More aircraft in service means more need for inlet protection systems during cold-weather routes and scheduled checks.
- Airline fleet additions support demand for certified nacelle parts.
- Local MRO growth creates replacement demand for heaters and controllers.
Demand Outlook for Engine Inlet Anti-Ice and De-Ice Systems Market in the United Arab Emirates
The United Arab Emirates depends on long-distance aircraft operations through major hub airports. Adoption in the country is expected to move ahead at 7.6% CAGR during the forecast period. Dubai International handled 95.2 million guests in 2025 and Dubai Airports forecast 99.5 million guests in 2026. Heavy widebody use increases the need for quick nacelle service and approved inlet protection parts.
- Hub airlines need inlet systems that support reliable winter route operations.
- Widebody aircraft service creates demand for ducts and controllers.
Opportunity Analysis of Engine Inlet Anti-Ice and De-Ice Systems Market in Brazil
Brazil supports steady demand through regional aircraft use and airline maintenance needs. Brazil is forecast to register 6.4% CAGR in this market by 2036. ANAC reported 129.59 million passengers in Brazil in 2025. Regional route activity supports service demand for inlet heaters and certified replacement kits.
- Regional aircraft use creates demand for practical inlet protection repairs.
- Airline maintenance programs need approved parts with clear service records.
Demand Outlook for Engine Inlet Anti-Ice and De-Ice Systems Market in the United States
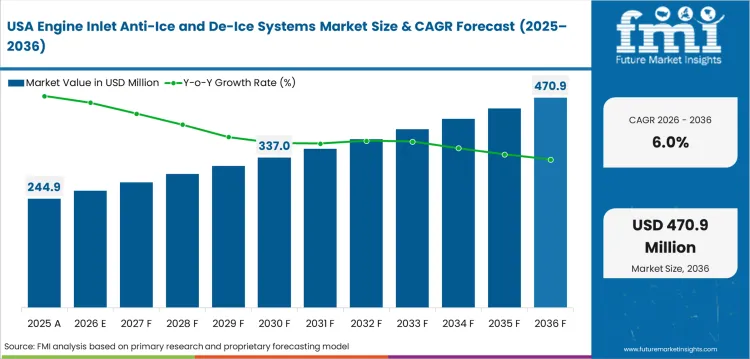
The United States has a large aircraft service pool and strict engine safety rules. The United States is expected to advance at 6.0% CAGR through 2036 as airline and defense fleets need certified replacement parts. Federal rules under 14 CFR § 33.68 require engines with icing protection systems to operate safely under defined icing conditions. The rule keeps inlet protection close to engine certification and nacelle design work.
- Large airline fleets keep MRO demand active for inlet heating parts.
- Defense aircraft programs support replacement demand for certified control hardware.
Sales Analysis of Engine Inlet Anti-Ice and De-Ice Systems Market in France
France has a strong role in aircraft engine and nacelle system work. The industry outlook in France points to 5.9% CAGR through 2036. GIFAS reported French aerospace revenue of EUR 85.6 billion in 2025 and order intake of EUR 88.6 billion. Supplier depth across nacelles and engines reinforces demand for certified inlet protection systems.
- Nacelle system expertise supports qualified inlet heating packages.
- Export-focused aerospace production keeps French suppliers tied to global aircraft programs.
Future Outlook for Engine Inlet Anti-Ice and De-Ice Systems Market in the United Kingdom
Airport activity and aerospace supplier capability support service demand in the United Kingdom. UK Civil Aviation Authority data recorded 302.0 million passenger journeys through UK airports in 2025. Passenger journeys rose 2.0% from 2024, which signals steady aircraft use across the network. The United Kingdom is expected to record 5.7% CAGR during the forecast period. MRO providers are likely to need replacement electronics and thermal hardware for cold-weather operations.
- Aerospace suppliers support inlet hardware design and test work.
- Active airport traffic supports steady planning for replacement parts.
Competitive Landscape and Strategic Positioning
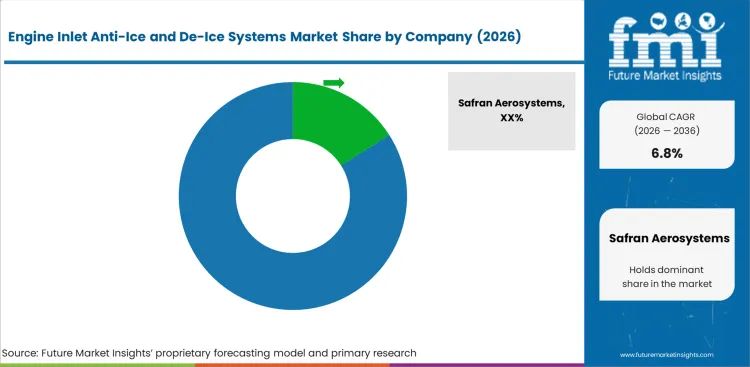
- Competition is based on how well suppliers prove thermal performance and fit the system into the nacelle. Aircraft makers need parts that protect the inlet without disturbing engine airflow.
- Suppliers are better placed when heaters and controls are tested as one approved package. This makes certification easier and gives airlines more confidence during service checks.
- New entrants face high barriers because every inlet system must pass aircraft-level testing and safety approval. Without proven test data, suppliers struggle to enter new aircraft programs.
Supplier position in this market depends on proof over broad product range. Safran Aerosystems has certified ice protection depth across pneumatic and electrical systems. Collins Aerospace has nacelle system capability that supports inlet and fan cowl integration. Parker Aerospace and ITT Aerospace Controls add value through valve and control hardware. CAV Systems and Cox & Company support more focused ice protection needs.
Competition is expected to stay centered on approved parts and service support. Aircraft makers need suppliers that understand inlet airflow and certification work. Airlines need replacement parts that can be cleared quickly during maintenance checks. Suppliers with proven thermal design and clean documentation will be better placed in new aircraft and retrofit programs.
Key Companies in the Engine Inlet Anti-Ice and De-Ice Systems Market
- Integrated Inlet System Specialists: Safran Aerosystems and Collins Aerospace hold established positions through certified ice protection and aircraft program access.
- Component and Control Suppliers: Parker Aerospace and ITT Aerospace Controls compete through valves and aircraft-system qualification support.
- Specialist Ice Protection and Materials Suppliers: CAV Systems and Cox & Company support electro-thermal systems. Hutchinson supports sealing and thermal material needs.
Competitive Benchmarking: Engine Inlet Anti-Ice and De-Ice Systems Market
| Company | Inlet Protection Depth | Nacelle Integration Fit | Certification Support | Geographic Footprint |
|---|---|---|---|---|
| Safran Aerosystems | High | High | High | International with French production depth |
| Collins Aerospace | High | High | High | International with USA strength |
| Parker Aerospace | Medium | Medium | High | International aerospace controls footprint |
| GKN Aerospace | Medium | High | Medium | Europe and North America centered |
| ITT Aerospace Controls | Medium | Medium | Medium | North America and Europe focused |
| CAV Systems | Medium | Medium | Medium | United Kingdom ice protection specialist |
| Cox & Company | Medium | Low | Medium | USA specialist footprint |
Source: Future Market Insights competitive analysis, 2026.
Key Developments in Engine Inlet Anti-Ice and De-Ice Systems Market
- In March 2025, RTX said Collins Aerospace would design and build nacelle structures for JetZero’s blended wing aircraft demonstrator.
- In September 2025, the FAA issued an airworthiness directive for Leonardo AW189 helicopters after a fire occurred during an engine anti-icing system check.
Key Players in the Engine Inlet Anti-Ice and De-Ice Systems Market
Major Global Players
- Safran Aerosystems
- Collins Aerospace
- Parker Aerospace
- GKN Aerospace
- ITT Aerospace Controls
Specialist and Regional Players
- CAV Systems
- Cox & Company
- Hutchinson
- Triumph Group
- Senior Aerospace
Report Scope and Coverage
| Parameter | Details |
|---|---|
| Quantitative Units | USD 512.0 million in 2026 and USD 988.5 million by 2036 at 6.8% CAGR |
| Market Definition | Certified aircraft engine inlet protection systems used for inlet lip anti-ice and de-ice functions |
| Regions Covered | North America, Latin America, Western Europe, Eastern Europe, East Asia, South Asia and Pacific, Middle East and Africa |
| Countries Covered | China, India, United Arab Emirates, Brazil, United States, France, United Kingdom |
| Key Companies Profiled | Safran Aerosystems, Collins Aerospace, Parker Aerospace, GKN Aerospace, ITT Aerospace Controls, CAV Systems, Cox & Company |
| Forecast Period | 2026 to 2036 |
| Approach | Hybrid bottom-up and top-down method using supplied FMI values and fleet activity. Certification rules and supplier evidence supported validation. |
Source: Future Market Insights, 2026.
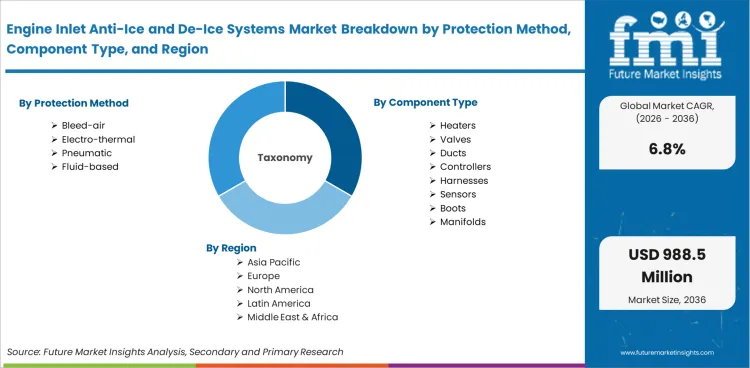
Engine Inlet Anti-Ice and De-Ice Systems Market Breakdown by Protection Method, Component Type, Material, Aircraft Type, Engine Type, Integration Level, Sales Channel, Certification Class, and Region
Engine Inlet Anti-Ice and De-Ice Systems Market Segmented by Protection Method
- Bleed-air
- Electro-thermal
- Pneumatic
- Fluid-based
Engine Inlet Anti-Ice and De-Ice Systems Market Segmented by Component Type
- Heaters
- Valves
- Ducts
- Controllers
- Harnesses
- Sensors
- Boots
- Manifolds
Engine Inlet Anti-Ice and De-Ice Systems Market Segmented by Material
- Titanium
- Aluminum
- Composites
- Elastomers
Engine Inlet Anti-Ice and De-Ice Systems Market Segmented by Aircraft Type
- Narrowbody
- Widebody
- Regional
- Turboprop
- Business jet
- Helicopter
- Military
Engine Inlet Anti-Ice and De-Ice Systems Market Segmented by Engine Type
- Turbofan
- Turboprop
- Turboshaft
Engine Inlet Anti-Ice and De-Ice Systems Market Segmented by Integration Level
- Integrated systems
- Semi-integrated
- Retrofit kits
Engine Inlet Anti-Ice and De-Ice Systems Market Segmented by Sales Channel
- Aftermarket
- OEM supply
- MRO
Engine Inlet Anti-Ice and De-Ice Systems Market Segmented by Certification Class
- Part 25
- Part 23
- Part 27
- Part 29
Engine Inlet Anti-Ice and De-Ice Systems Market Segmented by Region
- North America
- United States
- Canada
- Latin America
- Brazil
- Mexico
- Rest of Latin America
- Western Europe
- France
- United Kingdom
- Germany
- Italy
- Spain
- BENELUX
- Nordics
- Eastern Europe
- Poland
- Russia
- Rest of Eastern Europe
- East Asia
- China
- Japan
- South Korea
- South Asia and Pacific
- India
- ASEAN
- Australia and New Zealand
- Rest of South Asia and Pacific
- Middle East and Africa
- United Arab Emirates
- Saudi Arabia
- Türkiye
- South Africa
- Rest of Middle East and Africa
Research Sources and Bibliography
- Electronic Code of Federal Regulations. (2026). 14 CFR § 33.68: Induction system icing. USA Government Publishing Office.
- Federal Aviation Administration. (2024, August 20). Airworthiness directives; The Boeing Company airplanes. Federal Register.
- Federal Aviation Administration. (2024, October 22). Airworthiness directives; The Boeing Company airplanes. Federal Register.
- The State Council of the People’s Republic of China. (2026, January 6). China’s civil aviation sector achieves steady growth in 2025. The State Council of the People’s Republic of China.
- Press Information Bureau. (2026, January 29). Government aviation infrastructure and passenger traffic update. Government of India.
- Dubai Airports. (2026, February 11). DXB sets global benchmark as record traffic becomes the norm. Dubai Airports.
- GIFAS. (2026, May 6). The French aerospace industry reports 2025 results. GIFAS.
- UK Civil Aviation Authority. (2026, February 24). UK aviation officially breaks records with over 300m passenger journeys in 2025. UK Civil Aviation Authority.
- RTX. (2025, March 6). RTX’s Pratt & Whitney and Collins Aerospace to lead engine integration and supply power units and nacelles for JetZero blended wing aircraft. RTX.
- Federal Aviation Administration. (2025, September 24). Airworthiness directives; Leonardo S.p.A. helicopters. Federal Register.
- Civil Aviation Administration of China. (2026, March 11). National Civil Aviation Work Conference 2026 held in Beijing. Civil Aviation Administration of China.
- Agência Nacional de Aviação Civil. (2026). Relatório de gestão e atividades 2025. Governo Federal.
Frequently Asked Questions
What is the engine inlet anti-ice and de-ice systems market size in 2026?
Market value is expected to reach USD 512.0 million in 2026 as certified inlet protection stays important for aircraft operations.
What is the engine inlet anti-ice and de-ice systems market outlook by 2036?
Demand is forecast to reach USD 988.5 million by 2036 as nacelle replacement and fleet renewal support steady demand.
What CAGR will the engine inlet anti-ice and de-ice systems market record?
The market is expected to expand at 6.8% CAGR between 2026 and 2036 with stable aircraft safety investment.
Which protection method leads engine inlet anti-ice and de-ice systems demand?
Bleed-air systems are forecast to hold 47.0% share in 2026 due to proven heating performance in certified aircraft.
Which component type is important in engine inlet anti-ice and de-ice systems?
Heaters are expected to account for 24.0% share in 2026 as inlet lips need direct thermal protection.
Which engine type supports most inlet anti-ice and de-ice demand?
Turbofan engines are expected to hold 54.0% share in 2026 because commercial jet fleets use certified nacelle inlets.
Which country advances faster in engine inlet anti-ice and de-ice systems?
China is expected to record 8.8% CAGR through 2036 due to fleet activity and aircraft programs.
Why is aftermarket supply important in engine inlet anti-ice and de-ice systems?
Aftermarket supply is expected to hold 46.0% share in 2026 as heaters and valves need scheduled replacement.
Preview the report firsthand - request a free sample
Get SampleGet the brochure for pricing and purchase details.
Get PDFTable of Content
- Key Takeaways
- Market Size and CAGR
- Top Growth Driver
- Fastest Growing Segment
- Leading Region
- Key Companies
- Emerging Opportunities
- Executive Summary
- Global Market Outlook
- Demand-side Trends
- Supply-side Trends
- Technology Roadmap Analysis
- Analysis and Recommendations
- Analyst Perspective (What is happening? Why now? What should investors know?)
- Key Questions Answered
- How large is the market?
- What is the CAGR?
- What are key trends?
- Which region dominates?
- Who are the leaders?
- Market Overview
- Market Coverage / Taxonomy
- Market Definition / Scope / Limitations
- Research Methodology
- Chapter Orientation
- Analytical Lens and Working Hypotheses
- Market Structure, Signals, and Trend Drivers
- Benchmarking and Cross-market Comparability
- Market Sizing, Forecasting, and Opportunity Mapping
- Research Design and Evidence Framework
- Desk Research Programme (Secondary Evidence)
- Expert Input and Fieldwork (Primary Evidence)
- Tooling, Models, and Reference Databases
- Data Engineering and Model Build
- Quality Assurance and Audit Trail
- Market Background
- Market Dynamics (Drivers, Restraints, Opportunity, Trends)
- Scenario Forecast (Optimistic, Likely, Conservative)
- Impact Analysis
- AI Impact
- Sustainability Impact
- Regulatory Impact
- Technology Impact
- Consumer / Buyer Analysis
- Purchase Drivers
- Adoption Barriers
- Buyer Journey
- Opportunity Map Analysis
- Product Life Cycle Analysis
- Supply Chain Analysis
- Investment Feasibility Matrix
- Value Chain Analysis
- PESTLE and Porter's Analysis
- Regulatory Landscape
- Regional Parent Market Outlook
- Production and Consumption Statistics
- Import and Export Statistics
- Global Market Analysis and Forecast, 2021 to 2036
- Historical Market Size Value (USD Million) & Volume (Unit) Analysis, 2021 to 2025
- Current and Future Market Size Value (USD Million) & Volume (Unit) Projections, 2026 to 2036
- Y-o-Y Growth Trend Analysis
- Absolute $ Opportunity Analysis
- Global Market Pricing Analysis, 2021 to 2036
- Global Market Analysis and Forecast, By Protection Method, 2021 to 2036
- Introduction / Key Findings
- Historical Market Size Value (USD Million) & Volume (Unit) Analysis By Protection Method, 2021 to 2025
- Current and Future Market Size Value (USD Million) & Volume (Unit) Analysis and Forecast By Protection Method, 2026 to 2036
- Bleed-air
- Electro-thermal
- Pneumatic
- Fluid-based
- Bleed-air
- Y-o-Y Growth Trend Analysis By Protection Method, 2021 to 2025
- Absolute $ Opportunity Analysis By Protection Method, 2026 to 2036
- Global Market Analysis and Forecast, By Component Type, 2021 to 2036
- Introduction / Key Findings
- Historical Market Size Value (USD Million) & Volume (Unit) Analysis By Component Type, 2021 to 2025
- Current and Future Market Size Value (USD Million) & Volume (Unit) Analysis and Forecast By Component Type, 2026 to 2036
- Heaters
- Valves
- Ducts
- Controllers
- Harnesses
- Sensors
- Boots
- Manifolds
- Heaters
- Y-o-Y Growth Trend Analysis By Component Type, 2021 to 2025
- Absolute $ Opportunity Analysis By Component Type, 2026 to 2036
- Global Market Analysis and Forecast, By Material, 2021 to 2036
- Introduction / Key Findings
- Historical Market Size Value (USD Million) & Volume (Unit) Analysis By Material, 2021 to 2025
- Current and Future Market Size Value (USD Million) & Volume (Unit) Analysis and Forecast By Material, 2026 to 2036
- Titanium
- Aluminum
- Composites
- Elastomers
- Titanium
- Y-o-Y Growth Trend Analysis By Material, 2021 to 2025
- Absolute $ Opportunity Analysis By Material, 2026 to 2036
- Global Market Analysis and Forecast, By Aircraft Type, 2021 to 2036
- Introduction / Key Findings
- Historical Market Size Value (USD Million) & Volume (Unit) Analysis By Aircraft Type, 2021 to 2025
- Current and Future Market Size Value (USD Million) & Volume (Unit) Analysis and Forecast By Aircraft Type, 2026 to 2036
- Narrowbody
- Widebody
- Regional
- Turboprop
- Business jet
- Helicopter
- Military
- Narrowbody
- Y-o-Y Growth Trend Analysis By Aircraft Type, 2021 to 2025
- Absolute $ Opportunity Analysis By Aircraft Type, 2026 to 2036
- Global Market Analysis and Forecast, By Engine Type, 2021 to 2036
- Introduction / Key Findings
- Historical Market Size Value (USD Million) & Volume (Unit) Analysis By Engine Type, 2021 to 2025
- Current and Future Market Size Value (USD Million) & Volume (Unit) Analysis and Forecast By Engine Type, 2026 to 2036
- Turbofan
- Turboprop
- Turboshaft
- Turbofan
- Y-o-Y Growth Trend Analysis By Engine Type, 2021 to 2025
- Absolute $ Opportunity Analysis By Engine Type, 2026 to 2036
- Global Market Analysis and Forecast, By Integration Level
- Introduction / Key Findings
- Historical Market Size Value (USD Million) & Volume (Unit) Analysis By Integration Level, 2021 to 2025
- Current and Future Market Size Value (USD Million) & Volume (Unit) Analysis and Forecast By Integration Level, 2026 to 2036
- Integrated systems
- Semi-integrated
- Retrofit kits
- Integrated systems
- Y-o-Y Growth Trend Analysis By Integration Level, 2021 to 2025
- Absolute $ Opportunity Analysis By Integration Level, 2026 to 2036
- Global Market Analysis and Forecast, By Sales Channel
- Introduction / Key Findings
- Historical Market Size Value (USD Million) & Volume (Unit) Analysis By Sales Channel, 2021 to 2025
- Current and Future Market Size Value (USD Million) & Volume (Unit) Analysis and Forecast By Sales Channel, 2026 to 2036
- Aftermarket
- OEM supply
- MRO
- Aftermarket
- Y-o-Y Growth Trend Analysis By Sales Channel, 2021 to 2025
- Absolute $ Opportunity Analysis By Sales Channel, 2026 to 2036
- Global Market Analysis and Forecast, By Region, 2021 to 2036
- Introduction
- Historical Market Size Value (USD Million) & Volume (Unit) Analysis By Region, 2021 to 2025
- Current Market Size Value (USD Million) & Volume (Unit) Analysis and Forecast By Region, 2026 to 2036
- North America
- Latin America
- Western Europe
- Eastern Europe
- East Asia
- South Asia and Pacific
- Middle East & Africa
- Market Attractiveness Analysis By Region
- North America Market Analysis and Forecast, By Country, 2021 to 2036
- Historical Market Size Value (USD Million) & Volume (Unit) Trend Analysis By Market Taxonomy, 2021 to 2025
- Market Size Value (USD Million) & Volume (Unit) Forecast By Market Taxonomy, 2026 to 2036
- By Country
- USA
- Canada
- Mexico
- By Protection Method
- By Component Type
- By Material
- By Aircraft Type
- By Engine Type
- By Integration Level
- By Sales Channel
- By Country
- Market Attractiveness Analysis
- By Country
- By Protection Method
- By Component Type
- By Material
- By Aircraft Type
- By Engine Type
- By Integration Level
- By Sales Channel
- Key Takeaways
- Latin America Market Analysis and Forecast, By Country
- Historical Market Size Value (USD Million) & Volume (Unit) Trend Analysis By Market Taxonomy, 2021 to 2025
- Market Size Value (USD Million) & Volume (Unit) Forecast By Market Taxonomy, 2026 to 2036
- By Country
- Brazil
- Chile
- Rest of Latin America
- By Protection Method
- By Component Type
- By Material
- By Aircraft Type
- By Engine Type
- By Integration Level
- By Sales Channel
- By Country
- Market Attractiveness Analysis
- By Country
- By Protection Method
- By Component Type
- By Material
- By Aircraft Type
- By Engine Type
- By Integration Level
- By Sales Channel
- Key Takeaways
- Western Europe Market Analysis and Forecast, By Country
- Historical Market Size Value (USD Million) & Volume (Unit) Trend Analysis By Market Taxonomy, 2021 to 2025
- Market Size Value (USD Million) & Volume (Unit) Forecast By Market Taxonomy, 2026 to 2036
- By Country
- Germany
- UK
- Italy
- Spain
- France
- Nordic
- BENELUX
- Rest of Western Europe
- By Protection Method
- By Component Type
- By Material
- By Aircraft Type
- By Engine Type
- By Integration Level
- By Sales Channel
- By Country
- Market Attractiveness Analysis
- By Country
- By Protection Method
- By Component Type
- By Material
- By Aircraft Type
- By Engine Type
- By Integration Level
- By Sales Channel
- Key Takeaways
- Eastern Europe Market Analysis and Forecast, By Country
- Historical Market Size Value (USD Million) & Volume (Unit) Trend Analysis By Market Taxonomy, 2021 to 2025
- Market Size Value (USD Million) & Volume (Unit) Forecast By Market Taxonomy, 2026 to 2036
- By Country
- Russia
- Poland
- Hungary
- Balkan & Baltic
- Rest of Eastern Europe
- By Protection Method
- By Component Type
- By Material
- By Aircraft Type
- By Engine Type
- By Integration Level
- By Sales Channel
- By Country
- Market Attractiveness Analysis
- By Country
- By Protection Method
- By Component Type
- By Material
- By Aircraft Type
- By Engine Type
- By Integration Level
- By Sales Channel
- Key Takeaways
- East Asia Market Analysis and Forecast, By Country
- Historical Market Size Value (USD Million) & Volume (Unit) Trend Analysis By Market Taxonomy, 2021 to 2025
- Market Size Value (USD Million) & Volume (Unit) Forecast By Market Taxonomy, 2026 to 2036
- By Country
- China
- Japan
- South Korea
- By Protection Method
- By Component Type
- By Material
- By Aircraft Type
- By Engine Type
- By Integration Level
- By Sales Channel
- By Country
- Market Attractiveness Analysis
- By Country
- By Protection Method
- By Component Type
- By Material
- By Aircraft Type
- By Engine Type
- By Integration Level
- By Sales Channel
- Key Takeaways
- South Asia and Pacific Market Analysis and Forecast, By Country
- Historical Market Size Value (USD Million) & Volume (Unit) Trend Analysis By Market Taxonomy, 2021 to 2025
- Market Size Value (USD Million) & Volume (Unit) Forecast By Market Taxonomy, 2026 to 2036
- By Country
- India
- ASEAN
- Australia & New Zealand
- Rest of South Asia and Pacific
- By Protection Method
- By Component Type
- By Material
- By Aircraft Type
- By Engine Type
- By Integration Level
- By Sales Channel
- By Country
- Market Attractiveness Analysis
- By Country
- By Protection Method
- By Component Type
- By Material
- By Aircraft Type
- By Engine Type
- By Integration Level
- By Sales Channel
- Key Takeaways
- Middle East & Africa Market Analysis and Forecast, By Country
- Historical Market Size Value (USD Million) & Volume (Unit) Trend Analysis By Market Taxonomy, 2021 to 2025
- Market Size Value (USD Million) & Volume (Unit) Forecast By Market Taxonomy, 2026 to 2036
- By Country
- Kingdom of Saudi Arabia
- Other GCC Countries
- Türkiye
- South Africa
- Other African Union
- Rest of Middle East & Africa
- By Protection Method
- By Component Type
- By Material
- By Aircraft Type
- By Engine Type
- By Integration Level
- By Sales Channel
- By Country
- Market Attractiveness Analysis
- By Country
- By Protection Method
- By Component Type
- By Material
- By Aircraft Type
- By Engine Type
- By Integration Level
- By Sales Channel
- Key Takeaways
- Key Countries Market Analysis
- USA
- Pricing Analysis
- Market Share Analysis, 2025
- By Protection Method
- By Component Type
- By Material
- By Aircraft Type
- By Engine Type
- By Integration Level
- By Sales Channel
- Canada
- Pricing Analysis
- Market Share Analysis, 2025
- By Protection Method
- By Component Type
- By Material
- By Aircraft Type
- By Engine Type
- By Integration Level
- By Sales Channel
- Mexico
- Pricing Analysis
- Market Share Analysis, 2025
- By Protection Method
- By Component Type
- By Material
- By Aircraft Type
- By Engine Type
- By Integration Level
- By Sales Channel
- Brazil
- Pricing Analysis
- Market Share Analysis, 2025
- By Protection Method
- By Component Type
- By Material
- By Aircraft Type
- By Engine Type
- By Integration Level
- By Sales Channel
- Chile
- Pricing Analysis
- Market Share Analysis, 2025
- By Protection Method
- By Component Type
- By Material
- By Aircraft Type
- By Engine Type
- By Integration Level
- By Sales Channel
- Germany
- Pricing Analysis
- Market Share Analysis, 2025
- By Protection Method
- By Component Type
- By Material
- By Aircraft Type
- By Engine Type
- By Integration Level
- By Sales Channel
- UK
- Pricing Analysis
- Market Share Analysis, 2025
- By Protection Method
- By Component Type
- By Material
- By Aircraft Type
- By Engine Type
- By Integration Level
- By Sales Channel
- Italy
- Pricing Analysis
- Market Share Analysis, 2025
- By Protection Method
- By Component Type
- By Material
- By Aircraft Type
- By Engine Type
- By Integration Level
- By Sales Channel
- Spain
- Pricing Analysis
- Market Share Analysis, 2025
- By Protection Method
- By Component Type
- By Material
- By Aircraft Type
- By Engine Type
- By Integration Level
- By Sales Channel
- France
- Pricing Analysis
- Market Share Analysis, 2025
- By Protection Method
- By Component Type
- By Material
- By Aircraft Type
- By Engine Type
- By Integration Level
- By Sales Channel
- India
- Pricing Analysis
- Market Share Analysis, 2025
- By Protection Method
- By Component Type
- By Material
- By Aircraft Type
- By Engine Type
- By Integration Level
- By Sales Channel
- ASEAN
- Pricing Analysis
- Market Share Analysis, 2025
- By Protection Method
- By Component Type
- By Material
- By Aircraft Type
- By Engine Type
- By Integration Level
- By Sales Channel
- Australia & New Zealand
- Pricing Analysis
- Market Share Analysis, 2025
- By Protection Method
- By Component Type
- By Material
- By Aircraft Type
- By Engine Type
- By Integration Level
- By Sales Channel
- China
- Pricing Analysis
- Market Share Analysis, 2025
- By Protection Method
- By Component Type
- By Material
- By Aircraft Type
- By Engine Type
- By Integration Level
- By Sales Channel
- Japan
- Pricing Analysis
- Market Share Analysis, 2025
- By Protection Method
- By Component Type
- By Material
- By Aircraft Type
- By Engine Type
- By Integration Level
- By Sales Channel
- South Korea
- Pricing Analysis
- Market Share Analysis, 2025
- By Protection Method
- By Component Type
- By Material
- By Aircraft Type
- By Engine Type
- By Integration Level
- By Sales Channel
- Russia
- Pricing Analysis
- Market Share Analysis, 2025
- By Protection Method
- By Component Type
- By Material
- By Aircraft Type
- By Engine Type
- By Integration Level
- By Sales Channel
- Poland
- Pricing Analysis
- Market Share Analysis, 2025
- By Protection Method
- By Component Type
- By Material
- By Aircraft Type
- By Engine Type
- By Integration Level
- By Sales Channel
- Hungary
- Pricing Analysis
- Market Share Analysis, 2025
- By Protection Method
- By Component Type
- By Material
- By Aircraft Type
- By Engine Type
- By Integration Level
- By Sales Channel
- Kingdom of Saudi Arabia
- Pricing Analysis
- Market Share Analysis, 2025
- By Protection Method
- By Component Type
- By Material
- By Aircraft Type
- By Engine Type
- By Integration Level
- By Sales Channel
- Türkiye
- Pricing Analysis
- Market Share Analysis, 2025
- By Protection Method
- By Component Type
- By Material
- By Aircraft Type
- By Engine Type
- By Integration Level
- By Sales Channel
- South Africa
- Pricing Analysis
- Market Share Analysis, 2025
- By Protection Method
- By Component Type
- By Material
- By Aircraft Type
- By Engine Type
- By Integration Level
- By Sales Channel
- USA
- Market Structure Analysis
- Competition Dashboard
- Competition Benchmarking
- Market Share Analysis of Top Players
- By Regional
- By Protection Method
- By Component Type
- By Material
- By Aircraft Type
- By Engine Type
- By Integration Level
- By Sales Channel
- Emerging Startups
- Innovation Benchmarking
- Competition Analysis
- Competition Deep Dive
- Safran Aerosystems
- Overview
- Product Portfolio
- Profitability by Market Segments (Product/Region/Sales Channel)
- Sales Footprint
- Strategy Overview
- Marketing Strategy
- Product Strategy
- Channel Strategy
- Collins Aerospace
- Parker Aerospace
- GKN Aerospace
- ITT Aerospace Controls
- CAV Systems
- Cox & Company
- Hutchinson
- Triumph Group
- Senior Aerospace
- Safran Aerosystems
- Case Studies
- Success Stories
- Recent Developments
- Competition Deep Dive
- Assumptions & Acronyms Used


