Extended Release Drugs Market
Market Insights on Extended Release Drugs covering sales outlook, demand forecast & up-to-date key trends
Extended Release Drugs Market By Drug Release, Distribution Channel & Region - Forecast 2022 – 2032
Extended Release Drugs Market Outlook (2022-2032)
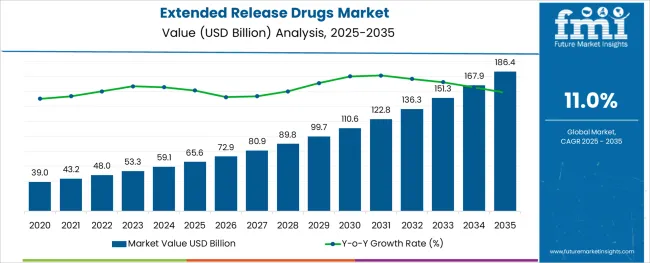
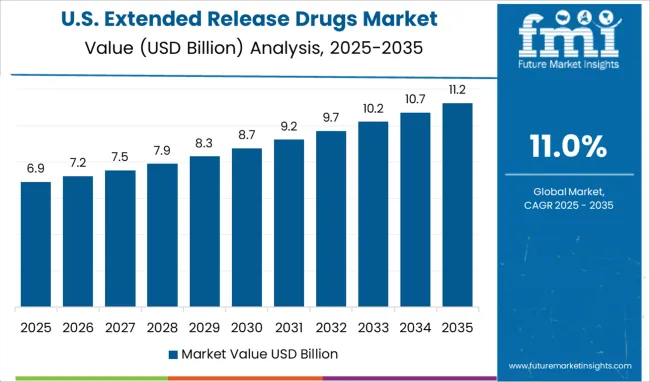
[250 Pages Report] Sales in the extended release drugs market are expected to rise at a CAGR of 11% over the forecast period 2022-2032. Extended release drugs market is currently valued at US$ 48 Bn. Due to changes in the prescription patterns and rising acceptance of diverse dosage forms, demand for extended release drugs is anticipated to bolster in the forthcoming years.
Report Attribute |
Details |
Extended Release Drugs Market Size (2022) |
US$ 48 Bn |
Extended Release Drugs Market Projected Growth Rate (2022-2032) |
11% CAGR |
Conventional drugs release the active ingredient as soon as they are administered. Drug delivery systems are planned technologies that deliver the active ingredient in a controlled environment, controlling the time, rate, and area of drug release in the body. These systems have been proven to be safe and efficient.
Extended release drugs is a dosage formulation that reduces the dosage by half. There are specific regulations released by the FDA that extended release drugs need to comply with.
Growing adoption of various drug delivery systems by doctors and patients, safety and effectiveness of extended drug release, and a reduction in medical care expenditure due to extended release drugs will create a conducive environment for the growth in the market.
Let us know your requirement to get
100% FREE customization
What are the Trends Influencing Sales of Extended Release Drugs?
Compared to conventional oral drugs, extended release drugs are well-planned administration of medication. Extended release drugs control the time, area, and rate of the dosage, thereby increasing the safety and efficacy. With controlled release of the active ingredient, extended release drugs also help to reduce the frequency of dosage, resulting in easier and better acceptance by patients as well as increased bioavailability.
Further, growing demand for pediatric and geriatric extended drug release formulations, widespread acceptance of extended drug release systems, and notable changes in the prescription pattern of doctors will drive the market.
Advancing research & development, ongoing clinical trials in the pharmaceutical sector, and greater focus on the development of new and innovative therapeutics will further bolster the market for extended drug release.
What are the Limitations for Extended Release Drug Manufacturers?
The cost of extended drug release is a major roadblock for manufacturers. A single unit of extended release drugs costs double or triple the conventional oral dosage. The price of Namenda extended release drug is around US$ 494 for 7mg. This is expected to limit sales in the market.
Conventional drugs have an almost immediate impact whereas extended release drugs take a comparatively long time to make an impact as they have a slower course of action.
Side effects such as dose dumping could seriously affect health, which might hamper the growth in the market.
Dose dumping is the quick release of extended release drugs in the circulatory system and can lead to toxicity. Refusal of extended release drugs due to bad taste or swallowing difficulties is another factor that may impede demand in the forthcoming years.
Find your sweet spots for generating winning opportunities in this market.
Talk to AnalystWhat is the North America Extended Release Drug Market Outlook?
Owing to the introduction of new and innovative therapeutics and their widespread acceptance, North America holds a significant share in the global extended release drugs market. Presence of leading pharmaceutical and biopharmaceutical companies, along with increasing investments in research and development in the pharmaceutical sector will propel the growth in the North America extended release drug market.
The growing burden of chronic diseases and adoption of extended release drugs in treatment of hypertension will further underpin the demand for extended release drugs.
What are the Sales Prospects for Extended Release Drugs in Europe?
Increasing adoption of extended release drugs across countries such as Germany, the U.K., Italy and France is expected to boost the Europe extended release market over the assessment period.
Rising incidence of chronic diseases such as COPD, diabetes, and cancer has led to quicker adoption of extended release drugs. This is expected to create opportunities for extended release drug manufacturers operating in Europe.

A unified Market Research Subscription Platform, built for today's disparate research needs.
What is the Scope for Extended Release Drugs Market in Asia Pacific?
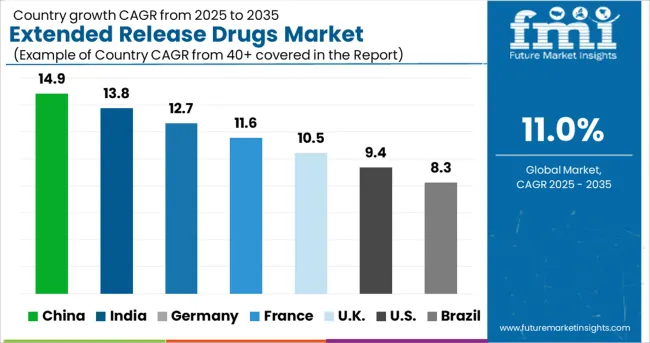
As per FMI, Asia Pacific is predicted to display the highest CAGR during the forecast period. The region has shown great potential in extended release drugs market due to rapid growth of the pharmaceutical industry.
Ongoing expansion of the pharmaceutical and biopharmaceutical sectors across countries including China and India is anticipated to steer sales in the Asia Pacific extended release drugs market.
Market Competition
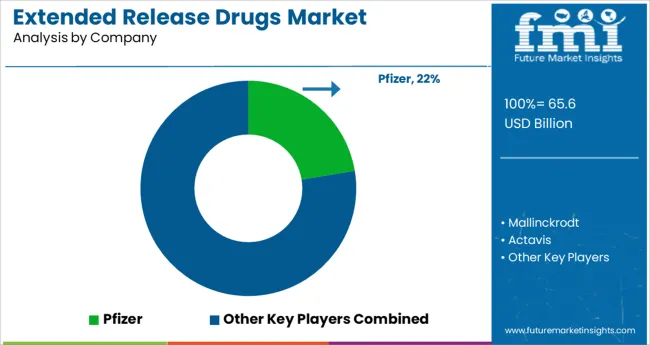
Some of the key players in the the global extended release drugs market are Pfizer, Mallinckrodt, Actavis, Janssen Pharmaceuticals, Endo Pharmaceuticals, Purdue Pharma, Lavipharm Labs, Mylan Technologies, Noven, Aveva, Watson, Impax, and Ranbaxy.
The global extended release drug market is a highly competitive with leading companies focusing on developing novel therapeutics. Mergers and acquisitions are the go-to strategies adopted by key players to expand their product portfolios.
Report Scope
Report Attribute |
Details |
Growth Rate |
CAGR 11% of from 2022 to 2032 |
Base Year for Estimation |
2021 |
Historical Data |
2015-2021 |
Forecast Period |
2022-2032 |
Quantitative Units |
Revenue in US$ Million, and CAGR from 2022-2032 |
Report Coverage |
Revenue Forecast, Volume Forecast, Company Ranking, Competitive Landscape, Growth Factors, Trends and Pricing Analysis |
Segments Covered |
|
Countries Covered |
|
Key Companies Profiled |
|
Customization |
Available Upon Request |
Key Segments Profiled in the Extended Release Drug Market Survey
By Drug Release:
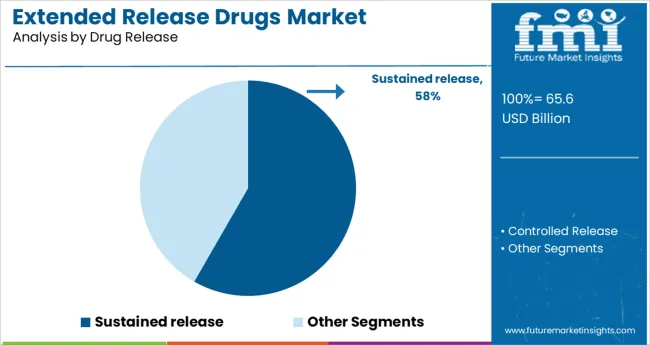
- Sustained release
- Controlled Release
By Distribution Channel:
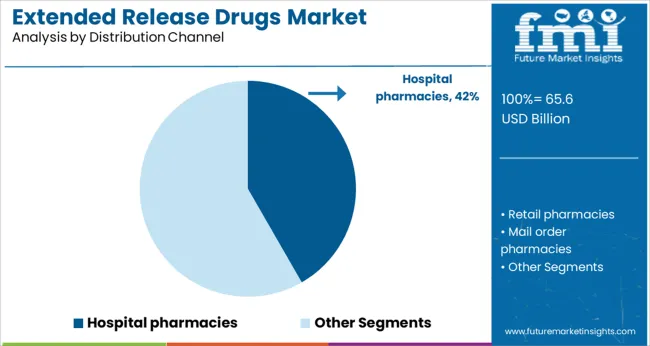
- Hospital pharmacies
- Retail pharmacies
- Mail order pharmacies
- Drug Stores
By Region:
- North America (U.S., Canada)
- Latin America (Mexico. Brazil)
- Western Europe (Germany, Italy, France, U.K, Spain, Nordic countries, Belgium, Netherlands, Luxembourg)
- Eastern Europe (Poland, Russia)
- Asia-Pacific Excluding Japan (China, India, ASEAN, Australia & New Zealand)
- Japan
- The Middle East and Africa (GCC, S. Africa, N. Africa)
Frequently Asked Questions
Which region has high potential for growth in the global extended release drug market?
Due to the rapid growth of the pharmaceutical industry, especially in India and China, Asia Pacific is expected to emerge as an attractive market for extended release drugs.
Who are the key players in the extended release drug market?
Leading players present in the global extended release drug market include Pfizer, Mallinckrodt, Actavis, Janssen Pharmaceuticals, Endo Pharmaceuticals, Purdue Pharma, Lavipharm Labs, Mylan Technologies, Noven, Aveva, Watson, Impax, and Ranbaxy.
What are the positive factors influencing extended release drug market?
Rising demand for pediatric and geriatric extended drug release formulations, and ongoing clinical trials in the pharmaceutical sector are some trends that are expected to drive sales of extended release drugs.
Table of Content
1. Executive Summary 1.1. Global Market Outlook 1.2. Demand-side Trends 1.3. Supply-side Trends 1.4. Technology Roadmap Analysis 1.5. Analysis and Recommendations 2. Market Overview 2.1. Market Coverage / Taxonomy 2.2. Market Definition / Scope / Limitations 3. Market Background 3.1. Market Dynamics 3.1.1. Drivers 3.1.2. Restraints 3.1.3. Opportunity 3.1.4. Trends 3.2. Scenario Forecast 3.2.1. Demand in Optimistic Scenario 3.2.2. Demand in Likely Scenario 3.2.3. Demand in Conservative Scenario 3.3. Opportunity Map Analysis 3.4. Product Life Cycle Analysis 3.5. Supply Chain Analysis 3.5.1. Supply Side Participants and their Roles 3.5.1.1. Producers 3.5.1.2. Mid-Level Participants (Traders/ Agents/ Brokers) 3.5.1.3. Wholesalers and Distributors 3.5.2. Value Added and Value Created at Node in the Supply Chain 3.5.3. List of Raw Material Suppliers 3.5.4. List of Existing and Potential Buyer’s 3.6. Investment Feasibility Matrix 3.7. Value Chain Analysis 3.7.1. Profit Margin Analysis 3.7.2. Wholesalers and Distributors 3.7.3. Retailers 3.8. PESTLE and Porter’s Analysis 3.9. Regulatory Landscape 3.9.1. By Key Regions 3.9.2. By Key Countries 3.10. Regional Parent Market Outlook 3.11. Production and Consumption Statistics 3.12. Import and Export Statistics 4. Global Extended Release Drugs Market Analysis 2017-2021 and Forecast, 2022-2032 4.1. Historical Market Size Value (US$ Mn) & Volume (Tons) Analysis, 2017-2021 4.2. Current and Future Market Size Value (US$ Mn) & Volume (Tons) Projections, 2022-2032 4.2.1. Y-o-Y Growth Trend Analysis 4.2.2. Absolute $ Opportunity Analysis 5. Global Extended Release Drugs Market Analysis 2017-2021 and Forecast 2022-2032, By Drug Release 5.1. Introduction / Key Findings 5.2. Historical Market Size Value (US$ Mn) & Volume (Tons) Analysis By Drug Release, 2017-2021 5.3. Current and Future Market Size Value (US$ Mn) & Volume (Tons) Analysis and Forecast By Drug Release, 2022-2032 5.3.1. Sustained Release 5.3.2. Controlled Release 5.4. Y-o-Y Growth Trend Analysis By Drug Release, 2017-2021 5.5. Absolute $ Opportunity Analysis By Drug Release, 2022-2032 6. Global Extended Release Drugs Market Analysis 2017-2021 and Forecast 2022-2032, By Distributional Channel 6.1. Introduction / Key Findings 6.2. Historical Market Size Value (US$ Mn) & Volume (Tons) Analysis By Distributional Channel, 2017-2021 6.3. Current and Future Market Size Value (US$ Mn) & Volume (Tons) Analysis and Forecast By Distributional Channel, 2022-2032 6.3.1. Hospital Pharmacies 6.3.2. Retail Pharmacies 6.3.3. Mail Order Pharmacies 6.3.4. Drug Stores 6.4. Y-o-Y Growth Trend Analysis By Distributional Channel, 2017-2021 6.5. Absolute $ Opportunity Analysis By Distributional Channel, 2022-2032 7. Global Extended Release Drugs Market Analysis 2017-2021 and Forecast 2022-2032, By Region 7.1. Introduction 7.2. Historical Market Size Value (US$ Mn) & Volume (Tons) Analysis By Region, 2017-2021 7.3. Current Market Size Value (US$ Mn) & Volume (Tons) Analysis and Forecast By Region, 2022-2032 7.3.1. North America 7.3.2. Latin America 7.3.3. Europe 7.3.4. East Asia 7.3.5. South Asia & Pacific 7.3.6. MEA 7.4. Market Attractiveness Analysis By Region 8. North America Extended Release Drugs Market Analysis 2017-2021 and Forecast 2022-2032, By Country 8.1. Historical Market Size Value (US$ Mn) & Volume (Tons) Trend Analysis By Market Taxonomy, 2017-2021 8.2. Market Size Value (US$ Mn) & Volume (Tons) Forecast By Market Taxonomy, 2022-2032 8.2.1. By Country 8.2.1.1. U.S. 8.2.1.2. Canada 8.2.2. By Drug Release 8.2.3. By Distributional Channel 8.3. Market Attractiveness Analysis 8.3.1. By Country 8.3.2. By Drug Release 8.3.3. By Distributional Channel 8.4. Key Takeaways 9. Latin America Extended Release Drugs Market Analysis 2017-2021 and Forecast 2022-2032, By Country 9.1. Historical Market Size Value (US$ Mn) & Volume (Tons) Trend Analysis By Market Taxonomy, 2017-2021 9.2. Market Size Value (US$ Mn) & Volume (Tons) Forecast By Market Taxonomy, 2022-2032 9.2.1. By Country 9.2.1.1. Brazil 9.2.1.2. Mexico 9.2.1.3. Rest of Latin America 9.2.2. By Drug Release 9.2.3. By Distributional Channel 9.3. Market Attractiveness Analysis 9.3.1. By Country 9.3.2. By Drug Release 9.3.3. By Distributional Channel 9.4. Key Takeaways 10. Europe Extended Release Drugs Market Analysis 2017-2021 and Forecast 2022-2032, By Country 10.1. Historical Market Size Value (US$ Mn) & Volume (Tons) Trend Analysis By Market Taxonomy, 2017-2021 10.2. Market Size Value (US$ Mn) & Volume (Tons) Forecast By Market Taxonomy, 2022-2032 10.2.1. By Country 10.2.1.1. Germany 10.2.1.2. U.K. 10.2.1.3. France 10.2.1.4. Spain 10.2.1.5. Italy 10.2.1.6. Rest of Europe 10.2.2. By Drug Release 10.2.3. By Distributional Channel 10.3. Market Attractiveness Analysis 10.3.1. By Country 10.3.2. By Drug Release 10.3.3. By Distributional Channel 10.4. Key Takeaways 11. East Asia Extended Release Drugs Market Analysis 2017-2021 and Forecast 2022-2032, By Country 11.1. Historical Market Size Value (US$ Mn) & Volume (Tons) Trend Analysis By Market Taxonomy, 2017-2021 11.2. Market Size Value (US$ Mn) & Volume (Tons) Forecast By Market Taxonomy, 2022-2032 11.2.1. By Country 11.2.1.1. China 11.2.1.2. Japan 11.2.1.3. South Korea 11.2.2. By Drug Release 11.2.3. By Distributional Channel 11.3. Market Attractiveness Analysis 11.3.1. By Country 11.3.2. By Drug Release 11.3.3. By Distributional Channel 11.4. Key Takeaways 12. South Asia & Pacific Extended Release Drugs Market Analysis 2017-2021 and Forecast 2022-2032, By Country 12.1. Historical Market Size Value (US$ Mn) & Volume (Tons) Trend Analysis By Market Taxonomy, 2017-2021 12.2. Market Size Value (US$ Mn) & Volume (Tons) Forecast By Market Taxonomy, 2022-2032 12.2.1. By Country 12.2.1.1. India 12.2.1.2. Thailand 12.2.1.3. Indonesia 12.2.1.4. Malaysia 12.2.1.5. Singapore 12.2.1.6. Australia 12.2.1.7. New Zealand 12.2.1.8. Rest of South Asia & Pacific 12.2.2. By Drug Release 12.2.3. By Distributional Channel 12.3. Market Attractiveness Analysis 12.3.1. By Country 12.3.2. By Drug Release 12.3.3. By Distributional Channel 12.4. Key Takeaways 13. MEA Extended Release Drugs Market Analysis 2017-2021 and Forecast 2022-2032, By Country 13.1. Historical Market Size Value (US$ Mn) & Volume (Tons) Trend Analysis By Market Taxonomy, 2017-2021 13.2. Market Size Value (US$ Mn) & Volume (Tons) Forecast By Market Taxonomy, 2022-2032 13.2.1. By Country 13.2.1.1. GCC Countries 13.2.1.2. South Africa 13.2.1.3. Israel 13.2.1.4. Rest of MEA 13.2.2. By Drug Release 13.2.3. By Distributional Channel 13.3. Market Attractiveness Analysis 13.3.1. By Country 13.3.2. By Drug Release 13.3.3. By Distributional Channel 13.4. Key Takeaways 14. Key Countries Extended Release Drugs Market Analysis 14.1. U.S. 14.1.1. Pricing Analysis 14.1.2. Market Share Analysis, 2021 14.1.2.1. By Drug Release 14.1.2.2. By Distributional Channel 14.2. Canada 14.2.1. Pricing Analysis 14.2.2. Market Share Analysis, 2021 14.2.2.1. By Drug Release 14.2.2.2. By Distributional Channel 14.3. Brazil 14.3.1. Pricing Analysis 14.3.2. Market Share Analysis, 2021 14.3.2.1. By Drug Release 14.3.2.2. By Distributional Channel 14.4. Mexico 14.4.1. Pricing Analysis 14.4.2. Market Share Analysis, 2021 14.4.2.1. By Drug Release 14.4.2.2. By Distributional Channel 14.5. Germany 14.5.1. Pricing Analysis 14.5.2. Market Share Analysis, 2021 14.5.2.1. By Drug Release 14.5.2.2. By Distributional Channel 14.6. U.K. 14.6.1. Pricing Analysis 14.6.2. Market Share Analysis, 2021 14.6.2.1. By Drug Release 14.6.2.2. By Distributional Channel 14.7. France 14.7.1. Pricing Analysis 14.7.2. Market Share Analysis, 2021 14.7.2.1. By Drug Release 14.7.2.2. By Distributional Channel 14.8. Spain 14.8.1. Pricing Analysis 14.8.2. Market Share Analysis, 2021 14.8.2.1. By Drug Release 14.8.2.2. By Distributional Channel 14.9. Italy 14.9.1. Pricing Analysis 14.9.2. Market Share Analysis, 2021 14.9.2.1. By Drug Release 14.9.2.2. By Distributional Channel 14.10. China 14.10.1. Pricing Analysis 14.10.2. Market Share Analysis, 2021 14.10.2.1. By Drug Release 14.10.2.2. By Distributional Channel 14.11. Japan 14.11.1. Pricing Analysis 14.11.2. Market Share Analysis, 2021 14.11.2.1. By Drug Release 14.11.2.2. By Distributional Channel 14.12. South Korea 14.12.1. Pricing Analysis 14.12.2. Market Share Analysis, 2021 14.12.2.1. By Drug Release 14.12.2.2. By Distributional Channel 14.13. India 14.13.1. Pricing Analysis 14.13.2. Market Share Analysis, 2021 14.13.2.1. By Drug Release 14.13.2.2. By Distributional Channel 14.14. Thailand 14.14.1. Pricing Analysis 14.14.2. Market Share Analysis, 2021 14.14.2.1. By Drug Release 14.14.2.2. By Distributional Channel 14.15. Indonesia 14.15.1. Pricing Analysis 14.15.2. Market Share Analysis, 2021 14.15.2.1. By Drug Release 14.15.2.2. By Distributional Channel 14.16. Malaysia 14.16.1. Pricing Analysis 14.16.2. Market Share Analysis, 2021 14.16.2.1. By Drug Release 14.16.2.2. By Distributional Channel 14.17. Singapore 14.17.1. Pricing Analysis 14.17.2. Market Share Analysis, 2021 14.17.2.1. By Drug Release 14.17.2.2. By Distributional Channel 14.18. Australia 14.18.1. Pricing Analysis 14.18.2. Market Share Analysis, 2021 14.18.2.1. By Drug Release 14.18.2.2. By Distributional Channel 14.19. New Zealand 14.19.1. Pricing Analysis 14.19.2. Market Share Analysis, 2021 14.19.2.1. By Drug Release 14.19.2.2. By Distributional Channel 14.20. GCC Countries 14.20.1. Pricing Analysis 14.20.2. Market Share Analysis, 2021 14.20.2.1. By Drug Release 14.20.2.2. By Distributional Channel 14.21. South Africa 14.21.1. Pricing Analysis 14.21.2. Market Share Analysis, 2021 14.21.2.1. By Drug Release 14.21.2.2. By Distributional Channel 14.22. Israel 14.22.1. Pricing Analysis 14.22.2. Market Share Analysis, 2021 14.22.2.1. By Drug Release 14.22.2.2. By Distributional Channel 15. Market Structure Analysis 15.1. Competition Dashboard 15.2. Competition Benchmarking 15.3. Market Share Analysis of Top Players 15.3.1. By Regional 15.3.2. By Drug Release 15.3.3. By Distributional Channel 16. Competition Analysis 16.1. Competition Deep Dive 16.1.1. Pfizer 16.1.1.1. Overview 16.1.1.2. Product Portfolio 16.1.1.3. Profitability by Market Segments 16.1.1.4. Sales Footprint 16.1.1.5. Strategy Overview 16.1.1.5.1. Marketing Strategy 16.1.1.5.2. Product Strategy 16.1.1.5.3. Channel Strategy 16.1.2. Mallinckrodt 16.1.2.1. Overview 16.1.2.2. Product Portfolio 16.1.2.3. Profitability by Market Segments 16.1.2.4. Sales Footprint 16.1.2.5. Strategy Overview 16.1.2.5.1. Marketing Strategy 16.1.2.5.2. Product Strategy 16.1.2.5.3. Channel Strategy 16.1.3. Actavis 16.1.3.1. Overview 16.1.3.2. Product Portfolio 16.1.3.3. Profitability by Market Segments 16.1.3.4. Sales Footprint 16.1.3.5. Strategy Overview 16.1.3.5.1. Marketing Strategy 16.1.3.5.2. Product Strategy 16.1.3.5.3. Channel Strategy 16.1.4. Janssen Pharmaceuticals 16.1.4.1. Overview 16.1.4.2. Product Portfolio 16.1.4.3. Profitability by Market Segments 16.1.4.4. Sales Footprint 16.1.4.5. Strategy Overview 16.1.4.5.1. Marketing Strategy 16.1.4.5.2. Product Strategy 16.1.4.5.3. Channel Strategy 16.1.5. Endo Pharmaceuticals 16.1.5.1. Overview 16.1.5.2. Product Portfolio 16.1.5.3. Profitability by Market Segments 16.1.5.4. Sales Footprint 16.1.5.5. Strategy Overview 16.1.5.5.1. Marketing Strategy 16.1.5.5.2. Product Strategy 16.1.5.5.3. Channel Strategy 16.1.6. Purdue Pharma 16.1.6.1. Overview 16.1.6.2. Product Portfolio 16.1.6.3. Profitability by Market Segments 16.1.6.4. Sales Footprint 16.1.6.5. Strategy Overview 16.1.6.5.1. Marketing Strategy 16.1.6.5.2. Product Strategy 16.1.6.5.3. Channel Strategy 16.1.7. Lavipharm Labs 16.1.7.1. Overview 16.1.7.2. Product Portfolio 16.1.7.3. Profitability by Market Segments 16.1.7.4. Sales Footprint 16.1.7.5. Strategy Overview 16.1.7.5.1. Marketing Strategy 16.1.7.5.2. Product Strategy 16.1.7.5.3. Channel Strategy 16.1.8. Viatris 16.1.8.1. Overview 16.1.8.2. Product Portfolio 16.1.8.3. Profitability by Market Segments 16.1.8.4. Sales Footprint 16.1.8.5. Strategy Overview 16.1.8.5.1. Marketing Strategy 16.1.8.5.2. Product Strategy 16.1.8.5.3. Channel Strategy 16.1.9. Noven 16.1.9.1. Overview 16.1.9.2. Product Portfolio 16.1.9.3. Profitability by Market Segments 16.1.9.4. Sales Footprint 16.1.9.5. Strategy Overview 16.1.9.5.1. Marketing Strategy 16.1.9.5.2. Product Strategy 16.1.9.5.3. Channel Strategy 16.1.10. Aveva 16.1.10.1. Overview 16.1.10.2. Product Portfolio 16.1.10.3. Profitability by Market Segments 16.1.10.4. Sales Footprint 16.1.10.5. Strategy Overview 16.1.10.5.1. Marketing Strategy 16.1.10.5.2. Product Strategy 16.1.10.5.3. Channel Strategy 16.1.11. Watson 16.1.11.1. Overview 16.1.11.2. Product Portfolio 16.1.11.3. Profitability by Market Segments 16.1.11.4. Sales Footprint 16.1.11.5. Strategy Overview 16.1.11.5.1. Marketing Strategy 16.1.11.5.2. Product Strategy 16.1.11.5.3. Channel Strategy 16.1.12. Impax 16.1.12.1. Overview 16.1.12.2. Product Portfolio 16.1.12.3. Profitability by Market Segments 16.1.12.4. Sales Footprint 16.1.12.5. Strategy Overview 16.1.12.5.1. Marketing Strategy 16.1.12.5.2. Product Strategy 16.1.12.5.3. Channel Strategy 16.1.13. Ranbaxy 16.1.13.1. Overview 16.1.13.2. Product Portfolio 16.1.13.3. Profitability by Market Segments 16.1.13.4. Sales Footprint 16.1.13.5. Strategy Overview 16.1.13.5.1. Marketing Strategy 16.1.13.5.2. Product Strategy 16.1.13.5.3. Channel Strategy 17. Assumptions & Acronyms Used 18. Research Methodology
Let us know your requirement to get
100% FREE customization
List of Tables
Table 1: Global Extended Release Drugs Market Value (US$ Mn) Forecast by Region, 2017-2032 Table 2: Global Extended Release Drugs Market Volume (Tons) Forecast by Region, 2017-2032 Table 3: Global Extended Release Drugs Market Value (US$ Mn) Forecast by Drug Release, 2017-2032 Table 4: Global Extended Release Drugs Market Volume (Tons) Forecast by Drug Release, 2017-2032 Table 5: Global Extended Release Drugs Market Value (US$ Mn) Forecast by Distributional Channel, 2017-2032 Table 6: Global Extended Release Drugs Market Volume (Tons) Forecast by Distributional Channel, 2017-2032 Table 7: North America Extended Release Drugs Market Value (US$ Mn) Forecast by Country, 2017-2032 Table 8: North America Extended Release Drugs Market Volume (Tons) Forecast by Country, 2017-2032 Table 9: North America Extended Release Drugs Market Value (US$ Mn) Forecast by Drug Release, 2017-2032 Table 10: North America Extended Release Drugs Market Volume (Tons) Forecast by Drug Release, 2017-2032 Table 11: North America Extended Release Drugs Market Value (US$ Mn) Forecast by Distributional Channel, 2017-2032 Table 12: North America Extended Release Drugs Market Volume (Tons) Forecast by Distributional Channel, 2017-2032 Table 13: Latin America Extended Release Drugs Market Value (US$ Mn) Forecast by Country, 2017-2032 Table 14: Latin America Extended Release Drugs Market Volume (Tons) Forecast by Country, 2017-2032 Table 15: Latin America Extended Release Drugs Market Value (US$ Mn) Forecast by Drug Release, 2017-2032 Table 16: Latin America Extended Release Drugs Market Volume (Tons) Forecast by Drug Release, 2017-2032 Table 17: Latin America Extended Release Drugs Market Value (US$ Mn) Forecast by Distributional Channel, 2017-2032 Table 18: Latin America Extended Release Drugs Market Volume (Tons) Forecast by Distributional Channel, 2017-2032 Table 19: Europe Extended Release Drugs Market Value (US$ Mn) Forecast by Country, 2017-2032 Table 20: Europe Extended Release Drugs Market Volume (Tons) Forecast by Country, 2017-2032 Table 21: Europe Extended Release Drugs Market Value (US$ Mn) Forecast by Drug Release, 2017-2032 Table 22: Europe Extended Release Drugs Market Volume (Tons) Forecast by Drug Release, 2017-2032 Table 23: Europe Extended Release Drugs Market Value (US$ Mn) Forecast by Distributional Channel, 2017-2032 Table 24: Europe Extended Release Drugs Market Volume (Tons) Forecast by Distributional Channel, 2017-2032 Table 25: East Asia Extended Release Drugs Market Value (US$ Mn) Forecast by Country, 2017-2032 Table 26: East Asia Extended Release Drugs Market Volume (Tons) Forecast by Country, 2017-2032 Table 27: East Asia Extended Release Drugs Market Value (US$ Mn) Forecast by Drug Release, 2017-2032 Table 28: East Asia Extended Release Drugs Market Volume (Tons) Forecast by Drug Release, 2017-2032 Table 29: East Asia Extended Release Drugs Market Value (US$ Mn) Forecast by Distributional Channel, 2017-2032 Table 30: East Asia Extended Release Drugs Market Volume (Tons) Forecast by Distributional Channel, 2017-2032 Table 31: South Asia & Pacific Extended Release Drugs Market Value (US$ Mn) Forecast by Country, 2017-2032 Table 32: South Asia & Pacific Extended Release Drugs Market Volume (Tons) Forecast by Country, 2017-2032 Table 33: South Asia & Pacific Extended Release Drugs Market Value (US$ Mn) Forecast by Drug Release, 2017-2032 Table 34: South Asia & Pacific Extended Release Drugs Market Volume (Tons) Forecast by Drug Release, 2017-2032 Table 35: South Asia & Pacific Extended Release Drugs Market Value (US$ Mn) Forecast by Distributional Channel, 2017-2032 Table 36: South Asia & Pacific Extended Release Drugs Market Volume (Tons) Forecast by Distributional Channel, 2017-2032 Table 37: MEA Extended Release Drugs Market Value (US$ Mn) Forecast by Country, 2017-2032 Table 38: MEA Extended Release Drugs Market Volume (Tons) Forecast by Country, 2017-2032 Table 39: MEA Extended Release Drugs Market Value (US$ Mn) Forecast by Drug Release, 2017-2032 Table 40: MEA Extended Release Drugs Market Volume (Tons) Forecast by Drug Release, 2017-2032 Table 41: MEA Extended Release Drugs Market Value (US$ Mn) Forecast by Distributional Channel, 2017-2032 Table 42: MEA Extended Release Drugs Market Volume (Tons) Forecast by Distributional Channel, 2017-2032
Find your sweet spots for generating winning opportunities in this market.
Talk to AnalystList of Charts
Figure 1: Global Extended Release Drugs Market Value (US$ Mn) by Drug Release, 2022-2032 Figure 2: Global Extended Release Drugs Market Value (US$ Mn) by Distributional Channel, 2022-2032 Figure 3: Global Extended Release Drugs Market Value (US$ Mn) by Region, 2022-2032 Figure 4: Global Extended Release Drugs Market Value (US$ Mn) Analysis by Region, 2017-2032 Figure 5: Global Extended Release Drugs Market Volume (Tons) Analysis by Region, 2017-2032 Figure 6: Global Extended Release Drugs Market Value Share (%) and BPS Analysis by Region, 2022-2032 Figure 7: Global Extended Release Drugs Market Y-o-Y Growth (%) Projections by Region, 2022-2032 Figure 8: Global Extended Release Drugs Market Value (US$ Mn) Analysis by Drug Release, 2017-2032 Figure 9: Global Extended Release Drugs Market Volume (Tons) Analysis by Drug Release, 2017-2032 Figure 10: Global Extended Release Drugs Market Value Share (%) and BPS Analysis by Drug Release, 2022-2032 Figure 11: Global Extended Release Drugs Market Y-o-Y Growth (%) Projections by Drug Release, 2022-2032 Figure 12: Global Extended Release Drugs Market Value (US$ Mn) Analysis by Distributional Channel, 2017-2032 Figure 13: Global Extended Release Drugs Market Volume (Tons) Analysis by Distributional Channel, 2017-2032 Figure 14: Global Extended Release Drugs Market Value Share (%) and BPS Analysis by Distributional Channel, 2022-2032 Figure 15: Global Extended Release Drugs Market Y-o-Y Growth (%) Projections by Distributional Channel, 2022-2032 Figure 16: Global Extended Release Drugs Market Attractiveness by Drug Release, 2022-2032 Figure 17: Global Extended Release Drugs Market Attractiveness by Distributional Channel, 2022-2032 Figure 18: Global Extended Release Drugs Market Attractiveness by Region, 2022-2032 Figure 19: North America Extended Release Drugs Market Value (US$ Mn) by Drug Release, 2022-2032 Figure 20: North America Extended Release Drugs Market Value (US$ Mn) by Distributional Channel, 2022-2032 Figure 21: North America Extended Release Drugs Market Value (US$ Mn) by Country, 2022-2032 Figure 22: North America Extended Release Drugs Market Value (US$ Mn) Analysis by Country, 2017-2032 Figure 23: North America Extended Release Drugs Market Volume (Tons) Analysis by Country, 2017-2032 Figure 24: North America Extended Release Drugs Market Value Share (%) and BPS Analysis by Country, 2022-2032 Figure 25: North America Extended Release Drugs Market Y-o-Y Growth (%) Projections by Country, 2022-2032 Figure 26: North America Extended Release Drugs Market Value (US$ Mn) Analysis by Drug Release, 2017-2032 Figure 27: North America Extended Release Drugs Market Volume (Tons) Analysis by Drug Release, 2017-2032 Figure 28: North America Extended Release Drugs Market Value Share (%) and BPS Analysis by Drug Release, 2022-2032 Figure 29: North America Extended Release Drugs Market Y-o-Y Growth (%) Projections by Drug Release, 2022-2032 Figure 30: North America Extended Release Drugs Market Value (US$ Mn) Analysis by Distributional Channel, 2017-2032 Figure 31: North America Extended Release Drugs Market Volume (Tons) Analysis by Distributional Channel, 2017-2032 Figure 32: North America Extended Release Drugs Market Value Share (%) and BPS Analysis by Distributional Channel, 2022-2032 Figure 33: North America Extended Release Drugs Market Y-o-Y Growth (%) Projections by Distributional Channel, 2022-2032 Figure 34: North America Extended Release Drugs Market Attractiveness by Drug Release, 2022-2032 Figure 35: North America Extended Release Drugs Market Attractiveness by Distributional Channel, 2022-2032 Figure 36: North America Extended Release Drugs Market Attractiveness by Country, 2022-2032 Figure 37: Latin America Extended Release Drugs Market Value (US$ Mn) by Drug Release, 2022-2032 Figure 38: Latin America Extended Release Drugs Market Value (US$ Mn) by Distributional Channel, 2022-2032 Figure 39: Latin America Extended Release Drugs Market Value (US$ Mn) by Country, 2022-2032 Figure 40: Latin America Extended Release Drugs Market Value (US$ Mn) Analysis by Country, 2017-2032 Figure 41: Latin America Extended Release Drugs Market Volume (Tons) Analysis by Country, 2017-2032 Figure 42: Latin America Extended Release Drugs Market Value Share (%) and BPS Analysis by Country, 2022-2032 Figure 43: Latin America Extended Release Drugs Market Y-o-Y Growth (%) Projections by Country, 2022-2032 Figure 44: Latin America Extended Release Drugs Market Value (US$ Mn) Analysis by Drug Release, 2017-2032 Figure 45: Latin America Extended Release Drugs Market Volume (Tons) Analysis by Drug Release, 2017-2032 Figure 46: Latin America Extended Release Drugs Market Value Share (%) and BPS Analysis by Drug Release, 2022-2032 Figure 47: Latin America Extended Release Drugs Market Y-o-Y Growth (%) Projections by Drug Release, 2022-2032 Figure 48: Latin America Extended Release Drugs Market Value (US$ Mn) Analysis by Distributional Channel, 2017-2032 Figure 49: Latin America Extended Release Drugs Market Volume (Tons) Analysis by Distributional Channel, 2017-2032 Figure 50: Latin America Extended Release Drugs Market Value Share (%) and BPS Analysis by Distributional Channel, 2022-2032 Figure 51: Latin America Extended Release Drugs Market Y-o-Y Growth (%) Projections by Distributional Channel, 2022-2032 Figure 52: Latin America Extended Release Drugs Market Attractiveness by Drug Release, 2022-2032 Figure 53: Latin America Extended Release Drugs Market Attractiveness by Distributional Channel, 2022-2032 Figure 54: Latin America Extended Release Drugs Market Attractiveness by Country, 2022-2032 Figure 55: Europe Extended Release Drugs Market Value (US$ Mn) by Drug Release, 2022-2032 Figure 56: Europe Extended Release Drugs Market Value (US$ Mn) by Distributional Channel, 2022-2032 Figure 57: Europe Extended Release Drugs Market Value (US$ Mn) by Country, 2022-2032 Figure 58: Europe Extended Release Drugs Market Value (US$ Mn) Analysis by Country, 2017-2032 Figure 59: Europe Extended Release Drugs Market Volume (Tons) Analysis by Country, 2017-2032 Figure 60: Europe Extended Release Drugs Market Value Share (%) and BPS Analysis by Country, 2022-2032 Figure 61: Europe Extended Release Drugs Market Y-o-Y Growth (%) Projections by Country, 2022-2032 Figure 62: Europe Extended Release Drugs Market Value (US$ Mn) Analysis by Drug Release, 2017-2032 Figure 63: Europe Extended Release Drugs Market Volume (Tons) Analysis by Drug Release, 2017-2032 Figure 64: Europe Extended Release Drugs Market Value Share (%) and BPS Analysis by Drug Release, 2022-2032 Figure 65: Europe Extended Release Drugs Market Y-o-Y Growth (%) Projections by Drug Release, 2022-2032 Figure 66: Europe Extended Release Drugs Market Value (US$ Mn) Analysis by Distributional Channel, 2017-2032 Figure 67: Europe Extended Release Drugs Market Volume (Tons) Analysis by Distributional Channel, 2017-2032 Figure 68: Europe Extended Release Drugs Market Value Share (%) and BPS Analysis by Distributional Channel, 2022-2032 Figure 69: Europe Extended Release Drugs Market Y-o-Y Growth (%) Projections by Distributional Channel, 2022-2032 Figure 70: Europe Extended Release Drugs Market Attractiveness by Drug Release, 2022-2032 Figure 71: Europe Extended Release Drugs Market Attractiveness by Distributional Channel, 2022-2032 Figure 72: Europe Extended Release Drugs Market Attractiveness by Country, 2022-2032 Figure 73: East Asia Extended Release Drugs Market Value (US$ Mn) by Drug Release, 2022-2032 Figure 74: East Asia Extended Release Drugs Market Value (US$ Mn) by Distributional Channel, 2022-2032 Figure 75: East Asia Extended Release Drugs Market Value (US$ Mn) by Country, 2022-2032 Figure 76: East Asia Extended Release Drugs Market Value (US$ Mn) Analysis by Country, 2017-2032 Figure 77: East Asia Extended Release Drugs Market Volume (Tons) Analysis by Country, 2017-2032 Figure 78: East Asia Extended Release Drugs Market Value Share (%) and BPS Analysis by Country, 2022-2032 Figure 79: East Asia Extended Release Drugs Market Y-o-Y Growth (%) Projections by Country, 2022-2032 Figure 80: East Asia Extended Release Drugs Market Value (US$ Mn) Analysis by Drug Release, 2017-2032 Figure 81: East Asia Extended Release Drugs Market Volume (Tons) Analysis by Drug Release, 2017-2032 Figure 82: East Asia Extended Release Drugs Market Value Share (%) and BPS Analysis by Drug Release, 2022-2032 Figure 83: East Asia Extended Release Drugs Market Y-o-Y Growth (%) Projections by Drug Release, 2022-2032 Figure 84: East Asia Extended Release Drugs Market Value (US$ Mn) Analysis by Distributional Channel, 2017-2032 Figure 85: East Asia Extended Release Drugs Market Volume (Tons) Analysis by Distributional Channel, 2017-2032 Figure 86: East Asia Extended Release Drugs Market Value Share (%) and BPS Analysis by Distributional Channel, 2022-2032 Figure 87: East Asia Extended Release Drugs Market Y-o-Y Growth (%) Projections by Distributional Channel, 2022-2032 Figure 88: East Asia Extended Release Drugs Market Attractiveness by Drug Release, 2022-2032 Figure 89: East Asia Extended Release Drugs Market Attractiveness by Distributional Channel, 2022-2032 Figure 90: East Asia Extended Release Drugs Market Attractiveness by Country, 2022-2032 Figure 91: South Asia & Pacific Extended Release Drugs Market Value (US$ Mn) by Drug Release, 2022-2032 Figure 92: South Asia & Pacific Extended Release Drugs Market Value (US$ Mn) by Distributional Channel, 2022-2032 Figure 93: South Asia & Pacific Extended Release Drugs Market Value (US$ Mn) by Country, 2022-2032 Figure 94: South Asia & Pacific Extended Release Drugs Market Value (US$ Mn) Analysis by Country, 2017-2032 Figure 95: South Asia & Pacific Extended Release Drugs Market Volume (Tons) Analysis by Country, 2017-2032 Figure 96: South Asia & Pacific Extended Release Drugs Market Value Share (%) and BPS Analysis by Country, 2022-2032 Figure 97: South Asia & Pacific Extended Release Drugs Market Y-o-Y Growth (%) Projections by Country, 2022-2032 Figure 98: South Asia & Pacific Extended Release Drugs Market Value (US$ Mn) Analysis by Drug Release, 2017-2032 Figure 99: South Asia & Pacific Extended Release Drugs Market Volume (Tons) Analysis by Drug Release, 2017-2032 Figure 100: South Asia & Pacific Extended Release Drugs Market Value Share (%) and BPS Analysis by Drug Release, 2022-2032 Figure 101: South Asia & Pacific Extended Release Drugs Market Y-o-Y Growth (%) Projections by Drug Release, 2022-2032 Figure 102: South Asia & Pacific Extended Release Drugs Market Value (US$ Mn) Analysis by Distributional Channel, 2017-2032 Figure 103: South Asia & Pacific Extended Release Drugs Market Volume (Tons) Analysis by Distributional Channel, 2017-2032 Figure 104: South Asia & Pacific Extended Release Drugs Market Value Share (%) and BPS Analysis by Distributional Channel, 2022-2032 Figure 105: South Asia & Pacific Extended Release Drugs Market Y-o-Y Growth (%) Projections by Distributional Channel, 2022-2032 Figure 106: South Asia & Pacific Extended Release Drugs Market Attractiveness by Drug Release, 2022-2032 Figure 107: South Asia & Pacific Extended Release Drugs Market Attractiveness by Distributional Channel, 2022-2032 Figure 108: South Asia & Pacific Extended Release Drugs Market Attractiveness by Country, 2022-2032 Figure 109: MEA Extended Release Drugs Market Value (US$ Mn) by Drug Release, 2022-2032 Figure 110: MEA Extended Release Drugs Market Value (US$ Mn) by Distributional Channel, 2022-2032 Figure 111: MEA Extended Release Drugs Market Value (US$ Mn) by Country, 2022-2032 Figure 112: MEA Extended Release Drugs Market Value (US$ Mn) Analysis by Country, 2017-2032 Figure 113: MEA Extended Release Drugs Market Volume (Tons) Analysis by Country, 2017-2032 Figure 114: MEA Extended Release Drugs Market Value Share (%) and BPS Analysis by Country, 2022-2032 Figure 115: MEA Extended Release Drugs Market Y-o-Y Growth (%) Projections by Country, 2022-2032 Figure 116: MEA Extended Release Drugs Market Value (US$ Mn) Analysis by Drug Release, 2017-2032 Figure 117: MEA Extended Release Drugs Market Volume (Tons) Analysis by Drug Release, 2017-2032 Figure 118: MEA Extended Release Drugs Market Value Share (%) and BPS Analysis by Drug Release, 2022-2032 Figure 119: MEA Extended Release Drugs Market Y-o-Y Growth (%) Projections by Drug Release, 2022-2032 Figure 120: MEA Extended Release Drugs Market Value (US$ Mn) Analysis by Distributional Channel, 2017-2032 Figure 121: MEA Extended Release Drugs Market Volume (Tons) Analysis by Distributional Channel, 2017-2032 Figure 122: MEA Extended Release Drugs Market Value Share (%) and BPS Analysis by Distributional Channel, 2022-2032 Figure 123: MEA Extended Release Drugs Market Y-o-Y Growth (%) Projections by Distributional Channel, 2022-2032 Figure 124: MEA Extended Release Drugs Market Attractiveness by Drug Release, 2022-2032 Figure 125: MEA Extended Release Drugs Market Attractiveness by Distributional Channel, 2022-2032 Figure 126: MEA Extended Release Drugs Market Attractiveness by Country, 2022-2032
Need specific information?
Request CustomizationExplore Healthcare Insights
View Reports