Reports

- Global Locations -

Headquarters

Future Market Insights, Inc.

Christiana Corporate, 200
Continental Drive, Suite 401,
Newark, Delaware - 19713,
United States

T: +1-845-579-5705

Americas

Future Market Insights, Inc.

616 Corporate Way, Suite 2-9018,
Valley Cottage, NY 10989, United States

T: +1-347-918-3531

MEA

Future Market Insights

1602-6 Jumeirah Bay X2 Tower, Plot No: JLT-PH2-X2A,
Jumeirah Lakes Towers, Dubai,
United Arab Emirates

Europe

Future Market Insights

3rd Floor, 207 Regent Street,
W1B 3HH London
United Kingdom

T: + 44 (0) 20 8123 9659
D: +44 (0) 20 3287 4268

Asia Pacific

Future Market Insights

IndiaLand Global Tech Park, Unit UG-1, Behind Grand HighStreet, Phase 1, Hinjawadi, MH, Pune – 411057, India

Extracorporeal CO2 Removal Devices Market Snapshot (2022 to 2032)

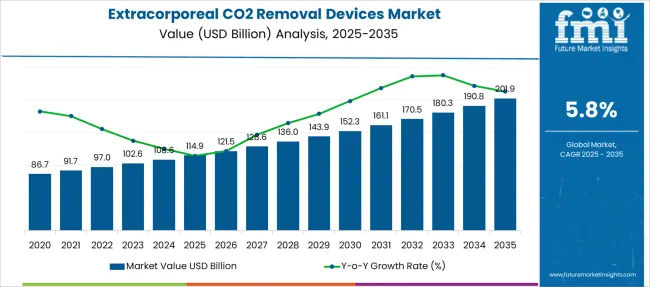
Newly-released Extracorporeal CO2 Removal Devices Market industry analysis report by Future Market Insights shows that global sales of the Extracorporeal CO2 Removal Devices Market in 2021 were held at US$ 91.6 million. With a CAGR of 5.8% from 2022 to 2032, the market is projected to reach a valuation of US$ 170.9 million by 2032. Extracorporeal CO2 Machines is expected to be the highest revenue-generating category, projected to grow at a CAGR of 6.2% from 2022 to 2032.

Attribute Details
Global Extracorporeal CO2 Removal Devices Market (2022) US$ 97 million
Global Extracorporeal CO2 Removal Devices Market (2032) US$ 170.9 million
Global Extracorporeal CO2 Removal Devices Market CAGR (2022 to 2032) 5.8%
The USA Extracorporeal CO2 Removal Devices Market CAGR (2022 to 2032) 6.1%
Key Companies Profiled
  • Medtronic
  • Getinge AB
  • Xenios AG
  • Alung Technologies
  • ESTOR S.P.A
  • Medica Spa
  • Aferectica Srl

Don't pay for what you don't need

Customize your report by selecting specific countries or regions and save 30%!

Revenue of Extracorporeal CO2 Removal Devices Market from 2017 to 2021 Compared to Demand Outlook for 2022 to 2032

As per the Extracorporeal CO2 Removal Devices Market industry research by Future Market Insights - a market research and competitive intelligence provider, historically, from 2017 to 2021, market value increased at around 5.6% CAGR, wherein, countries such as Germany, the USA, China, and Japan held a significant share in the global market.

The growing usage of advanced analytics in pharma and medical testing are the key factors influencing the adoption of Extracorporeal CO2 Removal Devices. Owing to this, the market is projected to grow at a CAGR of 5.8% over the coming 10 years.

Health systems and Extracorporeal CO2 Removal Devices enterprises to improve treatment, monetary, and sustainability frameworks while minimizing the costs of healthcare are rapidly adopting analytical solutions. Healthcare financing organizations and government bodies are implementing analytics through claim management and fraud prevention, which is fueling market growth.

The growing elderly population and their increased proclivity for various acute and chronic diseases are likely to drive the expansion of the worldwide extracorporeal carbon dioxide removal market. Furthermore, rising incidences of pulmonary obstructive illness are predicted to aid in the global market's expansion. On the contrary, the risk of infection, hypoxemia, or thrombosis produced by the restricted flow of blood via the circuit may result in severe health issues, posing a long-term challenge to market expansion.

What Clinical Potential benefits of ECCO2R Devices are Expected to Drive Global Market Growth?

According to the World Health Organization (WHO), around 251 million people worldwide suffer from a chronic pulmonary obstructive condition. The World Health Organization expected that the number of instances of pulmonary obstructive disease would rise due to an increase in smoking among the population, which would raise the global extracorporeal carbon dioxide removal (ECCO2R) device market sales in the coming years.

Furthermore, clinical benefits provided by ECCO2R removal devices, including effective gas exchange, vitalizing blood flow, and strong lung support, are expected to drive the worldwide ECCO2R devices market revenue during the forecast period.

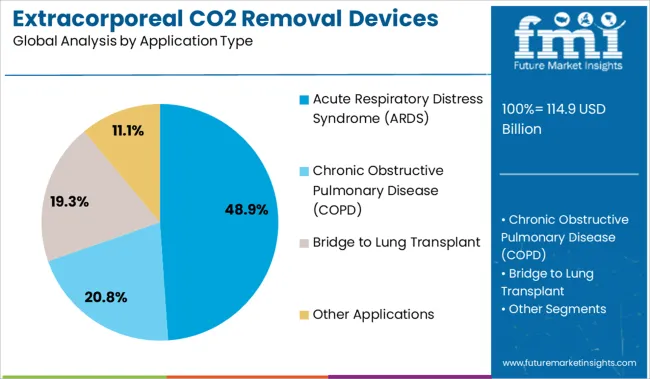
Extracorporeal CO2 removal devices are efficient, safe, and cost-effective. These technologies have been proposed for use in ventilation assistance in clinical settings where they may be effective, such as COPD exacerbation and acute respiratory distress syndrome (ARDS). The rising prevalence of COPD around the world is expected to fuel market expansion.

Extracorporeal CO2 removal devices are an effective therapy for individuals with hypercapnia respiratory failure and may assist clinicians and healthcare partners to improve lung-protective ventilation. These devices can remove enough CO2 to allow for a 50% reduction in alveolar minute ventilation, resulting in a significant reduction in PaCO2. As a result, the multiple benefits connected with these devices are likely to boost the overall market growth.

Sabyasachi Ghosh
Sabyasachi Ghosh

Principal Consultant

Talk to Analyst

Find your sweet spots for generating winning opportunities in this market.

Regional Analysis

Which Region is projected to offer the Largest Opportunity for the Extracorporeal CO2 Removal Devices Market?

North America is likely to continue to dominate the global extracorporeal CO2 removal market throughout the analysis period, owing to the early adoption of innovations and a large patient pool of COPD and ARDS patients. The increased popularity of novel clinical innovations is attributable to the expansion of the regional market. The spread of chronic respiratory illnesses and the flood of demand for quick and safe minimally intrusive ventilation procedures have accelerated the development of the extracorporeal CO2 removal industry in North America.
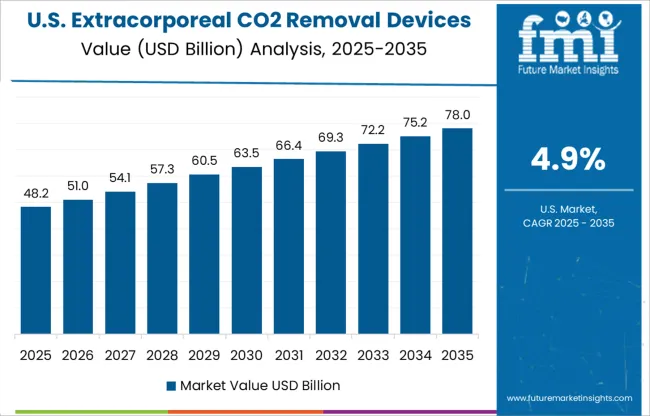
Country-wise Analysis

The USA Market Analysis

The United States has been a pioneer in the Extracorporeal CO2 Removal Devices Market. In recent years, the utilization of Extracorporeal CO2 Removal Devices in the USA expanded due to a growing emphasis on the removal of carbon dioxide in the healthcare sector. The increase in the number of specialized clinics in the United States has also provided new opportunities for market participants.

United Kingdom Market Analysis

The market in the United Kingdom is expected to reach a valuation of US$ 62 million by 2032. Growing at a CAGR of 6.1% from 2022 to 2032, the market in the country is expected to gross an absolute dollar opportunity of US$ 27.5 million.

Japan Market Analysis

In Japan, the market is projected to garner an absolute dollar opportunity of US$ 3.3 million with a CAGR of 7.1% during the forecast period. The market in the country is expected to reach a valuation of US$ 6.7 million by 2032.

South Korea Market Analysis

The market in South Korea is expected to reach a valuation of US$ 4.5 million, growing at a CAGR of 5.7% from 2022 to 2032. The market in the country is expected to witness an absolute dollar opportunity of US$ 1.9 million during the forecast period.

Get the data you need at a Fraction of the cost

Personalize your report by choosing insights you need
and save 40%!

Category-wise Insights

Why Extracorporeal CO2 Machines Account for Highest Share in the Market?

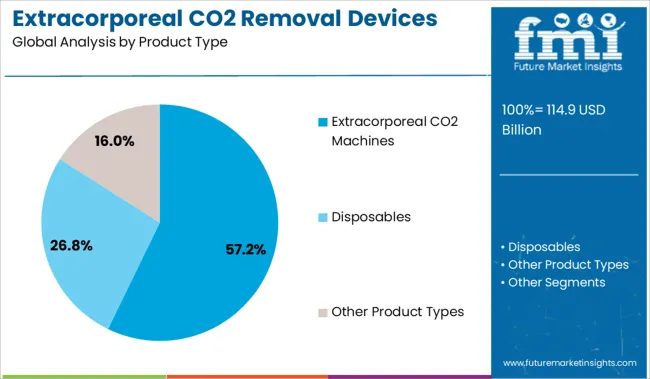
Extracorporeal CO2 machines accounted for over half of the total extracorporeal CO2 removal devices demand. The market for Extracorporeal CO2 Machines is expected to grow at a CAGR of 6.2%. Advancements in technical simplification have allowed the usage of additional corporeal CO2 removal equipment to accelerate dramatically, reducing some of the primary difficulties connected to ECMO. Extracorporeal carbon dioxide removal equipment is theoretically simpler and has comparatively fewer staff needs along with logistical requirements,[mg] as patients may prefer them over ECMO.
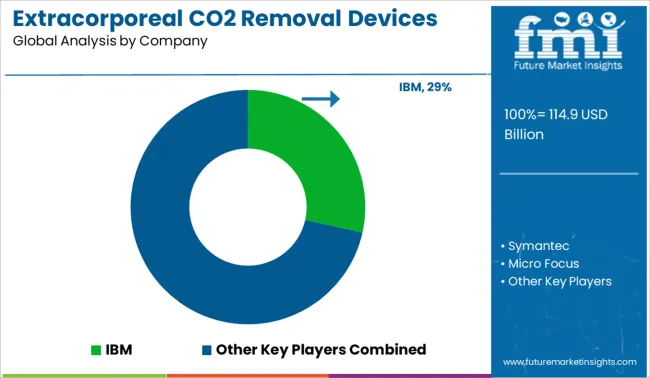
Competitive Analysis

The leading players in the extracorporeal CO2 removal system market have used various methods to boost growth potential in the coming years. Collaborations, alliances, mergers, product approvals, and novel product launches are some of the primary methods used by leading companies to create growth avenues in the market.

Some of the key players operating in the market include Medtronic, Getinge AB, Xenios AG, ALung Technologies, ESTOR S.P.A., Medica Spa, and Aferectica Srl.

Some of the recent developments in the key Extracorporeal CO2 Removal Devices Market are as follows:

  • In December 2018, ALung Technologies made considerable progress in clinical trial programs for the Hemolung Respiratory Assist System (RAS), a catheter that plays an important part in the extracorporeal Co2 removal process.
  • In September 2017, Hemolung Respiratory Assist Device (RAS) received IDE (Investigational Device Exemption) approval to conduct VENT-AVOID trials of the system.

Similarly, recent developments related to companies offering Extracorporeal CO2 Removal Devices Market have been tracked by the team at Future Market Insights, which are available in the full report.

Market Segments Covered in Extracorporeal CO2 Removal Devices Market Analysis

By Product Type:

  • Extracorporeal CO2 Machines
  • Disposables
  • Other Product Types

By Application Type:

  • Acute Respiratory Distress Syndrome (ARDS)
  • Chronic Obstructive Pulmonary Disease (COPD)
  • Bridge to Lung Transplant
  • Other Applications

By Sample Type:

  • Venovenous
  • Arteriovenous

By Region:

  • North America
  • Europe
  • Latin America
  • Asia Pacific
  • Middle East and Africa (MEA)

Frequently Asked Questions

What is the current worth of the Extracorporeal CO2 Removal Devices Market?

The global market is worth more than US$ 91.6 million at present.

What is the global Extracorporeal CO2 Removal Devices Markets market growth?

The market is expected to witness a CAGR of 5.8% from 2022 to 2032.

Which Region accounted for the largest Extracorporeal CO2 Removal Devices Market?

North America dominated the Extracorporeal CO2 Removal Devices Market. This is attributable to increased spending on procedures and the easy availability of the products.

What is driving revenue for Extracorporeal CO2 Removal Devices Market?

The market revenue is being driven primarily by the growing healthcare industry, which has consequently accelerated manufacturing

Which are the top 5 countries driving demand for Extracorporeal CO2 Removal Devices Market?

The top 5 countries driving demand for Extracorporeal CO2 Removal Devices Market are the USA, China, Japan, India, the United Kingdom, and South Korea.

Who are the leading industry participants in the global Extracorporeal CO2 Removal Devices Market?

Alung Technologies, Inc., Xenios AG, ESTOR S.P.A, Medtronic Plc., Medica S.P.A., and Getinge Group are among the key players operating in the market.

Table of Content

1. Executive Summary

    1.1. Global Market Outlook

    1.2. Summary of Statistics

    1.3. Key Market Characteristics & Attributes

    1.4. Future Market Insights Analysis and Recommendations

2. Market Overview

    2.1. Market Coverage / Taxonomy

    2.2. Market Definition / Scope / Limitations

3. Market Risks and Trends Assessment

    3.1. Risk Assessment

        3.1.1. COVID-19 Crisis and Impact on Extracorporeal CO2 Removal Devices

        3.1.2. COVID-19 Impact Benchmark with Previous Crisis

        3.1.3. Impact on Market Value (US$ million)

        3.1.4. Assessment by Key Countries

        3.1.5. Assessment by Key Market Segments

        3.1.6. Action Points and Recommendation for Suppliers

    3.2. Key Trends Impacting the Market

    3.3. Formulation and Product Development Trends

4. Market Background

    4.1. Market, by Key Countries

    4.2. Market Opportunity Assessment (US$ million)

        4.2.1. Total Available Market

        4.2.2. Serviceable Addressable Market

        4.2.3. Serviceable Obtainable Market

    4.3. Market Scenario Forecast

        4.3.1. Demand in optimistic Scenario

        4.3.2. Demand in Likely Scenario

        4.3.3. Demand in Conservative Scenario

    4.4. Investment Feasibility Analysis

        4.4.1. Investment in Established Markets

            4.4.1.1. In Short Term

            4.4.1.2. In Long Term

        4.4.2. Investment in Emerging Markets

            4.4.2.1. In Short Term

            4.4.2.2. In Long Term

    4.5. Forecast Factors - Relevance & Impact

        4.5.1. Top Companies Historical Growth

        4.5.2. Growth in Automation, By Country

        4.5.3. Patch Management Adoption Rate, By Country

    4.6. Market Dynamics

        4.6.1. Market Driving Factors and Impact Assessment

        4.6.2. Prominent Market Challenges and Impact Assessment

        4.6.3. Patch Management Market Opportunities

        4.6.4. Prominent Trends in the Global Market & Their Impact Assessment

5. Key Success Factors

    5.1. Manufacturers’ Focus on Low Penetration High Growth Markets

    5.2. Banking on with Segments High Incremental Opportunity

    5.3. Peer Benchmarking

6. Global Market Demand Analysis 2015 to 2021 and Forecast, 2022 to 2032

    6.1. Historical Market Analysis, 2015 to 2021

    6.2. Current and Future Market Projections, 2022 to 2032

    6.3. Y-o-Y Growth Trend Analysis

7. Global Market Value Analysis 2015 to 2021 and Forecast, 2022 to 2032

    7.1. Historical Market Value (US$ million) Analysis, 2015 to 2021

    7.2. Current and Future Market Value (US$ million) Projections, 2022 to 2032

        7.2.1. Y-o-Y Growth Trend Analysis

        7.2.2. Absolute $ Opportunity Analysis

8. Global Market Analysis 2015 to 2021 and Forecast 2022 to 2032, By Product type

    8.1. Introduction / Key Findings

    8.2. Historical Market Size (US$ million) Analysis By Product type, 2015 to 2021

    8.3. Current and Future Market Size (US$ million) Analysis and Forecast By Product type, 2022 to 2032

        8.3.1. Extracorporeal CO2 Machines

        8.3.2. Disposables

        8.3.3. Other Product Types

    8.4. Market Attractiveness Analysis By Product type

9. Global Market Analysis 2015 to 2021 and Forecast 2022 to 2032, By Application

    9.1. Introduction / Key Findings

    9.2. Historical Market Size (US$ million) Analysis By Application, 2015 to 2021

    9.3. Current and Future Market Size (US$ million) Analysis and Forecast By Application, 2022 to 2032

        9.3.1. Acute Respiratory Distress Syndrome (ARDS)

        9.3.2. Chronic Obstructive Pulmonary Disease (COPD)

        9.3.3. Bridge to Lung Transplant

        9.3.4. Other Applications

    9.4. Market Attractiveness Analysis By Application

10. Global Market Analysis 2015 to 2021 and Forecast 2022 to 2032, By Sample type

    10.1. Introduction / Key Findings

    10.2. Historical Market Size (US$ million) Analysis By Application, 2015 to 2021

    10.3. Current and Future Market Size (US$ million) Analysis and Forecast By Application, 2022 to 2032

        10.3.1. Venovenous

        10.3.2. Arteriovenous

    10.4. Market Attractiveness Analysis By Application

11. Global Market Analysis 2015 to 2021 and Forecast 2022 to 2032, By Region

    11.1. Introduction

    11.2. Historical Market Size (US$ million) Analysis By Region, 2015 to 2021

    11.3. Current Market Size (US$ million) & Analysis and Forecast By Region, 2022 to 2032

        11.3.1. North America

        11.3.2. Latin America

        11.3.3. Europe

        11.3.4. Asia Pacific

        11.3.5. Middle East and Africa (MEA)

    11.4. Market Attractiveness Analysis By Region

12. North America Market Analysis 2015 to 2021 and Forecast 2022 to 2032

    12.1. Introduction

    12.2. Pricing Analysis

    12.3. Historical Market Size (US$ million) Trend Analysis By Market Taxonomy, 2015 to 2021

    12.4. Market Size (US$ million) & Forecast By Market Taxonomy, 2022 to 2032

        12.4.1. By Country

            12.4.1.1. The USA

            12.4.1.2. Canada

            12.4.1.3. Rest of North America

        12.4.2. By Product type

        12.4.3. By Application

        12.4.4. By Sample type

    12.5. Market Attractiveness Analysis

        12.5.1. By Country

        12.5.2. By Product type

        12.5.3. By Application

        12.5.4. By Sample type

13. Latin America Market Analysis 2015 to 2021 and Forecast 2022 to 2032

    13.1. Introduction

    13.2. Pricing Analysis

    13.3. Historical Market Size (US$ million) Trend Analysis By Market Taxonomy, 2015 to 2021

    13.4. Market Size (US$ million) & Forecast By Market Taxonomy, 2022 to 2032

        13.4.1. By Country

            13.4.1.1. Brazil

            13.4.1.2. Mexico

            13.4.1.3. Rest of Latin America

        13.4.2. By Product type

        13.4.3. By Application

        13.4.4. By Sample type

    13.5. Market Attractiveness Analysis

        13.5.1. By Country

        13.5.2. By Product type

        13.5.3. By Application

        13.5.4. By Sample type

14. Europe Market Analysis 2015 to 2021 and Forecast 2022 to 2032

    14.1. Introduction

    14.2. Pricing Analysis

    14.3. Historical Market Size (US$ million) Trend Analysis By Market Taxonomy, 2015 to 2021

    14.4. Market Size (US$ million) & Forecast By Market Taxonomy, 2022 to 2032

        14.4.1. By Country

            14.4.1.1. Germany

            14.4.1.2. France

            14.4.1.3. The United Kingdom

            14.4.1.4. Italy

            14.4.1.5. Benelux

            14.4.1.6. Nordic Countries

            14.4.1.7. Rest of Europe

        14.4.2. By Product type

        14.4.3. By Application

        14.4.4. By Sample type

    14.5. Market Attractiveness Analysis

        14.5.1. By Country

        14.5.2. By Product type

        14.5.3. By Application

        14.5.4. By Sample type

15. Asia Pacific Market Analysis 2015 to 2021 and Forecast 2022 to 2032

    15.1. Introduction

    15.2. Pricing Analysis

    15.3. Historical Market Size (US$ million) Trend Analysis By Market Taxonomy, 2015 to 2021

    15.4. Market Size (US$ million) & Forecast By Market Taxonomy, 2022 to 2032

        15.4.1. By Country

            15.4.1.1. China

            15.4.1.2. Japan

            15.4.1.3. South Korea

            15.4.1.4. Rest of Asia Pacific

        15.4.2. By Product type

        15.4.3. By Application

        15.4.4. By By Sample type

    15.5. Market Attractiveness Analysis

        15.5.1. By Country

        15.5.2. By Product type

        15.5.3. By Application

        15.5.4. By Sample type

16. Middle East and Africa Market Analysis 2015 to 2021 and Forecast 2022 to 2032

    16.1. Introduction

    16.2. Pricing Analysis

    16.3. Historical Market Size (US$ million) Trend Analysis By Market Taxonomy, 2015 to 2021

    16.4. Market Size (US$ million) & Forecast By Market Taxonomy, 2022 to 2032

        16.4.1. By Country

            16.4.1.1. GCC Countries

            16.4.1.2. South Africa

            16.4.1.3. Turkey

            16.4.1.4. Rest of Middle East and Africa

        16.4.2. By Product type

        16.4.3. By Application

        16.4.4. By Sample type

    16.5. Market Attractiveness Analysis

        16.5.1. By Country

        16.5.2. By Product type

        16.5.3. By Application

        16.5.4. By Sample type

17. Key Countries Market Analysis 2015 to 2021 and Forecast 2022 to 2032

    17.1. Introduction

        17.1.1. Market Value Proportion Analysis, By Key Countries

        17.1.2. Global Vs. Country Growth Comparison

    17.2. US Market Analysis

        17.2.1. Value Proportion Analysis by Market Taxonomy

        17.2.2. Value & Analysis and Forecast by Market Taxonomy, 2015 to 2032

            17.2.2.1. By Product type

            17.2.2.2. By Application

            17.2.2.3. By Sample type

    17.3. Canada Market Analysis

        17.3.1. Value Proportion Analysis by Market Taxonomy

        17.3.2. Value & Analysis and Forecast by Market Taxonomy, 2015 to 2032

            17.3.2.1. By Product type

            17.3.2.2. By Application

            17.3.2.3. By Sample type

    17.4. Mexico Market Analysis

        17.4.1. Value Proportion Analysis by Market Taxonomy

        17.4.2. Value & Analysis and Forecast by Market Taxonomy, 2015 to 2032

            17.4.2.1. By Product type

            17.4.2.2. By Application

            17.4.2.3. By Sample type

    17.5. Brazil Market Analysis

        17.5.1. Value Proportion Analysis by Market Taxonomy

        17.5.2. Value & Analysis and Forecast by Market Taxonomy, 2015 to 2032

            17.5.2.1. By Product type

            17.5.2.2. By Application

            17.5.2.3. By Sample type

    17.6. Germany Market Analysis

        17.6.1. Value Proportion Analysis by Market Taxonomy

        17.6.2. Value & Analysis and Forecast by Market Taxonomy, 2015 to 2032

            17.6.2.1. By Product type

            17.6.2.2. By Application

            17.6.2.3. By Sample type

    17.7. France Market Analysis

        17.7.1. Value Proportion Analysis by Market Taxonomy

        17.7.2. Value & Analysis and Forecast by Market Taxonomy, 2015 to 2032

            17.7.2.1. By Product type

            17.7.2.2. By Application

            17.7.2.3. By Sample type

    17.8. Italy Market Analysis

        17.8.1. Value Proportion Analysis by Market Taxonomy

        17.8.2. Value & Analysis and Forecast by Market Taxonomy, 2015 to 2032

            17.8.2.1. By Product type

            17.8.2.2. By Application

            17.8.2.3. By Sample type

    17.9. BENELUX Market Analysis

        17.9.1. Value Proportion Analysis by Market Taxonomy

        17.9.2. Value & Analysis and Forecast by Market Taxonomy, 2015 to 2032

            17.9.2.1. By Product type

            17.9.2.2. By Application

            17.9.2.3. By Sample type

    17.10. The United Kingdom Market Analysis

        17.10.1. Value Proportion Analysis by Market Taxonomy

        17.10.2. Value & Analysis and Forecast by Market Taxonomy, 2015 to 2032

            17.10.2.1. By Product type

            17.10.2.2. By Application

            17.10.2.3. By Sample type

    17.11. Nordic Countries Market Analysis

        17.11.1. Value Proportion Analysis by Market Taxonomy

        17.11.2. Value & Analysis and Forecast by Market Taxonomy, 2015 to 2032

            17.11.2.1. By Product type

            17.11.2.2. By Application

            17.11.2.3. By Sample type

    17.12. China Market Analysis

        17.12.1. Value Proportion Analysis by Market Taxonomy

        17.12.2. Value & Analysis and Forecast by Market Taxonomy, 2015 to 2032

            17.12.2.1. By Product type

            17.12.2.2. By Application

            17.12.2.3. By Sample type

    17.13. Japan Market Analysis

        17.13.1. Value Proportion Analysis by Market Taxonomy

        17.13.2. Value & Analysis and Forecast by Market Taxonomy, 2015 to 2032

            17.13.2.1. By Product type

            17.13.2.2. By Application

            17.13.2.3. By Sample type

    17.14. South Korea Market Analysis

        17.14.1. Value Proportion Analysis by Market Taxonomy

        17.14.2. Value & Analysis and Forecast by Market Taxonomy, 2015 to 2032

            17.14.2.1. By Product type

            17.14.2.2. By Application

            17.14.2.3. By Sample type

    17.15. GCC Countries Market Analysis

        17.15.1. Value Proportion Analysis by Market Taxonomy

        17.15.2. Value & Analysis and Forecast by Market Taxonomy, 2015 to 2032

            17.15.2.1. By Product type

            17.15.2.2. By Application

            17.15.2.3. By Sample type

    17.16. South Africa Market Analysis

        17.16.1. Value Proportion Analysis by Market Taxonomy

        17.16.2. Value & Analysis and Forecast by Market Taxonomy, 2015 to 2032

            17.16.2.1. By Product type

            17.16.2.2. By Application

            17.16.2.3. By Sample type

    17.17. Turkey Market Analysis

        17.17.1. Value Proportion Analysis by Market Taxonomy

        17.17.2. Value & Analysis and Forecast by Market Taxonomy, 2015 to 2032

            17.17.2.1. By Product type

            17.17.2.2. By Application

            17.17.2.3. By Application

        17.17.3. Competition Landscape and Player Concentration in the Country

18. Market Structure Analysis

    18.1. Market Analysis by Tier of Companies

    18.2. Market Concentration

    18.3. Market Share Analysis of Top Players

    18.4. Market Presence Analysis

        18.4.1. By Regional footprint of Players

        18.4.2. Product footprint by Players

19. Competition Analysis

    19.1. Competition Dashboard

    19.2. Competition Benchmarking

    19.3. Competition Deep Dive

        19.3.1. IBM

            19.3.1.1. Overview

            19.3.1.2. Product Portfolio

            19.3.1.3. Sales Footprint

            19.3.1.4. Strategy Overview

        19.3.2. SYMANTEC

            19.3.2.1. Overview

            19.3.2.2. Product Portfolio

            19.3.2.3. Sales Footprint

            19.3.2.4. Strategy Overview

        19.3.3. MICRO FOCUS

            19.3.3.1. Overview

            19.3.3.2. Product Portfolio

            19.3.3.3. Sales Footprint

            19.3.3.4. Strategy Overview

        19.3.4. QUALYS

            19.3.4.1. Overview

            19.3.4.2. Product Portfolio

            19.3.4.3. Sales Footprint

            19.3.4.4. Strategy Overview

        19.3.5. SOLARWINDS

            19.3.5.1. Overview

            19.3.5.2. Product Portfolio

            19.3.5.3. Sales Footprint

            19.3.5.4. Strategy Overview

        19.3.6. IVANTI

            19.3.6.1. Overview

            19.3.6.2. Product Portfolio

            19.3.6.3. Sales Footprint

            19.3.6.4. Strategy Overview

        19.3.7. MANAGEENGINE

            19.3.7.1. Overview

            19.3.7.2. Product Portfolio

            19.3.7.3. Sales Footprint

            19.3.7.4. Strategy Overview

        19.3.8. CONNECTWISE

            19.3.8.1. Overview

            19.3.8.2. Product Portfolio

            19.3.8.3. Sales Footprint

            19.3.8.4. Strategy Overview

        19.3.9. AVAST

            19.3.9.1. Overview

            19.3.9.2. Product Portfolio

            19.3.9.3. Sales Footprint

            19.3.9.4. Strategy Overview

        19.3.10. AUTOMOX

            19.3.10.1. Overview

            19.3.10.2. Product Portfolio

            19.3.10.3. Sales Footprint

            19.3.10.4. Strategy Overview

20. Assumptions and Acronyms Used

21. Research Methodology

Don't pay for what you don't need

Customize your report by selecting specific countries or regions and save 30%!

List of Tables

Table 1: Global Market Value (US$ million), By Product Type, 2015 to 2021

Table 2: Global Market Value (US$ million), By Product Type, 2022 to 2032

Table 3: Global Market Value (US$ million), By Application, 2015 to 2021

Table 4: Global Market Value (US$ million), By Application, 2022 to 2032

Table 5: Global Market Value (US$ million), By Application, 2015 to 2021

Table 6: Global Market Value (US$ million), By Application, 2022 to 2032

Table 7: Global Market, By Region, 2015 to 2021

Table 8: Global Market, By Region, 2022 to 2032

Table 9: North America Market Value (US$ million), By Product Type, 2015 to 2021

Table 10: North America Market Value (US$ million), By Product Type, 2022 to 2032

Table 11: North America Market Value (US$ million), By Application, 2015 to 2021

Table 12: North America Market Value (US$ million), By Application, 2022 to 2032

Table 13: North America Market Value (US$ million), By Application, 2015 to 2021

Table 14: North America Market Value (US$ million), By Application, 2022 to 2032

Table 15: North America Market, By Country, 2015 to 2021

Table 16: North America Market, By Country, 2022 to 2032

Table 17: Latin America Market Value (US$ million), By Product Type, 2015 to 2021

Table 18: Latin America Market Value (US$ million), By Product Type, 2022 to 2032

Table 19: Latin America Market Value (US$ million), By Application, 2015 to 2021

Table 20: Latin America Market Value (US$ million), By Application, 2022 to 2032

Table 21: Latin America Market Value (US$ million), By Application, 2015 to 2021

Table 22: Latin America Market Value (US$ million), By Application, 2022 to 2032

Table 23: Latin America Market, By Country, 2015 to 2021

Table 24: Latin America Market, By Country, 2022 to 2032

Table 25: Europe Market Value (US$ million), By Product Type, 2015 to 2021

Table 26: Europe Market Value (US$ million), By Product Type, 2022 to 2032

Table 27: Europe Market Value (US$ million), By Application, 2015 to 2021

Table 28: Europe Market Value (US$ million), By Application, 2022 to 2032

Table 29: Europe Market Value (US$ million), By Application, 2015 to 2021

Table 30: Europe Market Value (US$ million), By Application, 2022 to 2032

Table 31: Europe Market, By Country, 2015 to 2021

Table 32: Europe Market, By Country, 2022 to 2032

Table 33: Asia Pacific Market Value (US$ million), By Product Type, 2015 to 2021

Table 34: Asia Pacific Market Value (US$ million), By Product Type, 2022 to 2032

Table 35: Asia Pacific Market Value (US$ million), By Application, 2015 to 2021

Table 36: Asia Pacific Market Value (US$ million), By Application, 2022 to 2032

Table 37: Asia Pacific Market Value (US$ million), By Application, 2015 to 2021

Table 38: Asia Pacific Market Value (US$ million), By Application, 2022 to 2032

Table 39: Asia Pacific Market, By Country, 2015 to 2021

Table 40: Asia Pacific Market, By Country, 2022 to 2032

Table 41: MEA Market Value (US$ million), By Product Type, 2015 to 2021

Table 42: MEA Market Value (US$ million), By Product Type, 2022 to 2032

Table 43: MEA Market Value (US$ million), By Application, 2015 to 2021

Table 44: MEA Market Value (US$ million), By Application, 2022 to 2032

Table 45: MEA Market Value (US$ million), By Application, 2015 to 2021

Table 46: MEA Market Value (US$ million), By Application, 2022 to 2032

Table 47: MEA Market, By Country, 2015 to 2021

Table 48: MEA Market, By Country, 2022 to 2032

Table 49: Global Market Incremental $ Opportunity, By Product Type, 2015 to 2021

Table 50: Global Market Incremental $ Opportunity, By Application, 2022 to 2032

Table 51: Global Market Incremental $ Opportunity, By Application, 2015 to 2021

Table 52: Global Market Incremental $ Opportunity, By Region, 2022 to 2032

Table 53: North America Market Incremental $ Opportunity, By Product Type, 2015 to 2021

Table 54: North America Market Incremental $ Opportunity, By Application, 2022 to 2032

Table 55: North America Market Incremental $ Opportunity, By Application, 2015 to 2021

Table 56: North America Market Incremental $ Opportunity, By Country, 2022 to 2032

Table 57: Latin America Market Incremental $ Opportunity, By Product Type, 2015 to 2021

Table 58: Latin America Market Incremental $ Opportunity, By Application, 2022 to 2032

Table 59: Latin America Market Incremental $ Opportunity, By Application, 2015 to 2021

Table 60: Latin America Market Incremental $ Opportunity, By Country, 2022 to 2032

Table 61: Europe Market Incremental $ Opportunity, By Product Type, 2015 to 2021

Table 62: Europe Market Incremental $ Opportunity, By Application, 2022 to 2032

Table 63: Europe Market Incremental $ Opportunity, By Application, 2015 to 2021

Table 64: Europe Market Incremental $ Opportunity, By Country, 2022 to 2032

Table 65: Asia Pacific Market Incremental $ Opportunity, By Product Type, 2015 to 2021

Table 66: Asia Pacific Market Incremental $ Opportunity, By Application, 2022 to 2032

Table 67: Asia Pacific Market Incremental $ Opportunity, By Application, 2015 to 2021

Table 68: Asia Pacific Market Incremental $ Opportunity, By Country, 2022 to 2032

Table 69: MEA Market Incremental $ Opportunity, By Product Type, 2015 to 2021

Table 70: MEA Market Incremental $ Opportunity, By Application, 2022 to 2032

Table 71: MEA Market Incremental $ Opportunity, By Application, 2015 to 2021

Table 72: MEA Market Incremental $ Opportunity, By Country, 2022 to 2032
Sabyasachi Ghosh
Sabyasachi Ghosh

Principal Consultant

Talk to Analyst

Find your sweet spots for generating winning opportunities in this market.

List of Charts

Figure 1: Global Market Value (US$ million) and Year-on-Year Growth, 2015 to 2032

Figure 2: Global Market Absolute $ Historical Gain (2015 to 2021) and Opportunity (2022 to 2032), US$ million

Figure 3: Global Market Share, By Product Type, 2022 to 2032

Figure 4: Global Market Y-o-Y Growth Projections, By Product Type - 2022 to 2032

Figure 5: Global Market Attractiveness Index, By Product Type - 2022 to 2032

Figure 6: Global Market Share, By Application, 2022 to 2032

Figure 7: Global Market Y-o-Y Growth Projections, By Application- 2022 to 2032

Figure 8: Global Market Attractiveness Index, By Application- 2022 to 2032

Figure 9: Global Market Share, By Application, 2022 to 2032

Figure 10: Global Market Y-o-Y Growth Projections, By Application - 2022 to 2032

Figure 11: Global Market Attractiveness Index, By Application - 2022 to 2032

Figure 12: Global Market Share, By Region, 2022 to 2032

Figure 13: Global Market Y-o-Y Growth Projections, By Region - 2022 to 2032

Figure 14: Global Market Attractiveness Index, By Region - 2022 to 2032

Figure 15: North America Market Value (US$ million) and Year-on-Year Growth, 2015 to 2032

Figure 16: North America Market Absolute $ Opportunity Historical (2015 to 2021) and Forecast Period (2022 to 2032), US$ million

Figure 17: North America Market Share, By Product Type, 2022 to 2032

Figure 18: North America Market Y-o-Y Growth Projections, By Product Type - 2022 to 2032

Figure 19: North America Market Attractiveness Index, By Product Type - 2022 to 2032

Figure 20: North America Market Share, By Application, 2022 to 2032

Figure 21: North America Market Y-o-Y Growth Projections, By Application- 2022 to 2032

Figure 22: North America Market Attractiveness Index, By Application- 2022 to 2032

Figure 23: North America Market Share, By Application, 2022 to 2032

Figure 24: North America Market Y-o-Y Growth Projections, By Application - 2022 to 2032

Figure 25: North America Market Attractiveness Index, By Application - 2022 to 2032

Figure 26: North America Market Share, By Country, 2022 to 2032

Figure 27: North America Market Y-o-Y Growth Projections, By Country - 2022 to 2032

Figure 28: North America Market Attractiveness Index, By Country - 2022 to 2032

Figure 29: Latin America Market Value (US$ million) and Year-on-Year Growth, 2015 to 2032

Figure 30: Latin America Market Absolute $ Opportunity Historical (2015 to 2021) and Forecast Period (2022 to 2032), US$ million

Figure 31: Latin America Market Share, By Product Type, 2022 to 2032

Figure 32: Latin America Market Y-o-Y Growth Projections, By Product Type - 2022 to 2032

Figure 33: Latin America Market Attractiveness Index, By Product Type - 2022 to 2032

Figure 34: Latin America Market Share, By Application, 2022 to 2032

Figure 35: Latin America Market Y-o-Y Growth Projections, By Application- 2022 to 2032

Figure 36: Latin America Market Attractiveness Index, By Application- 2022 to 2032

Figure 37: Latin America Market Share, By Application, 2022 to 2032

Figure 38: Latin America Market Y-o-Y Growth Projections, By Application - 2022 to 2032

Figure 39: Latin America Market Attractiveness Index, By Application - 2022 to 2032

Figure 40: Latin America Market Share, By Country, 2022 to 2032

Figure 41: Latin America Market Y-o-Y Growth Projections, By Country - 2022 to 2032

Figure 42: Latin America Market Attractiveness Index, By Country - 2022 to 2032

Figure 43: Europe Market Value (US$ million) and Year-on-Year Growth, 2015 to 2032

Figure 44: Europe Market Absolute $ Opportunity Historical (2015 to 2021) and Forecast Period (2022 to 2032), US$ million

Figure 45: Europe Market Share, By Product Type, 2022 to 2032

Figure 46: Europe Market Y-o-Y Growth Projections, By Product Type - 2022 to 2032

Figure 47: Europe Market Attractiveness Index, By Product Type - 2022 to 2032

Figure 48: Europe Market Share, By Application, 2022 to 2032

Figure 49: Europe Market Y-o-Y Growth Projections, By Application- 2022 to 2032

Figure 50: Europe Market Attractiveness Index, By Application- 2022 to 2032

Figure 51: Europe Market Share, By Application, 2022 to 2032

Figure 52: Europe Market Y-o-Y Growth Projections, By Application - 2022 to 2032

Figure 53: Europe Market Attractiveness Index, By Application - 2022 to 2032

Figure 54: Europe Market Share, By Country, 2022 to 2032

Figure 55: Europe Market Y-o-Y Growth Projections, By Country - 2022 to 2032

Figure 56: Europe Market Attractiveness Index, By Country - 2022 to 2032

Figure 57: MEA Market Value (US$ million) and Year-on-Year Growth, 2015 to 2032

Figure 58: MEA Market Absolute $ Opportunity Historical (2015 to 2021) and Forecast Period (2022 to 2032), US$ million

Figure 59: MEA Market Share, By Product Type, 2022 to 2032

Figure 60: MEA Market Y-o-Y Growth Projections, By Product Type - 2022 to 2032

Figure 61: MEA Market Attractiveness Index, By Product Type - 2022 to 2032

Figure 62: MEA Market Share, By Application, 2022 to 2032

Figure 63: MEA Market Y-o-Y Growth Projections, By Application- 2022 to 2032

Figure 64: MEA Market Attractiveness Index, By Application- 2022 to 2032

Figure 65: MEA Market Share, By Application, 2022 to 2032

Figure 66: MEA Market Y-o-Y Growth Projections, By Application - 2022 to 2032

Figure 67: MEA Market Attractiveness Index, By Application - 2022 to 2032

Figure 68: MEA Market Share, By Country, 2022 to 2032

Figure 69: MEA Market Y-o-Y Growth Projections, By Country - 2022 to 2032

Figure 70: MEA Market Attractiveness Index, By Country - 2022 to 2032

Figure 71: Asia Pacific Market Value (US$ million) and Year-on-Year Growth, 2015 to 2032

Figure 72: Asia Pacific Market Absolute $ Opportunity Historical (2015 to 2021) and Forecast Period (2022 to 2032), US$ million

Figure 73: Asia Pacific Market Share, By Product Type, 2022 to 2032

Figure 74: Asia Pacific Market Y-o-Y Growth Projections, By Product Type - 2022 to 2032

Figure 75: Asia Pacific Market Attractiveness Index, By Product Type - 2022 to 2032

Figure 76: Asia Pacific Market Share, By Application, 2022 to 2032

Figure 77: Asia Pacific Market Y-o-Y Growth Projections, By Application- 2022 to 2032

Figure 78: Asia Pacific Market Attractiveness Index, By Application- 2022 to 2032

Figure 79: Asia Pacific Market Share, By Application, 2022 to 2032

Figure 80: Asia Pacific Market Y-o-Y Growth Projections, By Application - 2022 to 2032

Figure 81: Asia Pacific Market Attractiveness Index, By Application - 2022 to 2032

Figure 82: Asia Pacific Market Share, By Country, 2022 to 2032

Figure 83: Asia Pacific Market Y-o-Y Growth Projections, By Country - 2022 to 2032

Figure 84: Asia Pacific Market Attractiveness Index, By Country - 2022 to 2032

Figure 85: USA Market Value (US$ million) and Forecast, 2022 to 2032

Figure 86: USA Market Share, By Product Type, 2021

Figure 87: USA Market Share, By Application, 2021

Figure 88: USA Market Share, By Application, 2021

Figure 89: Canada Market Value (US$ million) and Forecast, 2022 to 2032

Figure 90: Canada Market Share, By Product Type, 2021

Figure 91: Canada Market Share, By Application, 2021

Figure 92: Canada Market Share, By Application, 2021

Figure 93: Brazil Market Value (US$ million) and Forecast, 2022 to 2032

Figure 94: Brazil Market Share, By Product Type, 2021

Figure 95: Brazil Market Share, By Application, 2021

Figure 96: Brazil Market Share, By Application, 2021

Figure 97: Mexico Market Value (US$ million) and Forecast, 2022 to 2032

Figure 98: Mexico Market Share, By Product Type, 2021

Figure 99: Mexico Market Share, By Application, 2021

Figure 100: Mexico Market Share, By Application, 2021

Figure 101: Germany Market Value (US$ million) and Forecast, 2022 to 2032

Figure 102: Germany Market Share, By Product Type, 2021

Figure 103: Germany Market Share, By Application, 2021

Figure 104: Germany Market Share, By Application, 2021

Figure 105: The United Kingdom Market Value (US$ million) and Forecast, 2022 to 2032

Figure 106: The United Kingdom Market Share, By Product Type, 2021

Figure 107: The United Kingdom Market Share, By Application, 2021

Figure 108: The United Kingdom Market Share, By Application, 2021

Figure 109: France Market Value (US$ million) and Forecast, 2022 to 2032

Figure 110: France Market Share, By Product Type, 2021

Figure 111: France Market Share, By Application, 2021

Figure 112: France Market Share, By Application, 2021

Figure 113: Italy Market Value (US$ million) and Forecast, 2022 to 2032

Figure 114: Italy Market Share, By Product Type, 2021

Figure 115: Italy Market Share, By Application, 2021

Figure 116: Italy Market Share, By Application, 2021

Figure 117: BENELUX Market Value (US$ million) and Forecast, 2022 to 2032

Figure 118: BENELUX Market Share, By Application, 2021

Figure 119: BENELUX Market Share, By Application, 2021

Figure 120: Nordic Countries Market Value (US$ million) and Forecast, 2022 to 2032

Figure 121: Nordic Countries Market Share, By Product Type, 2021

Figure 122: Nordic Countries Market Share, By Application, 2021

Figure 123: Nordic Countries Market Share, By Application, 2021

Figure 124: China Market Value (US$ million) and Forecast, 2022 to 2032

Figure 125: China Market Share, By Product Type, 2021

Figure 126: China Market Share, By Application, 2021

Figure 127: China Market Share, By Application, 2021

Figure 128: Japan Market Value (US$ million) and Forecast, 2022 to 2032

Figure 129: Japan Market Share, By Product Type, 2021

Figure 130: Japan Market Share, By Application, 2021

Figure 131: Japan Market Share, By Application, 2021

Figure 132: South Korea Market Value (US$ million) and Forecast, 2022 to 2032

Figure 133: South Korea Market Share, By Product Type, 2021

Figure 134: South Korea Market Share, By Application, 2021

Figure 135: South Korea Market Share, By Application, 2021

Figure 136: GCC Countries Market Value (US$ million) and Forecast, 2022 to 2032

Figure 137: GCC Countries Market Share, By Product Type, 2021

Figure 138: GCC Countries Market Share, By Application, 2021

Figure 139: GCC Countries Market Share, By Application, 2021

Figure 140: South Africa Market Value (US$ million) and Forecast, 2022 to 2032

Figure 141: South Africa Market Share, By Product Type, 2021

Figure 142: South Africa Market Share, By Application, 2021

Figure 143: South Africa Market Share, By Application, 2021

Figure 144: Turkey Market Value (US$ million) and Forecast, 2022 to 2032

Figure 145: Turkey Market Share, By Product Type, 2021

Figure 146: Turkey Market Share, By Application, 2021

Figure 147: Turkey Market Share, By Application, 2021

Recommendations

Healthcare

Tattoo Removal Laser Market

Published : March 2024

Healthcare

Extracorporeal Membrane Oxygenation Machine Market

Published : May 2022

Explore Healthcare Insights

View Reports

Extracorporeal CO2 Removal Devices Market