


Food Sustainability & Impact Assessment Software Market : Global Industry Analysis and Opportunity Assessment, 2036
The Food Sustainability & Impact Assessment Software Market is segmented by Solution, Deployment, End User, and Region. Forecast Period from 2026 to 2036
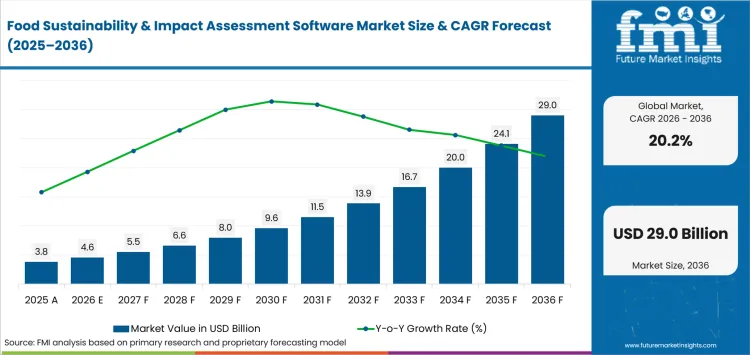
- Market Size (2026): USD 4.6 Bn
- Forecast (2036): USD 29.0 Bn
- CAGR (2026 to 2036): 20.2%
How big is food sustainability & impact assessment software market size?
USD 4.6 Billion in 2026 and USD 29.0 Billion by 2036 at a 20.2% CAGR.
Demand for food sustainability & impact assessment software is projected to expand at 20.2% CAGR between 2026 and 2036, increasing valuation from USD 4.6 billion in 2026 to USD 29.0 billion by 2036. companies are replacing isolated spreadsheets with controlled product-impact systems. Such systems connect formulas with supplier locations and agricultural practices. Packaging records extend assessment across distribution and waste. HowGood reported its Carbon Life Cycle module assesses 12 lifecycle stages. Product teams use stage-level results to identify material hotspots and preserve calculation evidence. Resulting workflows connect food supply chain traceability and compliance software with carbon accounting software during enterprise reporting design.
Organizations in United States and Germany are expected to favor method records and verifier access. Buyers in Netherlands and Australia are likely to stress claim evidence and phased reporting support. HowGood’s May 2026 update requires inclusion of 100% of labeled ingredients under its certified methodology. Complete formula records receive closer review during commercial assessments. Platform selection rests on evidence linking published results with source records. Allocation decisions and factor versions complete approval history.
Key Takeaways for the Food Sustainability & Impact Assessment Software Market
- Product-level evidence supports demand across reporting and supplier review. Reduction planning extends use across environmental claims.
- Cloud deployment is forecast to garner 58.0% share of deployment in 2026, backed by shared factor libraries improving controlled access across distributed teams.
- Manufacturers are estimated to lead end user with 43.9% share in 2026, influenced by direct ownership of formula records promoting repeatable customer disclosures.
- Inconsistent boundaries weaken dependable product comparisons, followed by factor variation also raising assurance effort.
- FoodChain ID, SGS, Bureau Veritas, Intertek, HowGood, Sourcemap, Watershed, and Normative represent profiled competition. Each company addresses a distinct evidence requirement.
Analyst Perspective
“Food-product impact software creates value through traceable calculations. Ingredient records need direct links with supplier evidence. Scenario choices require a documented approval history. Complete factor records improve verifier review. Durable adoption requires controlled stewardship across product and sustainability teams.”
- Sudip saha, Principal Analyst at Future Market Insights
How is food sustainability & impact assessment software market segmented?
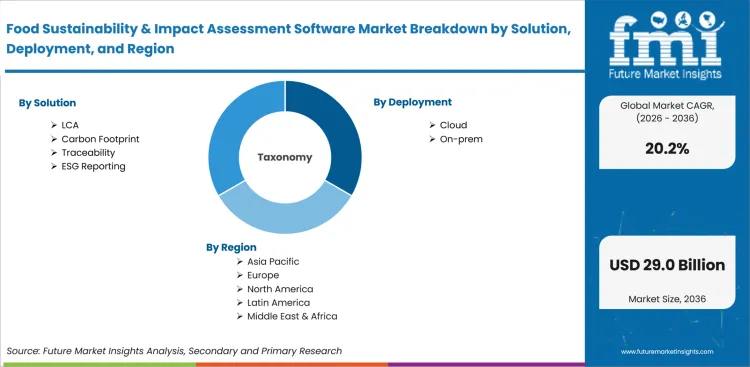
The food sustainability and impact assessment software is segmented by solution, deployment, end user, and region.
The food sustainability and impact assessment software is segmented by solution, deployment, end user, and region. Solution coverage separates LCA from Carbon Footprint. Traceability and ESG Reporting complete solution coverage. Deployment includes Cloud and On-premise systems. Each model serves a different hosting requirement. End User coverage includes Manufacturers, Retailers, and Ingredient Suppliers. Regional analysis spans North America and Latin America. Western Europe and Eastern Europe extend coverage. East Asia and South Asia and Pacific add major food-producing regions. Middle East and Africa complete geographic assessment.
What makes LCA central to the solution segment?
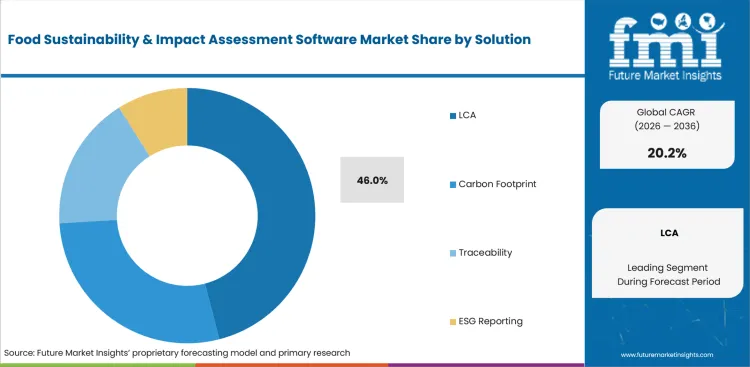
Life-cycle assessment establishes system boundaries before product impacts are calculated. Food assessments require agricultural geography and land-use treatment since ingredient origins alter emissions profiles. Biogenic emissions also need separate accounting across processing stages to prevent distorted product comparisons. HowGood’s January 2026 methodology maps 33,000 ingredients and materials to source origins, improving input precision across product-level calculations. Clear modelling choices and traceable origin data strengthen claim substantiation during anti-greenwashing review.
- By solution, LCA is anticipated to represent 46.0% share in 2026 since its method records a consistent boundary for product comparison and hotspot review. Reviewers inspect allocation choices and reduction assumptions without rebuilding each calculation during assurance.
- Carbon Footprint provides focused greenhouse-gas measurement for businesses managing portfolio emissions, and its narrower scope supports direct reporting use. Traceability records origin evidence. ESG Reporting then consolidates approved results for controlled disclosure.
Why does cloud lead the deployment segment?
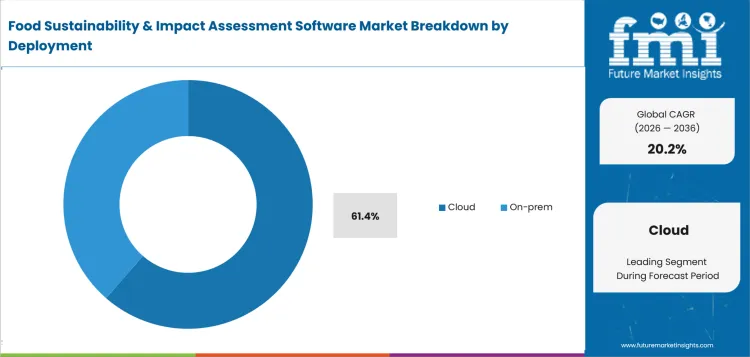
Cloud deployment connects manufacturers with ingredient suppliers by keeping sourcing evidence inside one controlled workspace. Farms and traders submit origin records within the platform, allowing product teams to resolve missing inputs before calculations proceed. Assurance providers then review approved outputs during claim preparation, preserving a clear sequence from supplier evidence to published results. HowGood’s March 2026 product log documented five vendor-level statuses, giving food companies a structured method for distinguishing initial data requests from vendor-verified product footprints. Each status represents a defined stage of supplier participation, helping teams identify delayed submissions and direct follow-up toward incomplete records. Central access reduces duplicate entries and links product-level calculations with emissions management processes.
- Cloud is predicted to secure 61.4% share of deployment in 2026, driven by shared factor access influencing supplier engagement and portfolio foot-printing. Enterprise reviews begin with regional hosting. Identity controls and factor-override records then receive assurance approval.
- On-premise deployment serves organizations retaining sensitive formulas and plant records inside locally managed environments. Internal ownership assigns software updates and factor maintenance to company teams across each reporting cycle.
What supports manufacturers across end user demand?
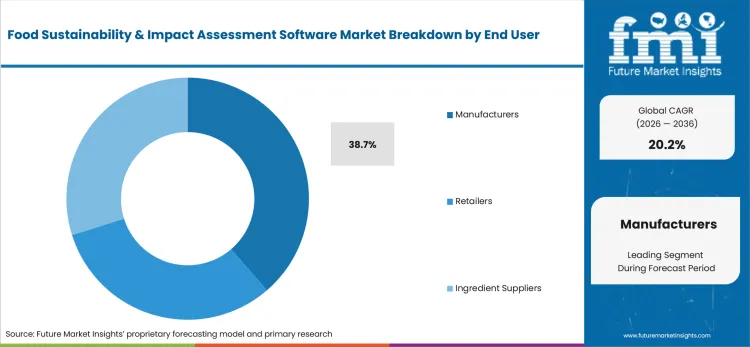
Manufacturers control product design and sourcing records, placing them at the point linking environmental inputs with commercial decisions. Production data connects packaging choices with customer reporting through one governed calculation, allowing reformulation teams to identify ingredient hotspots and answer retailer questionnaires using consistent evidence. HowGood’s January 2026 Latis documentation cites more than 90,000 agricultural emission factors, providing detailed coverage for matching formula ingredients with crop-specific and location-specific production profiles. Granular factor coverage reduces reliance on general averages and improves comparison accuracy across alternative sourcing or reformulation scenarios.
- Based on end user, manufacturers are likely to hold 38.7% share in 2026 as direct control over formulas links purchasing records with plant evidence. Approved calculation histories then support customer requests and recurring disclosures without repeated reconstruction.
- Retailers oversee extensive assortments and customer-facing claims, making supplier evidence central to product-level accuracy. Ingredient Suppliers contribute upstream process records that help downstream teams assess substitutions across Scope 3 work.
What are drivers, restraints, and opportunities in food sustainability & impact assessment software market?
Disclosure and claim substantiation support purchases. Inconsistent inputs restrict comparability, and integrated reporting creates expansion potential.
- Driver: Food companies need auditable product calculations for disclosures and supplier decisions.
- Restraint: Inconsistent boundaries weaken comparisons across food products.
- Opportunity: Controlled platforms connect ingredient evidence with corporate reporting.
Disclosure duties raise commercial risk under incomplete calculation histories. Product-level systems replace spend-based estimates with ingredient records. Commodity and location data improve repeatability. Competition and Markets Authority guidance published in January 2026 covers four named supply-chain roles. Retailers and brands share responsibility with manufacturers and suppliers. Shared responsibility favors governed software preserving material evidence. Such records strengthen demand for a compliance and traceability solution connected with product operations.
Method inconsistency restricts comparison across food products. Incomplete inventories reduce confidence in calculated results. Functional units may change product rankings. Allocation treatment also affects shared impacts. European Commission guidance published in July 2026 permits interim Environmental Footprint studies containing more than 10% non-compliant datasets under a required comparability disclaimer. Software standardizes workflow steps. Primary evidence gaps continue to require factor governance and verifier scrutiny.
Integrated reporting creates expansion potential across sourcing and formulation. Supplier engagement improves evidence quality. Standardized exchange formats support footprint reuse across customers. HowGood’s October 2025 announcement aligned 3.98 million product carbon footprints with Partnership for Carbon Transparency specifications. Interoperable data exchange reduces repeated manual conversion. Such alignment supports supply chain visibility software used for reduction decisions and enterprise disclosures.
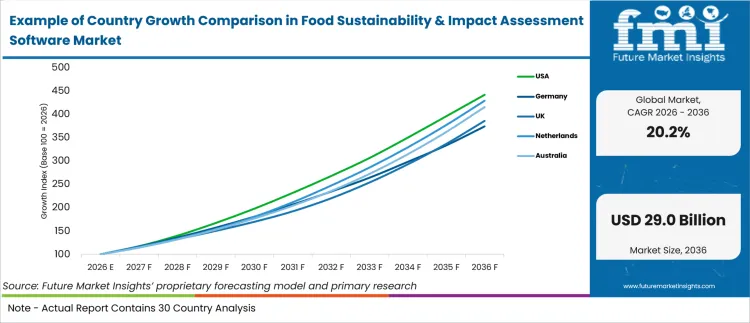
How are country CAGRs aligned in food sustainability & impact assessment software market?
| Country or Market | CAGR |
|---|---|
| Netherlands | 15.7% |
| Australia | 15.3% |
| United States | 14.9% |
| United Kingdom | 14.5% |
| Germany | 14.1% |
Source: Future Market Insights analysis, 2026.
How do country-level CAGRs compare in food sustainability & impact assessment software market?
Country comparison shows a gradual step-down across profiled markets. Netherlands occupies the upper forecast position. Australia follows at a limited distance. United States forms the middle position. United Kingdom and Germany complete the lower band. A 1.6 percentage-point spread separates Netherlands from Germany. National rates reflect different reporting conditions and claim-review practices.
- Netherlands is anticipated to lead profiled countries through direct scrutiny of sustainability claims.
- Australia is likely to follow under phased climate reporting and consumer-law review.
- United States is expected to occupy the middle band through state disclosure programs.
- United Kingdom and Germany are projected to complete comparison under documentation-led approval systems.
- Profiled rates form a gradual downward slope without sharp separation.
- Similar CAGRs may present different entry conditions through local method preferences and supplier readiness.
Country-wise Analysis
- Food sustainability & impact assessment software market in Netherlands is forecast to expand at 15.7% CAGR between 2026 and 2036, shaped by direct scrutiny of food-sector sustainability claims. Product teams need claim records connecting wording with formula evidence. Netherlands Authority for Consumers and Markets published 5 rules of thumb in April 2025, strengthening review of factual support and fair comparisons.
- Australian Securities and Investments Commission detailed a 3-group reporting phase in March 2025, creating staggered evidence calendars for covered entities. Food producers need configurable records for phased disclosures. Sales of food sustainability & impact assessment software in Australia are projected to increase at 15.3% CAGR from 2026 to 2036, influenced by climate reporting and consumer-law review.
- State disclosures require compatible product records across United States food portfolios. Industry in the United States is estimated to rise at 14.9% CAGR during the forecast period, reflecting layered reporting duties. California Air Resources Board counted more than 120 voluntary climate-risk reports by February 2026, showing active preparation among covered enterprises.
- United Kingdom sales are anticipated to advance at 14.5% CAGR during the study period, guided by formal disclosure review and supplier-information duties. Brand owners need evidence ownership across multi-party claims. Department for Business and Trade issued 2 UK Sustainability Reporting Standards in February 2026, increasing demand for traceable climate records.
- German Federal Statistical Office recorded 54% paid cloud-service use in November 2025, reducing unfamiliarity with hosted software among enterprises. Documentation-focused buyers examine method records and verifier access during platform selection. Food sustainability & impact assessment software adoption in Germany is predicted to increase at 14.1% CAGR by 2036, backed by formal governance across food manufacturers.
Who are notable companies in food sustainability & impact assessment software market?
FoodChain ID, SGS, Bureau Veritas, Intertek, HowGood, Sourcemap, Watershed, and Normative are notable companies profiled for market assessment.
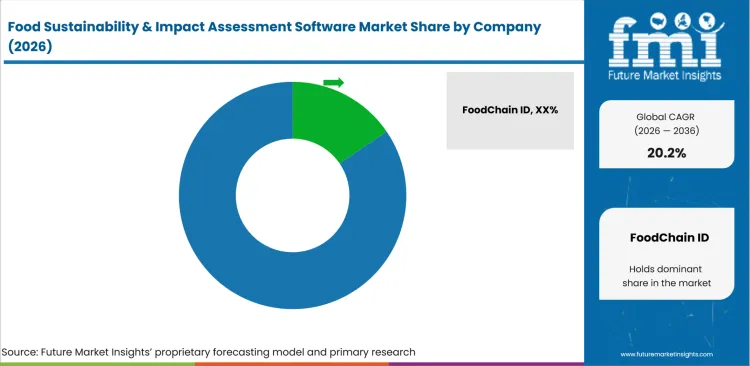
Competition separates food-specific impact data from supplier traceability. Enterprise carbon reporting forms another service area. Certification and independent assurance complete market coverage. HowGood provides ingredient and agricultural factors for product footprints. Watershed and Normative connect granular inputs with corporate reporting. Sourcemap maps supplier relationships and chain-of-custody evidence. FoodChain ID combines food compliance with verification services. SGS, Bureau Veritas, and Intertek support independent review. Buyer selection reflects required evidence depth and service coverage.
- HowGood and Watershed compete based on food-specific factors and product-footprint automation. Calculation histories and reporting exports complete review.
- Normative and Sourcemap address enterprise reporting and supplier traceability through different service models. Mapping depth and record authentication complete review.
- FoodChain ID and SGS compete depending on certification and food-sector expertise. Customer assessment considers scheme coverage. Assessor access and geographic service availability follow.
- Bureau Veritas and Intertek provide testing and sustainability assurance across international food operations. Commercial differentiation reflects technical methods. Audit coordination and service reach provide further distinction.
Competitive Benchmarking: Food Sustainability & Impact Assessment Software Market
| Company | Food-Specific Impact Data | Supply-Chain Traceability | Assurance / Reporting Integration | Geographic Reach |
|---|---|---|---|---|
| FoodChain ID | Medium | High | High | North America, Europe, Latin America, and Asia-Pacific |
| SGS | Medium | Medium | High | Global laboratory, audit, and certification network |
| Bureau Veritas | Medium | Medium | High | Global assurance network across major food markets |
| Intertek | Medium | Medium | High | Global testing, inspection, and assurance network |
| HowGood | High | Medium | Medium | North America and international food-industry customers |
| Sourcemap | Medium | High | Medium | United States, Europe, Australia, and global supplier networks |
| Watershed | Medium | Medium | High | North America, Europe, and multinational enterprises |
| Normative | Medium | Medium | High | Europe, North America, and international enterprise customers |
Source: Future Market Insights competitive analysis, 2026.
Key Developments in Food Sustainability & Impact Assessment Software Market
- In September 2025, HowGood launched Global Carbon Database as a standalone library of audit-ready food and agricultural emission factors. Release access reduced integration work for companies already operating enterprise reporting systems.
- In October 2025, Normative integrated HowGood data into its Vertical Carbon Data Module for food and agriculture. Integration connected sourcing detail with Scope 3 hotspot analysis and disclosure preparation.
- In January 2026, Sourcemap reported 196 suppliers onboarded through its AG1 traceability deployment. Supplier mapping strengthened origin evidence for recurring product-impact assessments.
Key Players in Food Sustainability & Impact Assessment Software Market
Food Impact Data and Enterprise Carbon Platforms
- HowGood
- Watershed
- Normative
Food Compliance and Multi-Tier Traceability
- FoodChain ID
- Sourcemap
Independent Testing, Verification, and Assurance
- SGS
- Bureau Veritas
- Intertek
Food Sustainability & Impact Assessment Software Market Report Scope
| Coverage field | Report scope |
|---|---|
| Market breakdown | Food sustainability & impact assessment software market breakdown includes Solution, Deployment, End User, and Region. |
| Quantitative Units | USD billion in 2026 to USD billion by 2036 at CAGR. |
| Market Definition | Food sustainability and impact assessment software calculates food-product life-cycle impacts and product carbon footprints. Supplier traceability supports food-sector ESG disclosures. General corporate ESG tools without food-specific factor coverage are excluded. |
| Regions Covered | North America, Latin America, Western Europe, Eastern Europe, East Asia, South Asia and Pacific, Middle East and Africa. |
| Countries Covered | Netherlands, Australia, United States, United Kingdom, Germany, and more than 25 additional countries complete full report coverage. |
| Key Companies Profiled | FoodChain ID, SGS, Bureau Veritas, Intertek, HowGood, Sourcemap, Watershed, and Normative. |
| Forecast Period | 2026 to 2036 |
| Approach | Hybrid bottom-up and top-down methodology uses segment shares and country CAGRs. Company activity and buyer adoption support final market reconciliation. |
Source: Future Market Insights analysis, 2026.
Food Sustainability & Impact Assessment Software Market - Research Methodology
| Method | Approach |
|---|---|
| Primary Research | FMI analysts gathered input from manufacturers, service providers, technology developers, distributors, end users, procurement teams, and subject-matter experts. Interviews examined purchasing decisions, product or service evaluation, adoption barriers, approval requirements, pricing considerations, and expectations for technical or commercial support. Respondents were also asked what evidence is required before a trial, pilot, or initial order develops into regular purchasing. |
| Desk Research | Desk research covered government statistics, regulatory publications, trade data, industry associations, technical literature, standards, company filings, product information, and official corporate announcements. Sources were reviewed for relevance, publication date, geographic coverage, and consistency with the defined market scope. Claims relating to performance, applications, approvals, capacity, investment, and commercial activity were retained only when supported by credible public evidence. |
| Market Sizing and Forecasting | The market model combined the baseline value with historical performance, segment structure, pricing and volume indicators, adoption levels, company participation, and country-level demand conditions. Forecast assumptions considered economic activity, investment trends, regulatory developments, technology adoption, purchasing cycles, supply availability, and barriers to wider market use. Segment and regional estimates were reconciled before the final market total was calculated. |
| Data Validation | Estimates were checked against multiple independent indicators, including public data, company activity, trade patterns, industry developments, and findings from primary interviews. Validation also tested whether products, services, applications, and company revenues fell within the defined market boundaries. Adjacent categories, unsupported claims, overlapping revenues, and activities without direct market relevance were excluded to reduce double counting and maintain consistency across segments and countries. |
Source: Future Market Insights analysis, 2026.
Food Sustainability & Impact Assessment Software Market by Segments
Food Sustainability & Impact Assessment Software Market segmented by Solution:
- LCA
- Carbon Footprint
- Traceability
- ESG Reporting
Food Sustainability & Impact Assessment Software Market segmented by Deployment:
- Cloud
- On-premise
Food Sustainability & Impact Assessment Software Market segmented by End User:
- Manufacturers
- Retailers
- Ingredient Suppliers
Food Sustainability & Impact Assessment Software Market segmented by Region:
- North America
- United States
- Canada
- Latin America
- Brazil
- Mexico
- Argentina
- Chile
- Western Europe
- Germany
- France
- United Kingdom
- Italy
- Spain
- Benelux
- Nordics
- Eastern Europe
- Poland
- Czech Republic
- Romania
- Hungary
- East Asia
- China
- Japan
- South Korea
- South Asia and Pacific
- India
- ASEAN
- Australia and New Zealand
- Middle East and Africa
- GCC Countries
- South Africa
- Türkiye
- Israel
Research Sources and Bibliography
- Australian Securities and Investments Commission. (2025, March 31). ASIC issues sustainability reporting regulatory guide.
- California Air Resources Board. (2026, February 26). CARB approves climate transparency regulation for entities doing business in California.
- Competition and Markets Authority. (2026, January 22). Making green claims: Getting it right, across the supply chain.
- Department for Business and Trade. (2026, February 25). UK Sustainability Reporting Standards: UK SRS S1 and UK SRS S2.
- European Commission, Directorate-General for Environment. (2026, July 14). Transitional guidance on the limited availability of EF-compliant datasets.
- German Federal Statistical Office. (2025, November 24). Enterprises using cloud computing services, by employment size class.
- HowGood. (2025, September 18). HowGood launches the Global Carbon Database, making best-in-class agricultural emissions data readily available to the food industry.
- HowGood. (2025, October 29). HowGood, the world’s largest agricultural emissions database, joins forces with PACT to unlock standardized decarbonization across the food supply chain.
- HowGood. (2026, January 21). Carbon life cycle.
- HowGood. (2026, January 21). FLAG emissions methodology.
- HowGood. (2026, January 21). Navigate the Latis interface.
- HowGood. (2026, March 16). Latest product updates.
- HowGood. (2026, May 7). Carbon Trust certification expansion (cradle-to-grave).
- Netherlands Authority for Consumers and Markets. (2025, April 24). ACM calls on companies in the food sector to check their sustainability claims.
- Normative. (2025, October 3). Normative integrates HowGood into new Vertical Carbon Data Module to enhance food & agriculture reporting.
- Sourcemap. (2026, January 13). Partnering for transparency: Sourcemap featured in AG1’s 2024 impact report.
- Watershed. (2025, April 22). HowGood and Watershed expand partnership.
This bibliography is provided for reader reference and is not exhaustive. The full report contains the complete reference list and detailed citations.
This Report Answers
- How large is food sustainability & impact assessment software demand in 2026?
- What valuation is forecast for 2036?
- What pressures support product-level assessment?
- Why does LCA lead Solution demand?
- How does cloud influence supplier engagement?
- Why do manufacturers lead end user demand?
- How do profiled country CAGRs compare?
- What companies provide food-impact evidence?
- What conditions restrict platform adoption?
- How are forecasts validated?
Frequently Asked Questions
What supports demand in food sustainability & impact assessment software market?
Product-level carbon accounting supports adoption by helping food companies measure environmental impacts across ingredients and distribution stages. Supplier engagement strengthens reporting accuracy by preserving source records needed for assurance reviews and environmental claim approval.
Who are key players in food sustainability & impact assessment software market?
FoodChain ID, SGS, Bureau Veritas, Intertek, HowGood, Sourcemap, Watershed, and Normative are notable participants serving distinct assessment requirements. Company capabilities cover food-specific impact data, supplier traceability, enterprise carbon reporting, certification support, and independent verification.
What restraint affects food sustainability & impact assessment software market?
Differences in system boundaries, allocation methods, and emissions factors restrict dependable comparisons across products with similar ingredients or production profiles. Missing supplier evidence further weakens assurance confidence since reviewers cannot confirm calculation inputs or trace reported outcomes to primary records.
Why do executives track food sustainability & impact assessment software market?
Product-impact evidence informs sourcing and formulation decisions by showing how ingredient changes influence environmental performance across each product lifecycle. Reporting obligations extend responsibility across sustainability and product teams responsible for approving published environmental information.
What business problem does food sustainability & impact assessment software market address?
Software connects farm records and logistics activity within one controlled product-assessment process. Approval histories preserve calculation methods and factor revisions, allowing teams to reproduce disclosures during customer requests or assurance reviews.
What do sustainability teams evaluate prior to selecting companies?
Sustainability teams assess food-specific factor coverage and methodology transparency to determine whether product calculations reflect credible agricultural and processing conditions. Platform reviews also examine supplier workflows and verifier access during assurance preparation.
What limits return on investment for purchasing teams?
Repeated record cleaning weakens return on investment by increasing implementation effort across supplier onboarding and calculation updates. Reusable calculations improve commercial value when approved results support several products and reduction programs.
How do companies build long-term customer confidence?
Transparent methods support long-term confidence by showing how each product result links to documented assumptions and approved factors. Maintained factor libraries and independent review strengthen recurring use by preserving calculation consistency across future reporting and product-development programs.
Table of Content
- Key Takeaways
- Market Size and CAGR
- Top Growth Driver
- Fastest Growing Segment
- Leading Region
- Key Companies
- Emerging Opportunities
- Executive Summary
- Global Market Outlook
- Demand-side Trends
- Supply-side Trends
- Technology Roadmap Analysis
- Analysis and Recommendations
- Analyst Perspective (What is happening? Why now? What should investors know?)
- Key Questions Answered
- How large is the market?
- What is the CAGR?
- What are key trends?
- Which region dominates?
- Who are the leaders?
- Market Overview
- Market Coverage / Taxonomy
- Market Definition / Scope / Limitations
- Research Methodology
- Chapter Orientation
- Analytical Lens and Working Hypotheses
- Market Structure, Signals, and Trend Drivers
- Benchmarking and Cross-market Comparability
- Market Sizing, Forecasting, and Opportunity Mapping
- Research Design and Evidence Framework
- Desk Research Programme (Secondary Evidence)
- Expert Input and Fieldwork (Primary Evidence)
- Tooling, Models, and Reference Databases
- Data Engineering and Model Build
- Quality Assurance and Audit Trail
- Market Background
- Market Dynamics (Drivers, Restraints, Opportunity, Trends)
- Scenario Forecast (Optimistic, Likely, Conservative)
- Impact Analysis
- AI Impact
- Sustainability Impact
- Regulatory Impact
- Technology Impact
- Consumer / Buyer Analysis
- Purchase Drivers
- Adoption Barriers
- Buyer Journey
- Opportunity Map Analysis
- Product Life Cycle Analysis
- Supply Chain Analysis
- Investment Feasibility Matrix
- Value Chain Analysis
- PESTLE and Porter's Analysis
- Regulatory Landscape
- Regional Parent Market Outlook
- Production and Consumption Statistics
- Import and Export Statistics
- Global Market Analysis and Forecast, 2021 to 2036
- Historical Market Size Value (USD Billion) Analysis, 2021 to 2025
- Current and Future Market Size Value (USD Billion) Projections, 2026 to 2036
- Y-o-Y Growth Trend Analysis
- Absolute $ Opportunity Analysis
- Global Market Pricing Analysis, 2021 to 2036
- Global Market Analysis and Forecast, By Solution, 2021 to 2036
- Introduction / Key Findings
- Historical Market Size Value (USD Billion) Analysis By Solution, 2021 to 2025
- Current and Future Market Size Value (USD Billion) Analysis and Forecast By Solution, 2026 to 2036
- LCA
- Carbon Footprint
- Traceability
- ESG Reporting
- LCA
- Y-o-Y Growth Trend Analysis By Solution, 2021 to 2025
- Absolute $ Opportunity Analysis By Solution, 2026 to 2036
- Global Market Analysis and Forecast, By Deployment, 2021 to 2036
- Introduction / Key Findings
- Historical Market Size Value (USD Billion) Analysis By Deployment, 2021 to 2025
- Current and Future Market Size Value (USD Billion) Analysis and Forecast By Deployment, 2026 to 2036
- Cloud
- On-prem
- Cloud
- Y-o-Y Growth Trend Analysis By Deployment, 2021 to 2025
- Absolute $ Opportunity Analysis By Deployment, 2026 to 2036
- Global Market Analysis and Forecast, By End User, 2021 to 2036
- Introduction / Key Findings
- Historical Market Size Value (USD Billion) Analysis By End User, 2021 to 2025
- Current and Future Market Size Value (USD Billion) Analysis and Forecast By End User, 2026 to 2036
- Manufacturers
- Retailers
- Ingredient Suppliers
- Manufacturers
- Y-o-Y Growth Trend Analysis By End User, 2021 to 2025
- Absolute $ Opportunity Analysis By End User, 2026 to 2036
- Global Market Analysis and Forecast, By Region, 2021 to 2036
- Introduction
- Historical Market Size Value (USD Billion) Analysis By Region, 2021 to 2025
- Current Market Size Value (USD Billion) Analysis and Forecast By Region, 2026 to 2036
- North America
- Latin America
- Western Europe
- Eastern Europe
- East Asia
- South Asia and Pacific
- Middle East & Africa
- Market Attractiveness Analysis By Region
- North America Market Analysis and Forecast, By Country, 2021 to 2036
- Historical Market Size Value (USD Billion) Trend Analysis By Market Taxonomy, 2021 to 2025
- Market Size Value (USD Billion) Forecast By Market Taxonomy, 2026 to 2036
- By Country
- USA
- Canada
- By Solution
- By Deployment
- By End User
- By Country
- Market Attractiveness Analysis
- By Country
- By Solution
- By Deployment
- By End User
- Key Takeaways
- Latin America Market Analysis and Forecast, By Country
- Historical Market Size Value (USD Billion) Trend Analysis By Market Taxonomy, 2021 to 2025
- Market Size Value (USD Billion) Forecast By Market Taxonomy, 2026 to 2036
- By Country
- Brazil
- Mexico
- Chile
- Rest of Latin America
- By Solution
- By Deployment
- By End User
- By Country
- Market Attractiveness Analysis
- By Country
- By Solution
- By Deployment
- By End User
- Key Takeaways
- Western Europe Market Analysis and Forecast, By Country
- Historical Market Size Value (USD Billion) Trend Analysis By Market Taxonomy, 2021 to 2025
- Market Size Value (USD Billion) Forecast By Market Taxonomy, 2026 to 2036
- By Country
- Germany
- UK
- Italy
- Spain
- France
- Nordic
- BENELUX
- Rest of Western Europe
- By Solution
- By Deployment
- By End User
- By Country
- Market Attractiveness Analysis
- By Country
- By Solution
- By Deployment
- By End User
- Key Takeaways
- Eastern Europe Market Analysis and Forecast, By Country
- Historical Market Size Value (USD Billion) Trend Analysis By Market Taxonomy, 2021 to 2025
- Market Size Value (USD Billion) Forecast By Market Taxonomy, 2026 to 2036
- By Country
- Russia
- Poland
- Hungary
- Balkan & Baltic
- Rest of Eastern Europe
- By Solution
- By Deployment
- By End User
- By Country
- Market Attractiveness Analysis
- By Country
- By Solution
- By Deployment
- By End User
- Key Takeaways
- East Asia Market Analysis and Forecast, By Country
- Historical Market Size Value (USD Billion) Trend Analysis By Market Taxonomy, 2021 to 2025
- Market Size Value (USD Billion) Forecast By Market Taxonomy, 2026 to 2036
- By Country
- China
- Japan
- South Korea
- By Solution
- By Deployment
- By End User
- By Country
- Market Attractiveness Analysis
- By Country
- By Solution
- By Deployment
- By End User
- Key Takeaways
- South Asia and Pacific Market Analysis and Forecast, By Country
- Historical Market Size Value (USD Billion) Trend Analysis By Market Taxonomy, 2021 to 2025
- Market Size Value (USD Billion) Forecast By Market Taxonomy, 2026 to 2036
- By Country
- India
- ASEAN
- Australia & New Zealand
- Rest of South Asia and Pacific
- By Solution
- By Deployment
- By End User
- By Country
- Market Attractiveness Analysis
- By Country
- By Solution
- By Deployment
- By End User
- Key Takeaways
- Middle East & Africa Market Analysis and Forecast, By Country
- Historical Market Size Value (USD Billion) Trend Analysis By Market Taxonomy, 2021 to 2025
- Market Size Value (USD Billion) Forecast By Market Taxonomy, 2026 to 2036
- By Country
- Kingdom of Saudi Arabia
- Other GCC Countries
- Türkiye
- South Africa
- Other African Union
- Rest of Middle East & Africa
- By Solution
- By Deployment
- By End User
- By Country
- Market Attractiveness Analysis
- By Country
- By Solution
- By Deployment
- By End User
- Key Takeaways
- Key Countries Market Analysis
- USA
- Pricing Analysis
- Market Share Analysis, 2025
- By Solution
- By Deployment
- By End User
- Canada
- Pricing Analysis
- Market Share Analysis, 2025
- By Solution
- By Deployment
- By End User
- Mexico
- Pricing Analysis
- Market Share Analysis, 2025
- By Solution
- By Deployment
- By End User
- Brazil
- Pricing Analysis
- Market Share Analysis, 2025
- By Solution
- By Deployment
- By End User
- Chile
- Pricing Analysis
- Market Share Analysis, 2025
- By Solution
- By Deployment
- By End User
- Germany
- Pricing Analysis
- Market Share Analysis, 2025
- By Solution
- By Deployment
- By End User
- UK
- Pricing Analysis
- Market Share Analysis, 2025
- By Solution
- By Deployment
- By End User
- Italy
- Pricing Analysis
- Market Share Analysis, 2025
- By Solution
- By Deployment
- By End User
- Spain
- Pricing Analysis
- Market Share Analysis, 2025
- By Solution
- By Deployment
- By End User
- France
- Pricing Analysis
- Market Share Analysis, 2025
- By Solution
- By Deployment
- By End User
- India
- Pricing Analysis
- Market Share Analysis, 2025
- By Solution
- By Deployment
- By End User
- ASEAN
- Pricing Analysis
- Market Share Analysis, 2025
- By Solution
- By Deployment
- By End User
- Australia & New Zealand
- Pricing Analysis
- Market Share Analysis, 2025
- By Solution
- By Deployment
- By End User
- China
- Pricing Analysis
- Market Share Analysis, 2025
- By Solution
- By Deployment
- By End User
- Japan
- Pricing Analysis
- Market Share Analysis, 2025
- By Solution
- By Deployment
- By End User
- South Korea
- Pricing Analysis
- Market Share Analysis, 2025
- By Solution
- By Deployment
- By End User
- Russia
- Pricing Analysis
- Market Share Analysis, 2025
- By Solution
- By Deployment
- By End User
- Poland
- Pricing Analysis
- Market Share Analysis, 2025
- By Solution
- By Deployment
- By End User
- Hungary
- Pricing Analysis
- Market Share Analysis, 2025
- By Solution
- By Deployment
- By End User
- Kingdom of Saudi Arabia
- Pricing Analysis
- Market Share Analysis, 2025
- By Solution
- By Deployment
- By End User
- Türkiye
- Pricing Analysis
- Market Share Analysis, 2025
- By Solution
- By Deployment
- By End User
- South Africa
- Pricing Analysis
- Market Share Analysis, 2025
- By Solution
- By Deployment
- By End User
- USA
- Market Structure Analysis
- Competition Dashboard
- Competition Benchmarking
- Market Share Analysis of Top Players
- By Regional
- By Solution
- By Deployment
- By End User
- Emerging Startups
- Innovation Benchmarking
- Competition Analysis
- Competition Deep Dive
- FoodChain ID
- Overview
- Product Portfolio
- Profitability by Market Segments
- Sales Footprint
- Strategy Overview
- Marketing Strategy
- Product Strategy
- Channel Strategy
- SGS
- Bureau Veritas
- Intertek
- HowGood
- Sourcemap
- Watershed
- Normative
- FoodChain ID
- Case Studies
- Success Stories
- Recent Developments
- Competition Deep Dive
- Assumptions & Acronyms Used


