

- Market Size (2026)
- USD 5.8 Bn
- Forecast (2036)
- USD 21.3 Bn
- CAGR (2026 to 2036)
- 13.9%
How big is Food Supply Chain Traceability & Compliance Software Market in 2026?
USD 5.8 billion in 2026 and USD 21.3 billion by 2036 at a 13.9% CAGR.
The food supply chain traceability & compliance software market is projected to expand from USD 5.8 billion in 2026 to USD 21.3 billion by 2036 at a 13.9% CAGR. FDA’s February 2026 implementation update confirms covered entities must maintain records for critical tracking events across designated foods. Those recurring records make food traceability systems relevant to recall preparation and partner data exchange across regulated supply chains.
Country adoption diverges because identical EUDR duties produce different software workloads as commodity portfolios change. France’s environmental statistics service reported in February 2026 that cocoa represented 27% of land footprint across six deforestation-risk imports despite 7% of import volume. That imbalance raises the value of EUDR due-diligence software for French cocoa portfolios that must connect origin evidence with product movement records.
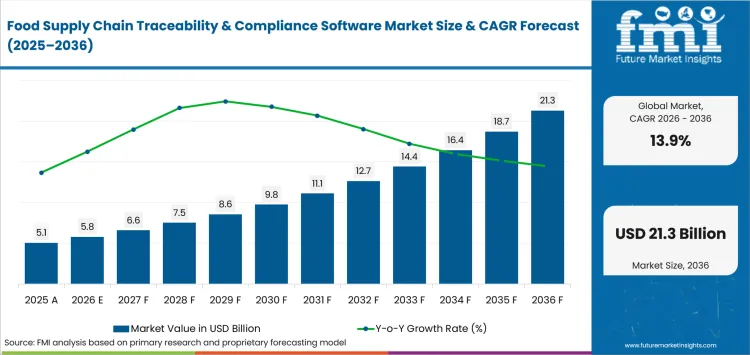
Key Takeaways of Food Supply Chain Traceability & Compliance Software Market
- Food companies are expected to increase spending as traceability records become mandatory for recalls and market access.
- Based on solution, traceability is projected to account for 41.9% in 2026 due to shared event records across compliance tasks.
- In 2026, cocoa is expected to lead commodity with 47.9% share because European trade requires persistent origin evidence.
- Food manufacturers are set to lead end user with 39.6% share in 2026 due to plant-level production genealogy.
- Fragmented first-mile records can delay implementation when farms and trading partners cannot provide consistent identifiers or origin evidence.
- FoodChain ID, iFoodDS, Trustwell, Sourcemap, TraceX, osapiens, Intertek and IntegrityNext are the key players in the market.
Analyst Perspective
"Food companies should test whether a platform reconstructs lot journeys across trading partners without manual reconciliation. Commercial fit improves when the same records serve recalls and EUDR submissions while independent assurance stays reviewable."
- Sudip Saha, Principal Consultant, Future Market Insights
How is the Food Supply Chain Traceability & Compliance Software Market segmented?
The food supply chain traceability & compliance software market is segmented by solution, commodity, end user and region.
Solution covers traceability, EUDR/deforestation compliance, blockchain and MRV while commodity distinguishes cocoa, coffee, palm and soy. End user includes food manufacturers, foodservice operators, retailers and household users while region organizes the same revenue boundary across the standard FMI geographic taxonomy.
What makes traceability central to the solution category?
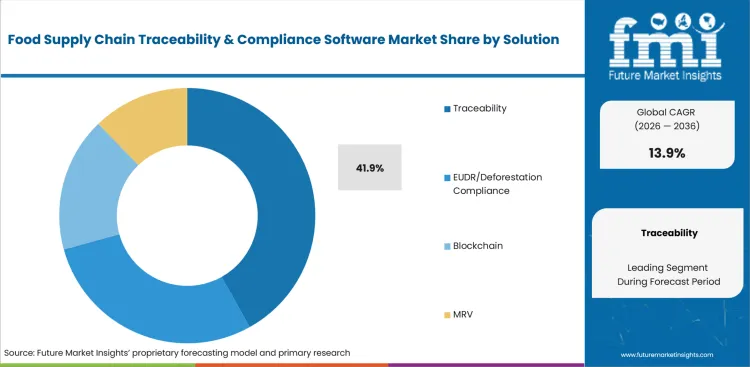
Traceability connects product identity with events that move food between facilities and trading partners. FDA reported in June 2026 that most firms in its readiness exercises supplied requested records within 24 hours while some data elements still created gaps. Remaining gaps make FSMA traceability integration useful when partner systems preserve event records across company boundaries.
- By solution, traceability is estimated to hold 41.9% in 2026 owing to shared event records that support recall and compliance work.
- Food safety teams reuse lot and location history during investigations while compliance teams use the same lineage to prepare regulator-ready records.
Why does cocoa anchor the commodity category?
Cocoa sourcing crosses farms and aggregators before processing creates new product identities, making origin continuity vulnerable as beans enter combined lots. EUDR-facing cocoa programs need farm geolocation and ownership records tied to shipment lineage across aggregation and processing.
- The commodity category is forecast to be led by cocoa at 47.9% share in 2026 due to repeated origin handoffs involving cocoa ingredients before regulated European market entry.
- The European Commission confirmed in July 2026 that EUDR covers cocoa and provides Information System support for due-diligence statements. Regulated cocoa trade therefore requires farm geolocation to remain connected with shipment lineage.
What supports food manufacturers in the end user category?
Food manufacturers own the transformation step that joins incoming ingredient evidence to finished production lots. FoodChain ID introduced a risk-intelligence platform in July 2026 for food manufacturers operating across complex supply chains. The platform combines risk data with internal records so food technology systems can support supplier review beside production-linked compliance information.
- By end user, food manufacturers are forecast to represent 39.6% in 2026 driven by plant genealogy that links supplier lots with customer records.
- Quality and regulatory teams gain more from shared lineage when incoming provenance can be reconciled with production events and customer shipments.
What are the drivers, restraints and opportunities in the food supply chain traceability & compliance software market?
Regulatory evidence requirements create recurring traceability work while inconsistent partner data slows implementation and interoperable event standards widen the reuse opportunity.
- Driver: Food safety and deforestation rules turn traceability records into recurring evidence for regulated transactions and investigations.
- Restraint: Inconsistent partner identifiers and first-mile records increase exception handling before an end-to-end chain can be defended.
- Opportunity: Interoperable event data can let one verified record set serve recall workflows and several compliance submissions.
Regulatory Records Become Recurring Compliance Work
Formal evidence duties become software purchase triggers once food companies must submit origin records that can withstand regulator review across regulated commodity movements. Intertek launched EUDRtrace in April 2025 as part of an EUDR solution suite covering regulatory assistance, training, commodity and product mapping, on-the-ground verification, and supply chain traceability technology. Food companies judge blockchain food traceability platforms by whether origin records pass into due-diligence submissions without rebuilding each shipment file.
Partner Data Gaps Slow End-to-End Traceability
Lot-level implementation slows when trading partners cannot provide consistent identifiers and event records at the detail required for regulators to reconstruct movement across multiple companies during formal regulatory retrieval requests. FDA’s June 2026 public meeting focused on remaining tracking challenges and possible flexibilities, leaving supply chain visibility software dependent on onboarding methods that reliably preserve structured records across company boundaries.
Interoperable Event Records Extend Compliance Reuse
GS1 last modified its provisional EUDR standard in September 2025 and defined a mechanism for trading partners to communicate due-diligence reference and verification numbers with product or transaction context. Compliance automation tools become more useful when one shipment record can feed regulatory checks without another supplier data collection cycle. Food diagnostics services remain separate investigative inputs, so platforms should not treat laboratory evidence as a substitute for origin or transaction records.
Which country CAGRs are profiled in the Food Supply Chain Traceability & Compliance Software Market?
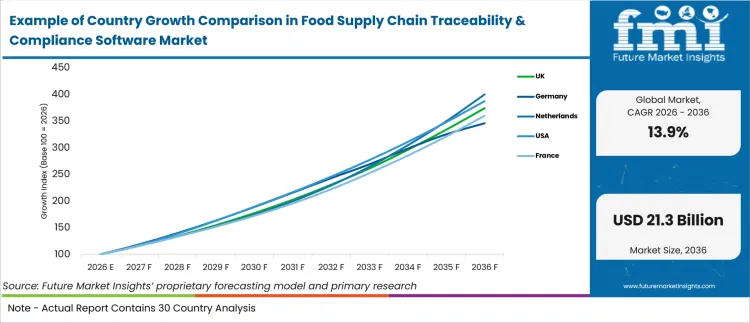
| Country | CAGR |
|---|---|
| Netherlands | 14.9% |
| USA | 14.5% |
| UK | 14.1% |
| France | 13.7% |
| Germany | 13.3% |
How do country-level CAGRs compare in the Food Supply Chain Traceability & Compliance Software Market?
The five forecasts span 1.6 percentage points from the Netherlands at 14.9% to Germany at 13.3%. Netherlands and USA form a compact upper pair while UK and France occupy the middle. Germany remains close to the group so local regulation and data-transfer conditions explain more than the numerical ranking alone.
- Netherlands: Cocoa processing and re-export flows multiply origin handoffs before European manufacturing.
- USA: FSMA 204 centers implementation on lot-level data exchange across covered trading partners.
- UK: Planned SPS alignment adds configurable traceability changes to existing domestic food-law records.
- France: EUDR preparation links imported commodity origin evidence with established EU food controls.
- Germany: Federal EUDR administration places formal due-diligence governance beside enterprise supplier validation.
Similar CAGRs can therefore produce different operating and entry conditions for software providers. The full report provides country-level CAGR analysis across North America, Latin America, Europe, East Asia, South Asia, Oceania and the Middle East and Africa.
Country-wise Analysis
- Amsterdam and Zaanstreek processors receive cocoa that changes identity across import and aggregation before finished products move onward to European customers in high-volume trading programs. Statistics Netherlands reported in April 2026 that the country remained the world’s largest cocoa-bean importer by volume during 2025 and the leading exporter of cocoa products. The Netherlands is estimated to post 14.9% CAGR over the forecast period owing to reusable origin records across repeated commercial transfers. Large processors gain from transaction-level lineage, but farm evidence must survive consolidation and transformation before software can preserve a defensible chain from origin to shipment without manual reconciliation.
- Large United States food networks exchange lot records across manufacturers and distributors before retailers or foodservice operators receive products in separate business systems. FDA’s August 2025 regulatory analysis proposed July 20 2028 as the compliance date for the Food Traceability Rule. The agency said affected entities needed more implementation time, which makes partner identifier alignment a current planning task across covered foods. Food supply chain traceability & compliance software demand in the USA is forecast to rise at 14.5% CAGR over the forecast period supported by structured event exchange. Enterprise software providers gain an implementation route, but uneven partner readiness can prolong onboarding and exception handling across national food networks.
- UK food manufacturers already maintain supplier and customer traceability records across domestic networks as planned EU alignment changes the rules applied to existing systems. DEFRA stated in March 2026 that the planned SPS alignment would update food traceability requirements and could require businesses to act. That regulatory direction gives software teams a clearer configuration path without removing migration work across legacy plant and supplier histories. Adoption of traceability and compliance software in the UK is estimated to expand at 14.1% CAGR through 2036 owing to configurable rule logic. Implementation details remain unsettled enough to require adaptable data models and controlled change management during rollout.
- French food companies already manage EU food-control records across manufacturing operations, so EUDR origin evidence must fit established lot and supplier histories. France’s food supply chain traceability & compliance software outlook is anticipated to advance at 13.7% CAGR over the assessment period owing to regulated origin work. The government’s imported-deforestation portal confirmed in July 2026 that EUDR covers cocoa and coffee under the December 2026 application timetable. Local compliance teams therefore have a defined route for joining due-diligence records to existing food controls without rebuilding core traceability data. Incomplete supplier declarations remain the main friction because missing origin details can interrupt evidence lineage inside production records.
- German food and commodity companies place EUDR records inside enterprise governance systems that separate supplier approval from operational purchasing. The German sector is projected to record 13.3% CAGR during the assessment period supported by formal review controls across regulated cocoa and coffee imports. Germany’s agriculture ministry stated in May 2025 that BLE is the competent EUDR authority and provides information plus helpdesk support for businesses. That route gives local compliance teams a named implementation authority while preserving internal responsibility for checking supplier evidence before regulated shipments proceed. Data validation remains a friction for large purchasing organizations that must reconcile declarations across many suppliers and internal systems.
Who are the notable companies in the Food Supply Chain Traceability & Compliance Software Market?
FoodChain ID, iFoodDS, Trustwell, Sourcemap, TraceX, osapiens, Intertek and IntegrityNext are eight notable companies.
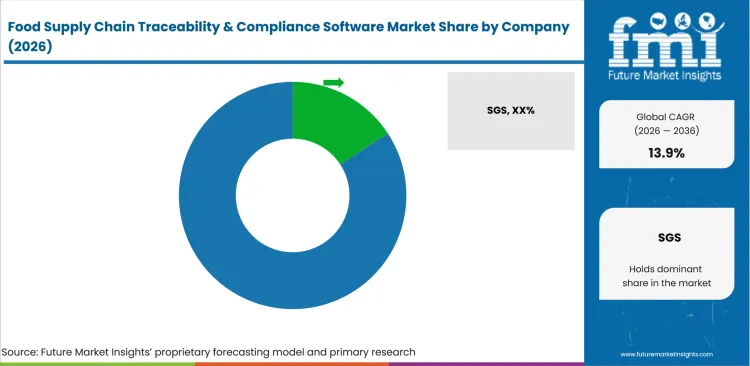
The field is fragmented between food traceability platforms and broader compliance software providers serving different evidence workflows. Entry depends on cross-company data exchange and supplier onboarding, while food safety testing services remain outside the software revenue boundary.
- Food compliance and lot traceability: FoodChain ID, iFoodDS and Trustwell focus on food compliance, supplier data and lot-level traceability, with iFoodDS concentrating its strategy on Trace Exchange and connected food traceability.
- Multi-tier EUDR traceability: Sourcemap, TraceX and osapiens connect supplier mapping with geolocation and due-diligence workflows.
- Compliance and validation: Intertek and IntegrityNext combine EUDR workflow controls with independent or automated evidence checks.
Competitive Benchmarking: Food Supply Chain Traceability & Compliance Software Market
| Company | Traceability Data Workflow Depth | Regulatory Workflow Breadth | Evidence Validation and Risk Controls | Geographic Reach |
|---|---|---|---|---|
| FoodChain ID | Medium | Medium | Medium | Global food-industry coverage |
| iFoodDS | High | Medium | Medium | United States; supplier-facing food networks |
| Trustwell | High | Medium | Medium | Worldwide food and supplement companies |
| Sourcemap | High | Medium | High | North America and Europe; global supplier networks |
| TraceX | High | Medium | High | India and international agri-food supply chains |
| osapiens | Medium | Medium | High | Europe and United States; worldwide customers |
| Intertek | Medium | Medium | High | Global |
| IntegrityNext | Medium | Medium | High | Global supplier networks |
Key Developments in the Food Supply Chain Traceability & Compliance Software Market
- In May 2026, iFoodDS and Markem-Imaje announced a partnership providing GS1-compliant FSMA 204 label templates through Trace Exchange, while automated capture of CoLOS-generated data into Trace Exchange was planned as a subsequent integration.
- In September 2025, osapiens and IFS added a digital EUDR self-assessment within the osapiens HUB. The workflow collects supplier evidence and applies automated risk scoring before regulated commodity records enter formal due-diligence review.
- In March 2025, Sourcemap went live with EU TRACES and SAP integrations for EUDR customers. The workflow connects ERP shipment data with farm mapping and due-diligence submission.
Key Players in the Food Supply Chain Traceability & Compliance Software Market
Food Compliance and Lot Traceability
- FoodChain ID
- iFoodDS
- Trustwell
Multi-Tier EUDR Traceability Platforms
- Sourcemap
- TraceX
- osapiens
Compliance Platforms with Integrated Validation
- Intertek
- IntegrityNext
Food Supply Chain Traceability & Compliance Software Market - Report Scope
| Coverage field | Report scope |
|---|---|
| Market breakdown | By solution, commodity, end user and region. |
| Quantitative Units | Revenue in USD billion and CAGR in %. |
| Market Definition | Revenue includes software subscriptions, licenses, usage fees, implementation, configuration, API integration and software-linked support for traceability plus EUDR/deforestation compliance, blockchain and MRV workflows while excluding finished-food revenue, hardware-only systems and stand-alone assurance services outside the named software solution. |
| Regions Covered | North America, Latin America, Europe, East Asia, South Asia and Pacific, and Middle East and Africa. |
| Countries Covered | Netherlands, USA, UK, France, Germany, and 20+ countries included in the full report. |
| Key Companies Profiled | FoodChain ID, iFoodDS, Trustwell, Sourcemap, TraceX, osapiens, Intertek and IntegrityNext. |
| Forecast Period | 2026 to 2036. |
| Approach | Primary and secondary research with market triangulation. |
Food Supply Chain Traceability & Compliance Software Market - Research Methodology
| Method | Approach |
|---|---|
| Primary Research | FMI analysts gathered input from manufacturers, service providers, technology developers, distributors, end users, procurement teams, and subject-matter experts. Interviews examined purchasing decisions, product or service evaluation, adoption barriers, approval requirements, pricing considerations, and expectations for technical or commercial support. Respondents were also asked what evidence is required before a trial, pilot, or initial order develops into regular purchasing. |
| Desk Research | Desk research covered government statistics, regulatory publications, trade data, industry associations, technical literature, standards, company filings, product information, and official corporate announcements. Sources were reviewed for relevance, publication date, geographic coverage, and consistency with the defined market scope. Claims relating to performance, applications, approvals, capacity, investment, and commercial activity were retained only when supported by credible public evidence. |
| Market Sizing and Forecasting | The market model combined the baseline value with historical performance, segment structure, pricing and volume indicators, adoption levels, company participation, and country-level demand conditions. Forecast assumptions considered economic activity, investment trends, regulatory developments, technology adoption, purchasing cycles, supply availability, and barriers to wider market use. Segment and regional estimates were reconciled before the final market total was calculated. |
| Data Validation | Estimates were checked against multiple independent indicators, including public data, company activity, trade patterns, industry developments, and findings from primary interviews. Validation also tested whether products, services, applications, and company revenues fell within the defined market boundaries. Adjacent categories, unsupported claims, overlapping revenues, and activities without direct market relevance were excluded to reduce double counting and maintain consistency across segments and countries. |
Food Supply Chain Traceability & Compliance Software Market by Segments
Food Supply Chain Traceability & Compliance Software Market segmented by Solution:
- Traceability
- EUDR/Deforestation Compliance
- Blockchain
- MRV
Food Supply Chain Traceability & Compliance Software Market segmented by Commodity:
- Cocoa
- Coffee
- Palm
- Soy
Food Supply Chain Traceability & Compliance Software Market segmented by End User:
- Food Manufacturers
- Foodservice Operators
- Retailers
- Household
Food Supply Chain Traceability & Compliance Software Market by Region:
- North America
- United States
- Canada
- Latin America
- Brazil
- Mexico
- Chile
- Rest of Latin America
- Western Europe
- Germany
- United Kingdom
- Italy
- Spain
- France
- Nordics
- Benelux
- Rest of Western Europe
- Eastern Europe
- Russia
- Poland
- Hungary
- Balkan and Baltic States
- Rest of Eastern Europe
- East Asia
- China
- Japan
- South Korea
- South Asia and Pacific
- India
- ASEAN
- Australia and New Zealand
- Rest of South Asia and Pacific
- Middle East and Africa
- Kingdom of Saudi Arabia
- Other GCC Countries
- Türkiye
- South Africa
- Other African Union Countries
- Rest of Middle East and Africa
Research Sources and Bibliography
- USA Food and Drug Administration. (2026, February 19). FDA Takes Several Actions Related to the Food Traceability Rule.
- Service des données et études statistiques. (2026, February 19). Empreinte "terre" des importations françaises de produits à risque de déforestation en 2023.
- USA Food and Drug Administration. (2026, June 10). FDA Releases Report on Traceability Readiness Tabletop Exercises and Updated FAQS.
- European Commission, Directorate-General for Environment. (2026, July 13). Commission updates product scope and digital tools to support implementation of EU Deforestation Regulation.
- FoodChain ID. (2026, July 13). FoodChain ID Expands AI Strategy with Intelligent Monitoring for Global Food & Beverage Companies.
- Intertek. (2025, April 1). Intertek Launches Comprehensive Suite of Solutions to Support EUDR Compliance for Key Commodities.
- USA Food and Drug Administration. (2026, June 15). FDA Public Meeting- Challenges and Solutions in Lot-Level Food Traceability.
- GS1. (2025, September 24). GS1 European Union Deforestation Regulation Standard.
- Statistics Netherlands. (2026, April 3). The Netherlands is the world’s leading exporter of cocoa products.
- USA Food and Drug Administration. (2025, August 6). Requirements for Additional Traceability Records for Certain Foods: Compliance Date Extension RIA (Proposed Rule).
- Department for Environment, Food & Rural Affairs. (2026, March 9). UK-EU SPS Agreement - Legislation in scope.
- French Ministry for Ecological Transition. (2026, July 13). The European Deforestation-free Regulation (EUDR).
- Bundesministerium für Landwirtschaft, Ernährung und Heimat. (2025, May 14). EU-weit einheitliche Regelung für entwaldungsfreie Lieferketten.
- iFoodDS. (2026, May 28). Markem-Imaje and iFoodDS Partner to Simplify FSMA 204 Traceability Compliance for Food Suppliers.
- Trustwell. (2025, February 19). Trustwell Expands FSMA 204 Traceability Connections with 2,000 New Suppliers added to Platform, Bringing Total Supplier Network to Nearly 25,000.
- Sourcemap. (2025, March 19). EUDR milestone: Sourcemap goes live with EU TRACES and SAP integrations.
- TraceX Technologies. (2025, September 25). ERP Integration for EUDR Compliance: How to Ensure Audit-Proof DDS Filing.
- osapiens. (2025, September 2). osapiens and IFS help companies comply with the EU Deforestation Regulation.
- IntegrityNext. (2025, April 2). IntegrityNext Launches Enhanced EUDR Solution for Automated Due Diligence.
This bibliography is provided for reader reference and is not exhaustive. The full report contains the complete reference list and detailed citations
This Report Answers
- What is the market size in 2026 and 2036?
- Which regulatory duties turn traceability records into recurring software work?
- Why does traceability lead the solution category in 2026?
- Why does cocoa concentrate demand for origin and due-diligence workflows?
- Why do food manufacturers hold the largest end-user share?
- How do the profiled country growth rates differ?
- How do current providers differ across traceability and assurance capabilities?
- How do first-mile data gaps affect implementation cost and timing?
Frequently Asked Questions
How big is the Food Supply Chain Traceability & Compliance Software Market in 2026?
The food supply chain traceability & compliance software market is valued at USD 5.8 billion in 2026 and is projected to reach USD 21.3 billion by 2036. Growth follows recurring recordkeeping and supplier-data requirements across regulated food supply chains.
What is the CAGR of the Food Supply Chain Traceability & Compliance Software Market from 2026 to 2036?
The food supply chain traceability & compliance software market is projected to grow at a CAGR of 13.9% between 2026 and 2036. Expansion reflects demand for structured lot, origin and compliance records across trading partners.
Which solution leads the Food Supply Chain Traceability & Compliance Software Market?
Traceability is projected to account for 41.9% of the market in 2026. Shared event records support recall readiness and downstream compliance work across food supply chains.
Which commodity dominates the Food Supply Chain Traceability & Compliance Software Market?
Cocoa is projected to account for 47.9% of the market in 2026. Repeated origin handoffs create a strong need for defensible traceability records before regulated market entry.
Which companies are active in the Food Supply Chain Traceability & Compliance Software Market?
Key companies include FoodChain ID, iFoodDS, Trustwell, Sourcemap, TraceX, osapiens, Intertek and IntegrityNext. They compete through food compliance tools, lot-level tracing and origin due-diligence workflows.
Preview the report firsthand - request a free sample
Get SampleGet the brochure for pricing and purchase details.
Get PDFTable of Content
- Key Takeaways
- Market Size and CAGR
- Top Growth Driver
- Fastest Growing Segment
- Leading Region
- Key Companies
- Emerging Opportunities
- Executive Summary
- Global Market Outlook
- Demand-side Trends
- Supply-side Trends
- Technology Roadmap Analysis
- Analysis and Recommendations
- Analyst Perspective (What is happening? Why now? What should investors know?)
- Key Questions Answered
- How large is the market?
- What is the CAGR?
- What are key trends?
- Which region dominates?
- Who are the leaders?
- Market Overview
- Market Coverage / Taxonomy
- Market Definition / Scope / Limitations
- Research Methodology
- Chapter Orientation
- Analytical Lens and Working Hypotheses
- Market Structure, Signals, and Trend Drivers
- Benchmarking and Cross-market Comparability
- Market Sizing, Forecasting, and Opportunity Mapping
- Research Design and Evidence Framework
- Desk Research Programme (Secondary Evidence)
- Expert Input and Fieldwork (Primary Evidence)
- Tooling, Models, and Reference Databases
- Data Engineering and Model Build
- Quality Assurance and Audit Trail
- Market Background
- Market Dynamics (Drivers, Restraints, Opportunity, Trends)
- Scenario Forecast (Optimistic, Likely, Conservative)
- Impact Analysis
- AI Impact
- Sustainability Impact
- Regulatory Impact
- Technology Impact
- Consumer / Buyer Analysis
- Purchase Drivers
- Adoption Barriers
- Buyer Journey
- Opportunity Map Analysis
- Product Life Cycle Analysis
- Supply Chain Analysis
- Investment Feasibility Matrix
- Value Chain Analysis
- PESTLE and Porter's Analysis
- Regulatory Landscape
- Regional Parent Market Outlook
- Production and Consumption Statistics
- Import and Export Statistics
- Global Market Analysis and Forecast, 2021 to 2036
- Historical Market Size Value (USD Billion) Analysis, 2021 to 2025
- Current and Future Market Size Value (USD Billion) Projections, 2026 to 2036
- Y-o-Y Growth Trend Analysis
- Absolute $ Opportunity Analysis
- Global Market Pricing Analysis, 2021 to 2036
- Global Market Analysis and Forecast, By Solution, 2021 to 2036
- Introduction / Key Findings
- Historical Market Size Value (USD Billion) Analysis By Solution, 2021 to 2025
- Current and Future Market Size Value (USD Billion) Analysis and Forecast By Solution, 2026 to 2036
- Traceability
- EUDR/Deforestation Compliance
- Blockchain
- MRV
- Traceability
- Y-o-Y Growth Trend Analysis By Solution, 2021 to 2025
- Absolute $ Opportunity Analysis By Solution, 2026 to 2036
- Global Market Analysis and Forecast, By Commodity, 2021 to 2036
- Introduction / Key Findings
- Historical Market Size Value (USD Billion) Analysis By Commodity, 2021 to 2025
- Current and Future Market Size Value (USD Billion) Analysis and Forecast By Commodity, 2026 to 2036
- Cocoa
- Coffee
- Palm
- Soy
- Cocoa
- Y-o-Y Growth Trend Analysis By Commodity, 2021 to 2025
- Absolute $ Opportunity Analysis By Commodity, 2026 to 2036
- Global Market Analysis and Forecast, By End User, 2021 to 2036
- Introduction / Key Findings
- Historical Market Size Value (USD Billion) Analysis By End User, 2021 to 2025
- Current and Future Market Size Value (USD Billion) Analysis and Forecast By End User, 2026 to 2036
- Food Manufacturers
- Foodservice Operators
- Retailers
- Household
- Food Manufacturers
- Y-o-Y Growth Trend Analysis By End User, 2021 to 2025
- Absolute $ Opportunity Analysis By End User, 2026 to 2036
- Global Market Analysis and Forecast, By Region, 2021 to 2036
- Introduction
- Historical Market Size Value (USD Billion) Analysis By Region, 2021 to 2025
- Current Market Size Value (USD Billion) Analysis and Forecast By Region, 2026 to 2036
- North America
- Latin America
- Western Europe
- Eastern Europe
- East Asia
- South Asia and Pacific
- Middle East & Africa
- Market Attractiveness Analysis By Region
- North America Market Analysis and Forecast, By Country, 2021 to 2036
- Historical Market Size Value (USD Billion) Trend Analysis By Market Taxonomy, 2021 to 2025
- Market Size Value (USD Billion) Forecast By Market Taxonomy, 2026 to 2036
- By Country
- USA
- Canada
- By Solution
- By Commodity
- By End User
- By Country
- Market Attractiveness Analysis
- By Country
- By Solution
- By Commodity
- By End User
- Key Takeaways
- Latin America Market Analysis and Forecast, By Country
- Historical Market Size Value (USD Billion) Trend Analysis By Market Taxonomy, 2021 to 2025
- Market Size Value (USD Billion) Forecast By Market Taxonomy, 2026 to 2036
- By Country
- Brazil
- Mexico
- Chile
- Rest of Latin America
- By Solution
- By Commodity
- By End User
- By Country
- Market Attractiveness Analysis
- By Country
- By Solution
- By Commodity
- By End User
- Key Takeaways
- Western Europe Market Analysis and Forecast, By Country
- Historical Market Size Value (USD Billion) Trend Analysis By Market Taxonomy, 2021 to 2025
- Market Size Value (USD Billion) Forecast By Market Taxonomy, 2026 to 2036
- By Country
- Germany
- UK
- Italy
- Spain
- France
- Nordic
- BENELUX
- Rest of Western Europe
- By Solution
- By Commodity
- By End User
- By Country
- Market Attractiveness Analysis
- By Country
- By Solution
- By Commodity
- By End User
- Key Takeaways
- Eastern Europe Market Analysis and Forecast, By Country
- Historical Market Size Value (USD Billion) Trend Analysis By Market Taxonomy, 2021 to 2025
- Market Size Value (USD Billion) Forecast By Market Taxonomy, 2026 to 2036
- By Country
- Russia
- Poland
- Hungary
- Balkan & Baltic
- Rest of Eastern Europe
- By Solution
- By Commodity
- By End User
- By Country
- Market Attractiveness Analysis
- By Country
- By Solution
- By Commodity
- By End User
- Key Takeaways
- East Asia Market Analysis and Forecast, By Country
- Historical Market Size Value (USD Billion) Trend Analysis By Market Taxonomy, 2021 to 2025
- Market Size Value (USD Billion) Forecast By Market Taxonomy, 2026 to 2036
- By Country
- China
- Japan
- South Korea
- By Solution
- By Commodity
- By End User
- By Country
- Market Attractiveness Analysis
- By Country
- By Solution
- By Commodity
- By End User
- Key Takeaways
- South Asia and Pacific Market Analysis and Forecast, By Country
- Historical Market Size Value (USD Billion) Trend Analysis By Market Taxonomy, 2021 to 2025
- Market Size Value (USD Billion) Forecast By Market Taxonomy, 2026 to 2036
- By Country
- India
- ASEAN
- Australia & New Zealand
- Rest of South Asia and Pacific
- By Solution
- By Commodity
- By End User
- By Country
- Market Attractiveness Analysis
- By Country
- By Solution
- By Commodity
- By End User
- Key Takeaways
- Middle East & Africa Market Analysis and Forecast, By Country
- Historical Market Size Value (USD Billion) Trend Analysis By Market Taxonomy, 2021 to 2025
- Market Size Value (USD Billion) Forecast By Market Taxonomy, 2026 to 2036
- By Country
- Kingdom of Saudi Arabia
- Other GCC Countries
- Türkiye
- South Africa
- Other African Union
- Rest of Middle East & Africa
- By Solution
- By Commodity
- By End User
- By Country
- Market Attractiveness Analysis
- By Country
- By Solution
- By Commodity
- By End User
- Key Takeaways
- Key Countries Market Analysis
- USA
- Pricing Analysis
- Market Share Analysis, 2025
- By Solution
- By Commodity
- By End User
- Canada
- Pricing Analysis
- Market Share Analysis, 2025
- By Solution
- By Commodity
- By End User
- Mexico
- Pricing Analysis
- Market Share Analysis, 2025
- By Solution
- By Commodity
- By End User
- Brazil
- Pricing Analysis
- Market Share Analysis, 2025
- By Solution
- By Commodity
- By End User
- Chile
- Pricing Analysis
- Market Share Analysis, 2025
- By Solution
- By Commodity
- By End User
- Germany
- Pricing Analysis
- Market Share Analysis, 2025
- By Solution
- By Commodity
- By End User
- UK
- Pricing Analysis
- Market Share Analysis, 2025
- By Solution
- By Commodity
- By End User
- Italy
- Pricing Analysis
- Market Share Analysis, 2025
- By Solution
- By Commodity
- By End User
- Spain
- Pricing Analysis
- Market Share Analysis, 2025
- By Solution
- By Commodity
- By End User
- France
- Pricing Analysis
- Market Share Analysis, 2025
- By Solution
- By Commodity
- By End User
- India
- Pricing Analysis
- Market Share Analysis, 2025
- By Solution
- By Commodity
- By End User
- ASEAN
- Pricing Analysis
- Market Share Analysis, 2025
- By Solution
- By Commodity
- By End User
- Australia & New Zealand
- Pricing Analysis
- Market Share Analysis, 2025
- By Solution
- By Commodity
- By End User
- China
- Pricing Analysis
- Market Share Analysis, 2025
- By Solution
- By Commodity
- By End User
- Japan
- Pricing Analysis
- Market Share Analysis, 2025
- By Solution
- By Commodity
- By End User
- South Korea
- Pricing Analysis
- Market Share Analysis, 2025
- By Solution
- By Commodity
- By End User
- Russia
- Pricing Analysis
- Market Share Analysis, 2025
- By Solution
- By Commodity
- By End User
- Poland
- Pricing Analysis
- Market Share Analysis, 2025
- By Solution
- By Commodity
- By End User
- Hungary
- Pricing Analysis
- Market Share Analysis, 2025
- By Solution
- By Commodity
- By End User
- Kingdom of Saudi Arabia
- Pricing Analysis
- Market Share Analysis, 2025
- By Solution
- By Commodity
- By End User
- Türkiye
- Pricing Analysis
- Market Share Analysis, 2025
- By Solution
- By Commodity
- By End User
- South Africa
- Pricing Analysis
- Market Share Analysis, 2025
- By Solution
- By Commodity
- By End User
- USA
- Market Structure Analysis
- Competition Dashboard
- Competition Benchmarking
- Market Share Analysis of Top Players
- By Regional
- By Solution
- By Commodity
- By End User
- Emerging Startups
- Innovation Benchmarking
- Competition Analysis
- Competition Deep Dive
- SGS
- Overview
- Product Portfolio
- Profitability by Market Segments
- Sales Footprint
- Strategy Overview
- Marketing Strategy
- Product Strategy
- Channel Strategy
- Bureau Veritas
- Intertek
- FoodChain ID
- IBM Food Trust
- Sourcemap
- TraceX
- Optel
- SGS
- Case Studies
- Success Stories
- Recent Developments
- Competition Deep Dive
- Assumptions & Acronyms Used


