

- Market Size (2026)
- USD 39.8 Bn
- Forecast (2036)
- USD 209.9 Bn
- CAGR (2026 to 2036)
- 18.1%
Geoengineering Market Size, Market Forecast and Outlook By FMI
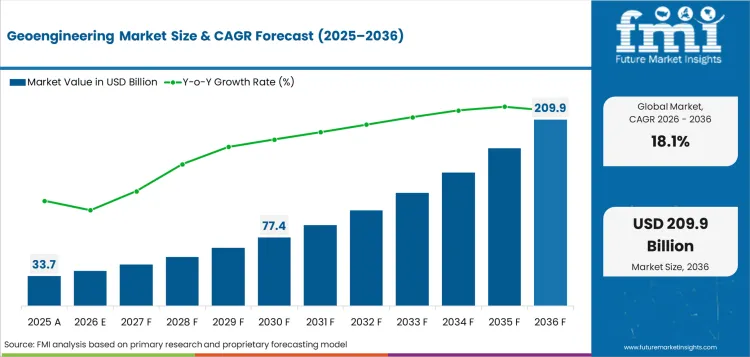
The geoengineering market was valued at USD 33.7 billion in 2025. The market is set to reach USD 39.8 billion by 2026-end and grow at a CAGR of 18.1% between 2026-2036 to reach USD 209.9 billion by 2036. Carbon Dioxide Removal will dominate with a 57.3% share, while Air will lead with a 36.5% share.
Summary of the Geoengineering Market
- Demand and Growth Drivers
- Demand is shaped by increasing adoption of geoengineering solutions across core end-use industries, with procurement patterns shifting toward higher-specification and compliance-driven products.
- Regulatory frameworks and sustainability mandates are accelerating the transition from conventional alternatives, creating structured demand across both developed and emerging markets.
- Growth reflects expansion in downstream applications, supported by technology upgrades and increasing integration of geoengineering in established supply chains.
- Product and Segment View
- Carbon Dioxide Removal is anticipated to hold 57.3% share of the type segment in 2026, supported by stable procurement cycles and performance requirements.
- Air makes up 36.5% of the planetary ecosystem segment, which reflects targeted demand from existing buyer groups.
- Increased adoption is driven by performance benchmarking and life cycle cost benefits over the conventional alternatives.
- Geography and Competitive Outlook
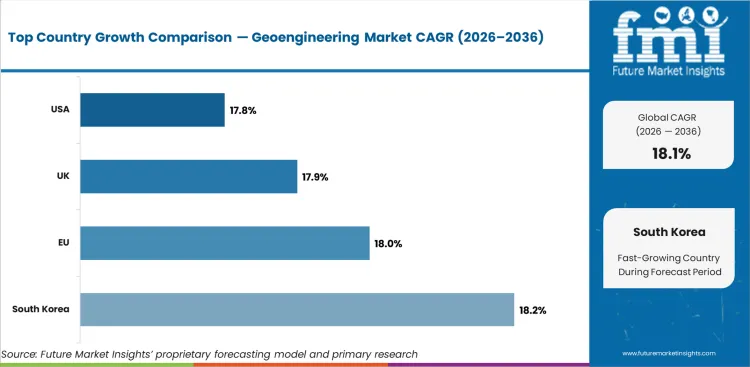
- South Korea is expected to lead global demand at 18.2% CAGR, supported by capacity expansion and policy alignment.
- EU is projected to grow at 18% CAGR, reflecting strong institutional and commercial adoption.
- Companies that combine production scale, distribution reach, and compliance capabilities are expected to consolidate market position over the forecast period.
- Analyst Opinion
- The geoengineering market is transitioning from a fragmented supply landscape to a more structured procurement environment where compliance, cost efficiency, and supply reliability define competitive positioning.
- Adoption is growing as geoengineering expands to both established and new use cases and as regulatory frameworks become more stringent.
- Input cost movements, regional capacity utilization and the trade-off between premium and commodity tiers continue to drive prices.
- The companies investing in capacity expansion, securing supply chain partnerships and fulfilling regional compliance requirements are poised to grab disproportionate share in the forecast period of 2026 to 2036.
Key Takeaways, Market Size, and Forecast
- The geoengineering market was valued at USD 33.67 billion in 2025.
- By 2036, the Geoengineering Market is expected to be worth USD 209.92 billion.
- From 2026 to 2036, the market is projected to expand at a CAGR of 18.1%.
- The market is projected to create an incremental opportunity of USD 170.15 billion between 2026 and 2036.
- In 2026, carbon dioxide removal is expected to account for 57.3% of the type segment, driven by sustained demand across primary end-use applications.
- South Korea (18.2%) and EU (18%) are two of the fastest growing markets in the world.
Geoengineering Market Definition
The geoengineering market encompasses all commercially traded products and services classified under geoengineering, including products segmented by type, planetary ecosystem, industry, and spanning applications across multiple industries and regions. The market covers the forecast period from 2026 to 2036.
Geoengineering Market Inclusions
Market scope encompasses all commercially traded geoengineering products categorized by type (Carbon Dioxide Removal, Solar Radiation Management); planetary ecosystem (Air, Land, Water); industry (Energy & Utilities, IT & Telecommunication, Manufacturing, Government, Oil & Gas, Others); technology (Atmospheric Engineering Technologies, Carbon Capture Technologies, Biological Carbon Sequestration Technologies, Climate Modeling Technologies); pricing model (Project Based Funding, Carbon Credit Based Funding). The range of revenue sizes is from 2026 to 2036.
Geoengineering Market Exclusions
The scope does not include products that fall outside the defined segmentation taxonomy, raw materials traded as intermediate inputs without processing, or adjacent product categories that do not directly compete within the geoengineering classification.
Geoengineering Market Research Methodology
- Primary Research: FMI analysts conducted interviews with manufacturers, distributors, procurement specialists, and end-use industry participants across key markets.
- Desk Research: Combined data from industry associations, regulatory filings, trade databases, and manufacturer disclosures.
- Market sizing and forecasting: Bottom-up aggregation across segments and regions, calibrated with regional adoption curves and procurement data.
- Data validation: Cross-checked quarterly against production statistics, trade data, and manufacturer-reported figures.
Why is the Geoengineering Market Growing?
- Demand is being driven by increasingly stringent regulatory standards and the move to higher-specification products in some of its key industries, creating structured replacement and upgrade cycles.
- Growth is driven by penetration growth in emerging markets, where investments in infrastructure and industrialization are speeding up procurement.
- South Korea is the fastest growing with 18.2% growth rate driven by capacity expansion and policy level support for geoengineering adoption
The geoengineering market is growing as end-use industries focus on compliance, consistent performance and supply chain reliability. The way companies buy is changing-from buying on price and moving from supplier to supplier, to buying to specification and signing long-term contracts. This shift favors suppliers with existing quality systems, regulatory clearances and multi-region distribution infrastructure. The resulting market structure favors scale, technical capability, and closeness to demand centers.
Prices remain subject to volatility in input costs, levels of capacity utilization and the competitive dynamics between integrated players and smaller regional suppliers. Higher margins and more predictable demand are found in premium segments with regulatory requirements or performance standards. Some commodity segments are facing margin pressure due to overcapacity in certain regions and price competition from low-cost producers.
Supply concentration is a structural risk. Reliance on certain raw materials, production sites or regulatory environments leads to risk of disruption. Diversified sourcing, backward integration, or strategic inventory positions better position companies to preserve supply continuity and protect margins in the face of rising input costs.
Market Segmentation Analysis
- The type segment is led by Carbon Dioxide Removal, accounting for 57.3% of the market share due to well-defined procurement and specification trends.
- The planetary ecosystem segment is led by air, which accounts for 36.5%, with demand concentrated among primary buyer groups.
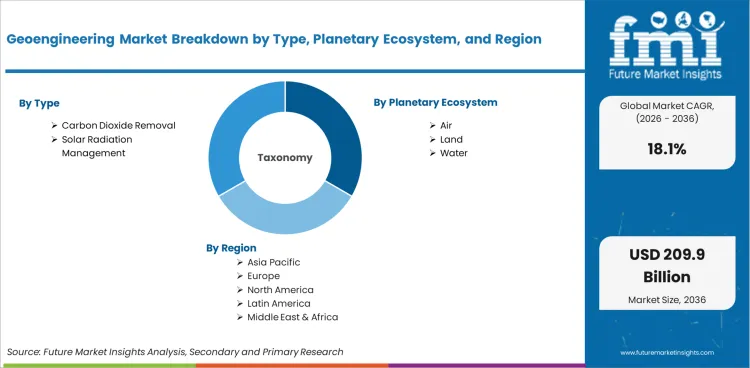
- The market has been segmented on the basis of type, planetary ecosystem, industry, technology and pricing model. Each of these segments have been analyzed with respect to market trend, drivers and challenges.
The geoengineering market is segmented on the basis of Type, Planetary Ecosystem, Industry, Technology, Pricing Model. Every dimension has its own buyer behavior, pricing dynamics and growth characteristics.
Insights into the Carbon Dioxide Removal Segment
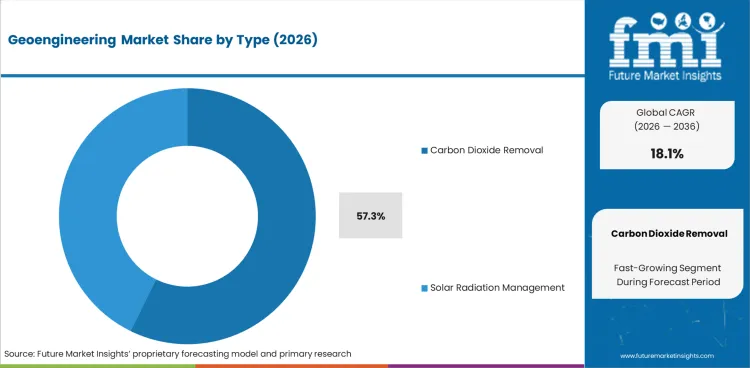
By 2026, carbon dioxide removal will constitute 57.3% of the type segment. Demand is concentrated and driven by established buyer groups with defined specification requirements and recurring procurement cycles. Growth is buoyed by both replacement demand and new capacity additions in key regions.
Insights into the Air Segment
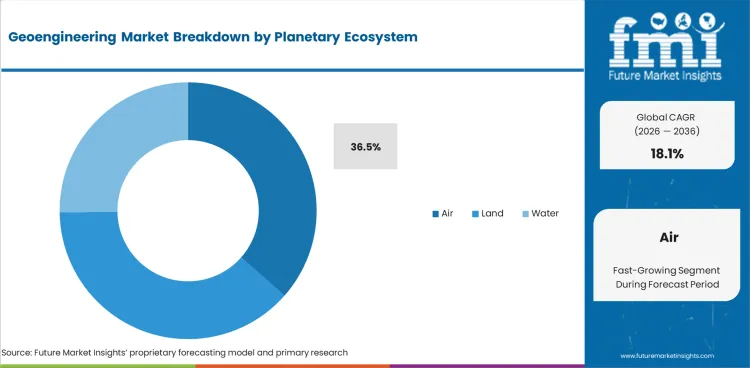
Air makes up 36.5% of the planetary ecosystem sector. The adoption of these is increasing on operational needs, compliance requirements and lifecycle cost benefits of higher specification products as compared to conventional ones.
Geoengineering Market Drivers, Restraints, and Opportunities
- Structured demand for higher-specification geoengineering products is being driven by regulatory compliance and performance standardization across key end-use industries.
- Growth is concentrated in the regulated and premium segments, with cost premiums relative to conventional alternatives restricting adoption in price sensitive commodity applications.
- Emerging market infrastructure expansion and industrial modernization programs are opening up new procurement channels with long-term volume potential.
The convergence of regulatory tightening, technological advancement and changing procurement patterns in end-use industries are driving the geoengineering market. Demand is focused on segments where compliance, performance, or sustainability needs create structured demand and barriers to substitution.
Regulatory and Compliance-led Demand
Regulatory frameworks are tightening in key geographies, influencing demand. Procurement is shifting from discretionary to mandatory in regulated industries due to compliance mandates, creating a baseline demand that is less sensitive to economic cycles.
Cost and Scalability Constraints
Cost premiums are a barrier to adoption in price sensitive applications. The economics of production favors large scale producers with integrated supply chains. There is margin pressure from input cost volatility and limited pricing power for smaller producers.
Infrastructure Expansion in Emerging Markets
Growth is a sign of investment in infrastructure and industrialization in emerging economies. Government procurement programs and industrial modernization initiatives are creating new demand channels backed by multi-year volume commitments.
Technology Upgrade Cycles
As legacy systems approach end-of-life and next-generation specs require upgraded components, demand for replacements is gaining momentum. Technology transition cycles create concentrated procurement windows that tend to favor suppliers with inventory on hand and established qualification.
Analysis of Geoengineering Market By Key Countries
| Country | CAGR |
|---|---|
| South Korea | 18.2% |
| EU | 18.0% |
| UK | 17.9% |
| USA | 17.8% |
- South Korea at 18.2% CAGR reflects Korean government climate technology investment, KAIST and KIST research programs in carbon capture, and Korean industrial conglomerate participation in carbon dioxide removal projects.
- The EU at 18.0% CAGR is supported by European Green Deal carbon removal targets, Climeworks and European DAC (Direct Air Capture) technology leadership, and EU Innovation Fund and Horizon Europe geoengineering research investment.
- The UK at 17.9% CAGR is shaped by UK Net Zero Strategy carbon removal requirements, UK BECCS and DAC project development, and UK research council funding for geoengineering science and governance.
- The USA at 17.8% CAGR is driven by DOE carbon removal shot initiative, 45Q tax credit incentives for carbon capture, and venture capital investment in DAC, enhanced weathering, and ocean-based CDR startups.
The geoengineering market is projected to expand at a CAGR of 18.1% from 2026 to 2036, with growth shaped by national net-zero commitment implementation requiring engineered carbon removal, carbon dioxide removal at 57.3% type share reflecting policy and investment focus on CDR over solar radiation management, voluntary carbon market demand for high-quality removal credits, and government R&D investment in geoengineering technology maturation.
Demand Outlook for Geoengineering Market in South Korea
South Korea is anticipated to grow at 18.2% CAGR during forecast period, owing to Korean 2050 carbon neutrality commitment, government climate technology investment and Korean industrial participation in carbon capturing and storage projects.
- The Korean government’s 2050 Carbon Neutrality Strategy includes a CCUS (Carbon Capture, Utilization, and Storage) roadmap with public investment in the development of capture technologies, CO2 transport infrastructure, and the characterization of geological storage sites.
- KAIST, KIST and Korean university research programs are working on new CO2 capture sorbents, electrochemical capture systems and enhanced weathering approaches, with government funding via the Korean National Research Foundation.
- Korean industrial conglomerates (SK Innovation, POSCO, Hyundai) are investing in carbon capture technology to decarbonize steel, petrochemical, and cement manufacturing, with SK’s net-zero pledge driving the development of internal CCUS projects.
Future Outlook for Geoengineering Market in EU
Growth is projected at 18.0% CAGR through 2036, spurred by the European Green Deal CDR goals, the scaling of Climeworks technology, and EU funding mechanisms for the deployment of geoengineering.
- Engineered CDR needs to be deployed at scale, given the carbon removal targets in the European Commission’s Industrial Carbon Management Strategy. The development of a regulatory framework for carbon removal certification (EU CRC Framework) builds market structure
- Climeworks (Zurich) operates the world’s largest direct air capture facility (Mammoth, Iceland) and develops next-generation DAC technology with European and US scaling roadmaps, anchoring European CDR technology leadership
- The EU Innovation Fund and Horizon Europe are investing billions of euros in developing carbon capture and removal technology, supporting projects covering DAC, BECCS, enhanced weathering and ocean alkalinity enhancement.
Opportunity Analysis of Geoengineering Market in UK
The UK is expected to grow at 17.9% CAGR through 2036 owing to the UK net-zero legal requirement, BECCS and DAC project pipeline development and UK research leadership in geoengineering science and governance.
- The UK Climate Change Act has a legally binding net-zero target for 2050 and the Climate Change Committee pathway analysis and the government’s Greenhouse Gas Removal programme funds the development of technology to achieve that.
- The Drax Group BECCS project in North Yorkshire is the UK’s largest proposed carbon removal facility, combining biomass power generation with carbon capture and storage underground in the North Sea.
- UK research institutions (Oxford, Cambridge, Imperial) are at the forefront of global research on geoengineering governance. UK NERC and EPSRC research funding programmes are supporting the development of carbon removal technologies and the assessment of SRM (Solar Radiation Management) research.
In-depth Analysis of Geoengineering Market in USA
The US is forecast to grow at 17.8% CAGR through 2036, driven by DOE Carbon Negative Shot initiative, expansion of 45Q tax credit incentive and venture capital investment in CDR technology startups.
- The DOE Carbon Negative Shot aims for CDR below USD 100/t by 2032. The DAC Hub program funds four regional direct air capture hubs (including Occidental/1PointFive in Texas) at billion dollar scale.
- IRA Section 45Q provides the most generous fiscal incentive in the world for engineered carbon removal project development and investment, with tax credits up to USD 180 per tonne for direct air capture with geological storage.
- Venture capital investment in US CDR startups (Heirloom Carbon, CarbonCapture Inc., Running Tide, Vesta enhanced weathering) is larger than all other geographies combined, with California and Texas as CDR technology development clusters.
Competitive Landscape and Strategic Positioning
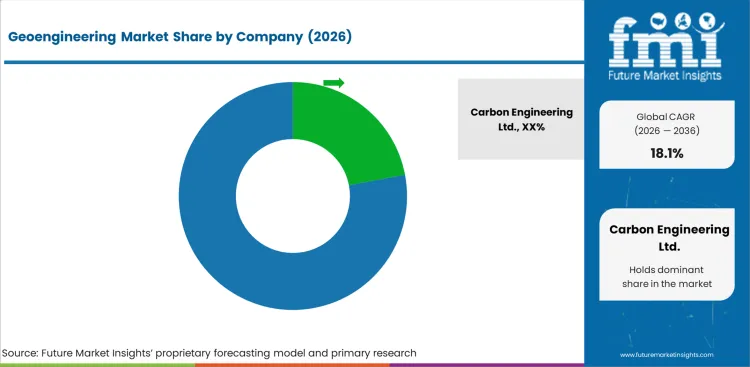
- Carbon Engineering Ltd. holds a strong market position supported by integrated production capability and global distribution infrastructure.
- Mid-tier and regional players compete on specialization, local compliance expertise, and proximity to demand centers.
- New entrants are targeting niche applications and underserved geographies with focused product portfolios.
Carbon Engineering Ltd. maintains a strong competitive position through integrated manufacturing, established buyer relationships, and broad product coverage. Climeworks AG and Global Thermostat offer complementary capabilities across product categories and geographies.
Barriers to entry include established supply chain relationships, regulatory qualification requirements, production scale economics, and the capital intensity of manufacturing infrastructure. Strategic priorities for market participants include cost optimization, geographic expansion, and compliance with evolving regulatory standards.
Key Companies in the Geoengineering Market
Key global companies leading the geoengineering market include:
- Carbon Engineering Ltd., Climeworks AG, Global Thermostat, SRM Technologies maintain strong market positions through integrated manufacturing infrastructure, established buyer relationships, and broad product portfolios.
- Ocean Nourishment Corporation, NASA & Government Agencies, The Gates Foundation have established regional presence through specialization in specific product categories and proximity to key demand centers.
- MIT Climate Science Research, Harvard University’s Solar, Private Climate Tech Startups represent emerging competitors targeting niche applications and underserved segments with focused product development and agile market entry strategies.
Competitive Benchmarking: Geoengineering Market
| Company | Product Breadth | Technology Capability | Distribution Reach | Geographic Footprint |
|---|---|---|---|---|
| Carbon Engineering Ltd. | High | High | Strong | Global |
| Climeworks AG | High | High | Strong | Global |
| Global Thermostat | High | High | Strong | Global |
| SRM Technologies | Medium | High | Moderate | Multi-region |
| Ocean Nourishment Corporation | Medium | Medium | Moderate | Multi-region |
| NASA & Government Agencies | Medium | Medium | Moderate | Multi-region |
| The Gates Foundation | Low | Medium | Moderate | Regional |
| MIT Climate Science Research | Low | Medium | Low | Regional |
| Harvard University’s Solar | Low | Medium | Low | Regional |
| Private Climate Tech Startups | Low | Medium | Low | Regional |
Source: Future Market Insights competitive analysis, 2026.
Key Developments in Geoengineering Market
- In 2025, Carbon Engineering Ltd. (through Occidental Petroleum and 1PointFive) advanced its Direct Air Capture (DAC) technology deployment with the STRATOS plant in Texas progressing toward commercial operations to support large-scale carbon removal in North America.
- In 2025, Climeworks AG raised USD 162 million in equity funding, the largest carbon removal investment of the year, to scale up its Direct Air Capture technology and support growing demand from industrial and commercial end-use segments.
Key Players in the Geoengineering Market
Major Global Players
- Carbon Engineering Ltd.
- Climeworks AG
- Global Thermostat
- SRM Technologies
- Ocean Nourishment Corporation
- NASA & Government Agencies
- The Gates Foundation
Emerging Players/Startups
- MIT Climate Science Research
- Harvard University’s Solar
- Private Climate Tech Startups
Report Scope and Coverage
| Parameter | Details |
|---|---|
| Quantitative Units | USD 39.77 billion to USD 209.92 billion, at a CAGR of 18.1% |
| Market Definition | The geoengineering market encompasses geoengineering products and services across all commercially relevant categories, including segmentation by type, planetary ecosystem, industry. |
| Regions Covered | North America, Latin America, Europe, East Asia, South Asia and Pacific, Middle East and Africa |
| Countries Covered | South Korea, EU, UK, USA, 30 plus countries |
| Key Companies Profiled | Carbon Engineering Ltd., Climeworks AG, Global Thermostat, SRM Technologies, Ocean Nourishment Corporation, NASA & Government Agencies, The Gates Foundation, MIT Climate Science Research, Harvard University’s Solar, Private Climate Tech Startups |
| Forecast Period | 2026 to 2036 |
| Approach | Hybrid bottom-up and top-down methodology starting with verified transaction data, projecting adoption velocity across segments and regions. |
Segmentation
Geoengineering Market Segmented by Type:
- Carbon Dioxide Removal
- Solar Radiation Management
Geoengineering Market Segmented by Planetary Ecosystem:
- Air
- Land
- Water
Geoengineering Market Segmented by Industry:
- Energy & Utilities
- IT & Telecommunication
- Manufacturing
- Government
- Oil & Gas
- Others
Geoengineering Market Segmented by Technology:
- Atmospheric Engineering Technologies
- Chemical Aerosol Engineering Systems
- Radiative Forcing Control Systems
- Carbon Capture Technologies
- Solvent Based Capture Systems
- Membrane Based Capture Systems
- Biological Carbon Sequestration Technologies
- Soil Enhancement Technologies
- Marine Ecosystem Engineering Systems
- Climate Modeling Technologies
- Supercomputing Climate Simulation Models
- AI Driven Climate Prediction Systems
Geoengineering Market Segmented by Pricing Model:
- Project Based Funding
- Government Grants
- Private Sector Investment
- Public Private Partnerships
- Carbon Credit Based Funding
- Regulated Carbon Offset Markets
- Voluntary Carbon Markets
Geoengineering Market by Region:
- North America
- USA
- Canada
- Mexico
- Latin America
- Brazil
- Chile
- Rest of Latin America
- Western Europe
- Germany
- UK
- Italy
- Spain
- France
- Nordic
- BENELUX
- Rest of Western Europe
- Eastern Europe
- Russia
- Poland
- Hungary
- Balkan & Baltic
- Rest of Eastern Europe
- East Asia
- China
- Japan
- South Korea
- South Asia and Pacific
- India
- ASEAN
- Australia & New Zealand
- Rest of South Asia and Pacific
- Middle East & Africa
- Kingdom of Saudi Arabia
- Other GCC Countries
- Turkiye
- South Africa
- Other African Union
- Rest of Middle East & Africa
Research Sources and Bibliography
- 1. World Bank. (2025). World Development Indicators: Industrial Production and Trade Statistics. World Bank Group.
- 2. International Organization for Standardization. (2025). ISO Standards Catalogue: Industry-Specific Compliance Frameworks. ISO.
- 3. United Nations Industrial Development Organization. (2025). UNIDO Industrial Statistics Database. UNIDO.
- 4. USA Bureau of Labor Statistics. (2025). Producer Price Index: Manufacturing Sector. BLS.
- 5. European Commission. (2025). EU Industrial Strategy: Regulatory Compliance and Market Access Framework. EC.
This bibliography is provided for reader reference. The full Future Market Insights report contains the complete reference list with publication dates, URLs, and supporting data for all cited works.
This Report Answers
- Estimating the size of the market and revenue trajectory from 2026 to 2036.
- Segmentation analysis by type, planetary ecosystem, industry, technology, pricing model.
- Regional insights covering more than 30 markets.
- Competitive landscape assessment and company benchmarking.
- Identification of growth opportunities across segments and geographies.
- Supply chain and procurement structure analysis.
- Technology and regulatory trend assessment.
- Delivery of data in PDF and Excel formats.
Frequently Asked Questions
What is the global market demand for Geoengineering Market in 2026?
In 2026, the global geoengineering market is expected to be worth USD 39.77 billion.
How big will the market for Geoengineering Market be in 2036?
By 2036, the geoengineering market is expected to be worth USD 209.92 billion.
How much is demand for Geoengineering Market expected to grow between 2026 and 2036?
Between 2026 and 2036, the demand for geoengineering market is expected to grow at a CAGR of 18.1%.
Which Type segment is expected to lead in the Geoengineering Market in 2026?
Carbon Dioxide Removal is expected to account for 57.3% of the type segment in the Geoengineering Market in 2026, reflecting sustained demand from primary end-use applications.
What is driving demand in South Korea for the Geoengineering Market?
South Korea is projected to grow at 18.2% CAGR through 2036 in the Geoengineering Market, supported by industrial capacity expansion, regulatory compliance requirements, and sustained procurement growth.
What is driving demand in EU for the Geoengineering Market?
EU is projected to grow at 18% CAGR through 2036 in the Geoengineering Market, reflecting strong institutional and commercial adoption across core end-use industries.
What does this report mean by Geoengineering Market definition?
The geoengineering market encompasses all commercially traded products and services classified under geoengineering, segmented by type, planetary ecosystem, industry, covering the 2026 to 2036 forecast period.
How does FMI make the Geoengineering Market forecast and verify it?
Forecasting models use a hybrid bottom-up and top-down approach, starting with verified transaction data and checking it against production statistics and manufacturer disclosures.
Preview the report firsthand - request a free sample
Get SampleGet the brochure for pricing and purchase details.
Get PDFTable of Content
- Executive Summary
- Global Market Outlook
- Demand-side Trends
- Supply-side Trends
- Technology Roadmap Analysis
- Analysis and Recommendations
- Market Overview
- Market Coverage / Taxonomy
- Market Definition / Scope / Limitations
- Research Methodology
- Chapter Orientation
- Analytical Lens and Working Hypotheses
- Market Structure, Signals, and Trend Drivers
- Benchmarking and Cross-market Comparability
- Market Sizing, Forecasting, and Opportunity Mapping
- Research Design and Evidence Framework
- Desk Research Programme (Secondary Evidence)
- Company Annual and Sustainability Reports
- Peer-reviewed Journals and Academic Literature
- Corporate Websites, Product Literature, and Technical Notes
- Earnings Decks and Investor Briefings
- Statutory Filings and Regulatory Disclosures
- Technical White Papers and Standards Notes
- Trade Journals, Industry Magazines, and Analyst Briefs
- FMI Internal Proprietary Databases and Historical Market Datasets
- Subscription Datasets and Paid Sources
- Social Channels, Communities, and Digital Listening Inputs
- Additional Desk Sources
- Expert Input and Fieldwork (Primary Evidence)
- Primary Modes
- Qualitative Interviews and Expert Elicitation
- Quantitative Surveys and Structured Data Capture
- Blended Approach
- Why Primary Evidence is Used
- Field Techniques
- Interviews
- Surveys
- Focus Groups
- Observational and In-context Research
- Social and Community Interactions
- Stakeholder Universe Engaged
- C-suite Leaders
- Board Members
- Presidents and Vice Presidents
- R&D and Innovation Heads
- Technical Specialists
- Domain Subject-matter Experts
- Scientists
- Physicians and Other Healthcare Professionals
- Governance, Ethics, and Data Stewardship
- Research Ethics
- Data Integrity and Handling
- Primary Modes
- Tooling, Models, and Reference Databases
- Desk Research Programme (Secondary Evidence)
- Data Engineering and Model Build
- Data Acquisition and Ingestion
- Cleaning, Normalisation, and Verification
- Synthesis, Triangulation, and Analysis
- Quality Assurance and Audit Trail
- Market Background
- Market Dynamics
- Drivers
- Restraints
- Opportunity
- Trends
- Scenario Forecast
- Demand in Optimistic Scenario
- Demand in Likely Scenario
- Demand in Conservative Scenario
- Opportunity Map Analysis
- Product Life Cycle Analysis
- Supply Chain Analysis
- Investment Feasibility Matrix
- Value Chain Analysis
- PESTLE and Porter’s Analysis
- Regulatory Landscape
- Regional Parent Market Outlook
- Market Dynamics
- Global Market Analysis 2021 to 2025 and Forecast, 2026 to 2036
- Historical Market Size Value (USD Million) Analysis, 2021 to 2025
- Current and Future Market Size Value (USD Million) Projections, 2026 to 2036
- Y-o-Y Growth Trend Analysis
- Absolute $ Opportunity Analysis
- Global Market Pricing Analysis 2021 to 2025 and Forecast 2026 to 2036
- Global Market Analysis 2021 to 2025 and Forecast 2026 to 2036, By Type
- Introduction / Key Findings
- Historical Market Size Value (USD Million) Analysis By Type , 2021 to 2025
- Current and Future Market Size Value (USD Million) Analysis and Forecast By Type , 2026 to 2036
- Carbon Dioxide Removal
- Solar Radiation Management
- Carbon Dioxide Removal
- Y-o-Y Growth Trend Analysis By Type , 2021 to 2025
- Absolute $ Opportunity Analysis By Type , 2026 to 2036
- Global Market Analysis 2021 to 2025 and Forecast 2026 to 2036, By Planetary Ecosystem
- Introduction / Key Findings
- Historical Market Size Value (USD Million) Analysis By Planetary Ecosystem, 2021 to 2025
- Current and Future Market Size Value (USD Million) Analysis and Forecast By Planetary Ecosystem, 2026 to 2036
- Air
- Land
- Water
- Air
- Y-o-Y Growth Trend Analysis By Planetary Ecosystem, 2021 to 2025
- Absolute $ Opportunity Analysis By Planetary Ecosystem, 2026 to 2036
- Global Market Analysis 2021 to 2025 and Forecast 2026 to 2036, By Industry
- Introduction / Key Findings
- Historical Market Size Value (USD Million) Analysis By Industry, 2021 to 2025
- Current and Future Market Size Value (USD Million) Analysis and Forecast By Industry, 2026 to 2036
- Energy & Utilities
- IT & Telecommunication
- Manufacturing
- Government
- Oil & Gas
- Others
- Energy & Utilities
- Y-o-Y Growth Trend Analysis By Industry, 2021 to 2025
- Absolute $ Opportunity Analysis By Industry, 2026 to 2036
- Global Market Analysis 2021 to 2025 and Forecast 2026 to 2036, By Technology
- Introduction / Key Findings
- Historical Market Size Value (USD Million) Analysis By Technology, 2021 to 2025
- Current and Future Market Size Value (USD Million) Analysis and Forecast By Technology, 2026 to 2036
- Atmospheric Engineering Technologies
- Chemical Aerosol Engineering Systems
- Radiative Forcing Control Systems
- Carbon Capture Technologies
- Solvent Based Capture Systems
- Membrane Based Capture Systems
- Biological Carbon Sequestration Technologies
- Soil Enhancement Technologies
- Marine Ecosystem Engineering Systems
- Climate Modeling Technologies
- Supercomputing Climate Simulation Models
- AI Driven Climate Prediction Systems
- Atmospheric Engineering Technologies
- Y-o-Y Growth Trend Analysis By Technology, 2021 to 2025
- Absolute $ Opportunity Analysis By Technology, 2026 to 2036
- Global Market Analysis 2021 to 2025 and Forecast 2026 to 2036, By Pricing Model
- Introduction / Key Findings
- Historical Market Size Value (USD Million) Analysis By Pricing Model, 2021 to 2025
- Current and Future Market Size Value (USD Million) Analysis and Forecast By Pricing Model, 2026 to 2036
- Project Based Funding
- Government Grants
- Private Sector Investment
- Public Private Partnerships
- Carbon Credit Based Funding
- Regulated Carbon Offset Markets
- Voluntary Carbon Markets
- Project Based Funding
- Y-o-Y Growth Trend Analysis By Pricing Model, 2021 to 2025
- Absolute $ Opportunity Analysis By Pricing Model, 2026 to 2036
- Global Market Analysis 2021 to 2025 and Forecast 2026 to 2036, By Region
- Introduction
- Historical Market Size Value (USD Million) Analysis By Region, 2021 to 2025
- Current Market Size Value (USD Million) Analysis and Forecast By Region, 2026 to 2036
- North America
- Latin America
- Western Europe
- Eastern Europe
- East Asia
- South Asia and Pacific
- Middle East & Africa
- Market Attractiveness Analysis By Region
- North America Market Analysis 2021 to 2025 and Forecast 2026 to 2036, By Country
- Historical Market Size Value (USD Million) Trend Analysis By Market Taxonomy, 2021 to 2025
- Market Size Value (USD Million) Forecast By Market Taxonomy, 2026 to 2036
- By Country
- USA
- Canada
- Mexico
- By Type
- By Planetary Ecosystem
- By Industry
- By Technology
- By Pricing Model
- By Country
- Market Attractiveness Analysis
- By Country
- By Type
- By Planetary Ecosystem
- By Industry
- By Technology
- By Pricing Model
- Key Takeaways
- Latin America Market Analysis 2021 to 2025 and Forecast 2026 to 2036, By Country
- Historical Market Size Value (USD Million) Trend Analysis By Market Taxonomy, 2021 to 2025
- Market Size Value (USD Million) Forecast By Market Taxonomy, 2026 to 2036
- By Country
- Brazil
- Chile
- Rest of Latin America
- By Type
- By Planetary Ecosystem
- By Industry
- By Technology
- By Pricing Model
- By Country
- Market Attractiveness Analysis
- By Country
- By Type
- By Planetary Ecosystem
- By Industry
- By Technology
- By Pricing Model
- Key Takeaways
- Western Europe Market Analysis 2021 to 2025 and Forecast 2026 to 2036, By Country
- Historical Market Size Value (USD Million) Trend Analysis By Market Taxonomy, 2021 to 2025
- Market Size Value (USD Million) Forecast By Market Taxonomy, 2026 to 2036
- By Country
- Germany
- UK
- Italy
- Spain
- France
- Nordic
- BENELUX
- Rest of Western Europe
- By Type
- By Planetary Ecosystem
- By Industry
- By Technology
- By Pricing Model
- By Country
- Market Attractiveness Analysis
- By Country
- By Type
- By Planetary Ecosystem
- By Industry
- By Technology
- By Pricing Model
- Key Takeaways
- Eastern Europe Market Analysis 2021 to 2025 and Forecast 2026 to 2036, By Country
- Historical Market Size Value (USD Million) Trend Analysis By Market Taxonomy, 2021 to 2025
- Market Size Value (USD Million) Forecast By Market Taxonomy, 2026 to 2036
- By Country
- Russia
- Poland
- Hungary
- Balkan & Baltic
- Rest of Eastern Europe
- By Type
- By Planetary Ecosystem
- By Industry
- By Technology
- By Pricing Model
- By Country
- Market Attractiveness Analysis
- By Country
- By Type
- By Planetary Ecosystem
- By Industry
- By Technology
- By Pricing Model
- Key Takeaways
- East Asia Market Analysis 2021 to 2025 and Forecast 2026 to 2036, By Country
- Historical Market Size Value (USD Million) Trend Analysis By Market Taxonomy, 2021 to 2025
- Market Size Value (USD Million) Forecast By Market Taxonomy, 2026 to 2036
- By Country
- China
- Japan
- South Korea
- By Type
- By Planetary Ecosystem
- By Industry
- By Technology
- By Pricing Model
- By Country
- Market Attractiveness Analysis
- By Country
- By Type
- By Planetary Ecosystem
- By Industry
- By Technology
- By Pricing Model
- Key Takeaways
- South Asia and Pacific Market Analysis 2021 to 2025 and Forecast 2026 to 2036, By Country
- Historical Market Size Value (USD Million) Trend Analysis By Market Taxonomy, 2021 to 2025
- Market Size Value (USD Million) Forecast By Market Taxonomy, 2026 to 2036
- By Country
- India
- ASEAN
- Australia & New Zealand
- Rest of South Asia and Pacific
- By Type
- By Planetary Ecosystem
- By Industry
- By Technology
- By Pricing Model
- By Country
- Market Attractiveness Analysis
- By Country
- By Type
- By Planetary Ecosystem
- By Industry
- By Technology
- By Pricing Model
- Key Takeaways
- Middle East & Africa Market Analysis 2021 to 2025 and Forecast 2026 to 2036, By Country
- Historical Market Size Value (USD Million) Trend Analysis By Market Taxonomy, 2021 to 2025
- Market Size Value (USD Million) Forecast By Market Taxonomy, 2026 to 2036
- By Country
- Kingdom of Saudi Arabia
- Other GCC Countries
- Turkiye
- South Africa
- Other African Union
- Rest of Middle East & Africa
- By Type
- By Planetary Ecosystem
- By Industry
- By Technology
- By Pricing Model
- By Country
- Market Attractiveness Analysis
- By Country
- By Type
- By Planetary Ecosystem
- By Industry
- By Technology
- By Pricing Model
- Key Takeaways
- Key Countries Market Analysis
- USA
- Pricing Analysis
- Market Share Analysis, 2025
- By Type
- By Planetary Ecosystem
- By Industry
- By Technology
- By Pricing Model
- Canada
- Pricing Analysis
- Market Share Analysis, 2025
- By Type
- By Planetary Ecosystem
- By Industry
- By Technology
- By Pricing Model
- Mexico
- Pricing Analysis
- Market Share Analysis, 2025
- By Type
- By Planetary Ecosystem
- By Industry
- By Technology
- By Pricing Model
- Brazil
- Pricing Analysis
- Market Share Analysis, 2025
- By Type
- By Planetary Ecosystem
- By Industry
- By Technology
- By Pricing Model
- Chile
- Pricing Analysis
- Market Share Analysis, 2025
- By Type
- By Planetary Ecosystem
- By Industry
- By Technology
- By Pricing Model
- Germany
- Pricing Analysis
- Market Share Analysis, 2025
- By Type
- By Planetary Ecosystem
- By Industry
- By Technology
- By Pricing Model
- UK
- Pricing Analysis
- Market Share Analysis, 2025
- By Type
- By Planetary Ecosystem
- By Industry
- By Technology
- By Pricing Model
- Italy
- Pricing Analysis
- Market Share Analysis, 2025
- By Type
- By Planetary Ecosystem
- By Industry
- By Technology
- By Pricing Model
- Spain
- Pricing Analysis
- Market Share Analysis, 2025
- By Type
- By Planetary Ecosystem
- By Industry
- By Technology
- By Pricing Model
- France
- Pricing Analysis
- Market Share Analysis, 2025
- By Type
- By Planetary Ecosystem
- By Industry
- By Technology
- By Pricing Model
- India
- Pricing Analysis
- Market Share Analysis, 2025
- By Type
- By Planetary Ecosystem
- By Industry
- By Technology
- By Pricing Model
- ASEAN
- Pricing Analysis
- Market Share Analysis, 2025
- By Type
- By Planetary Ecosystem
- By Industry
- By Technology
- By Pricing Model
- Australia & New Zealand
- Pricing Analysis
- Market Share Analysis, 2025
- By Type
- By Planetary Ecosystem
- By Industry
- By Technology
- By Pricing Model
- China
- Pricing Analysis
- Market Share Analysis, 2025
- By Type
- By Planetary Ecosystem
- By Industry
- By Technology
- By Pricing Model
- Japan
- Pricing Analysis
- Market Share Analysis, 2025
- By Type
- By Planetary Ecosystem
- By Industry
- By Technology
- By Pricing Model
- South Korea
- Pricing Analysis
- Market Share Analysis, 2025
- By Type
- By Planetary Ecosystem
- By Industry
- By Technology
- By Pricing Model
- Russia
- Pricing Analysis
- Market Share Analysis, 2025
- By Type
- By Planetary Ecosystem
- By Industry
- By Technology
- By Pricing Model
- Poland
- Pricing Analysis
- Market Share Analysis, 2025
- By Type
- By Planetary Ecosystem
- By Industry
- By Technology
- By Pricing Model
- Hungary
- Pricing Analysis
- Market Share Analysis, 2025
- By Type
- By Planetary Ecosystem
- By Industry
- By Technology
- By Pricing Model
- Kingdom of Saudi Arabia
- Pricing Analysis
- Market Share Analysis, 2025
- By Type
- By Planetary Ecosystem
- By Industry
- By Technology
- By Pricing Model
- Turkiye
- Pricing Analysis
- Market Share Analysis, 2025
- By Type
- By Planetary Ecosystem
- By Industry
- By Technology
- By Pricing Model
- South Africa
- Pricing Analysis
- Market Share Analysis, 2025
- By Type
- By Planetary Ecosystem
- By Industry
- By Technology
- By Pricing Model
- USA
- Market Structure Analysis
- Competition Dashboard
- Competition Benchmarking
- Market Share Analysis of Top Players
- By Regional
- By Type
- By Planetary Ecosystem
- By Industry
- By Technology
- By Pricing Model
- Competition Analysis
- Competition Deep Dive
- Carbon Engineering Ltd.
- Overview
- Product Portfolio
- Profitability by Market Segments (Product/Age /Sales Channel/Region)
- Sales Footprint
- Strategy Overview
- Marketing Strategy
- Product Strategy
- Channel Strategy
- Climeworks AG
- Global Thermostat
- SRM Technologies
- Ocean Nourishment Corporation
- NASA & Government Agencies
- The Gates Foundation
- MIT Climate Science Research
- Harvard University’s Solar
- Private Climate Tech Startups
- Carbon Engineering Ltd.
- Competition Deep Dive
- Assumptions & Acronyms Used


