Gift Packaging Market Outlook for (2023 to 2033)

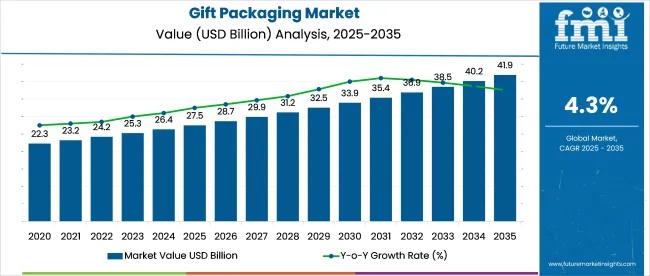
The global gift packaging market value is estimated to clock a revenue of USD 37.4 billion by 2033. The gift packaging demand is expected to register a CAGR of 4.3% through 2033, with a present valuation of USD 25.3 billion in 2023.

Key Trends in the Gift Packaging Market

  • Gift box manufacturers are embracing the trend of minimal aesthetics as consumers show a shift in their preferences. Major brands like Zazzle and Etsy provide a wide portfolio of minimalistic designs.
  • New trends for gift wrap and customized prints are being adopted by leading brands in the market like Karl Knauer KG and DS Smith plc. This is expected to yield improved design flexibility and convenience for its consumers.
  • The rampant expansion of e-commerce giants like Snapdeal and Amazon is also a major catalyst for sales of gift packaging solutions.
  • Soaring environmental concerns are positively influencing the consumption of eco-friendly gift packaging solutions like cloth bags. Conscious consumers are opting for atypical gift-wrapping materials to conserve trees and paper.
  • Surging demand for custom and personalized printed packaging is projected to present consumers with new levels of convenience, customization, and design choices.
Attribute Details
Gift Packaging Market Size, 2023 USD 25.3 billion
Gift Packaging Market Size, 2033 USD 37.4 billion
Value-based CAGR (2023 to 2033) 4.3%

Historical Growth of the Gift Packaging Market Vs. Forecast Outlook

Sales of gift packaging solutions are predicted to increase over the forecast period, influenced by their increased acceptability in different situations. Manufacturers are focusing on helping businesses enhance their offerings on the shelf by offering minimalist designs and innovative presentation styles. The surging purchasing power of individuals, along with the shifting trend toward gifting on occasions like farewell parties, birthdays, and anniversaries, are adding to product sales.

Attributes Details
Gift Packaging Market Size (2018) USD 20.36 billion
Gift Packaging Market Size (2022) USD 24.1 billion
Gift Packaging Market (CAGR 2023 to 2033) 4.3%

Over the forecast period, the surge in the corporate gifting culture is expected to become prevalent as firms opt to promote themselves and create business relationships. The increasing popularity of corrugated gift boxes, due to their diverse beneficial properties like resistance, reusability, aesthetic appeal, and much more, is predicted to stimulate market growth.

Country-wise Insights

New Opportunities Emerging in Asia Pacific As Merchants are Focusing on Untapped Markets

Country Market Share in 2023
China 12.2%
India 8.5%
Japan 3.6%
South Korea 3.4%
Thailand 1.3%

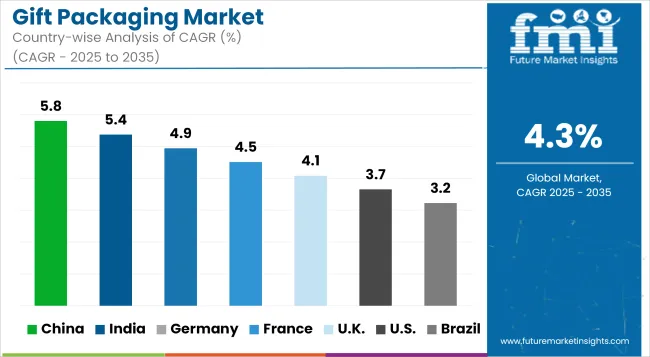
The gifting culture in the Asia Pacific is especially elaborate during special occasions. Organizations, corporations, and families partake in gifting activities during celebrations, festivals, and different events. A look at the regional market depicts a greater contribution of China and India, which account for leading market shares.

The increase in plastic pollution in Asian countries has led to the popularity of paper boxes. The surge in gift-giving occasions in Asian countries is strengthening the gift packaging market growth. After witnessing huge success in developing countries like China and India, gift packaging merchants are vying for larger shares in countries like Japan, South Korea, and Thailand.

Companies Expanding Presence in China by Curating Gift Boxes to Lure More Customers

Consumers in China with high purchasing power seek elegant gift box options for gifting purposes. Merchants in China are attracting businesses by offering unique products and services that enhance the overall experience of their customers. Additionally, consumers like to post products with distinct packaging on social media to share their experiences. This is expected to accelerate the trend of themed gift packaging.

  • For instance, in August 2023, the OnePlus Ace 2 Pro confirmed its release date in China, in conjunction with Yuan Shen Paimeng-themed gift box.

China accounts for a major share of global revenue from e-commerce. Consequently, this country is expected to be a prominent market for e-commerce business in the years ahead. High prospects for e-commerce business are expected to be favorable for gift packaging merchants.

Vendors in Japan Attracting Business Opportunities by Selling Creative Packaging Solutions

As per the latest market estimates, Japan is predicted to enjoy a 3.6% share of the global market. The country is widely known for its obsession with packaging and its popular gift-wrapping techniques. The easy availability of wrapping papers in department stores in Japan is adding to the increasing sales of gift packaging solutions.

Key players are capitalizing on the craze of consumers in Japan for gift wrapping, by introducing their favorite animations as a gift packaging choice for special occasions.

  • For instance, in April 2023, Donguri Kyowakoku, which is a retail chain that trades the studio’s official merchandise is offering My Neighbour Totoro Corn Gift Set as a Mother’s Day special. The gift set comes with corn-like packaging, which is a beautiful capture of the movie scene from My Neighbour Totoro.

Merchants Capitalizing on the Increasing Interest in Traditional Korean Wrapping

The South Korean market for gift packaging is expected to obtain a market share of 3.4% in 2023. Leading providers of gift packaging solutions are focusing on gaining profits from the intensifying demand for modern as well as traditional wrapping papers in the country. Suppliers are offering businesses customized and personalized packaging solutions for gifts. Vendors provide professional services for different gift boxes, paper bags, hang tags, jewelry boxes, and other paper products for creative packing solutions for brands.

Enthusiastic Christmas Celebrations in North America Propel the Overall Gift Packaging Sales

Country Market Share in 2023
United States 14.3%
Canada 1.5%

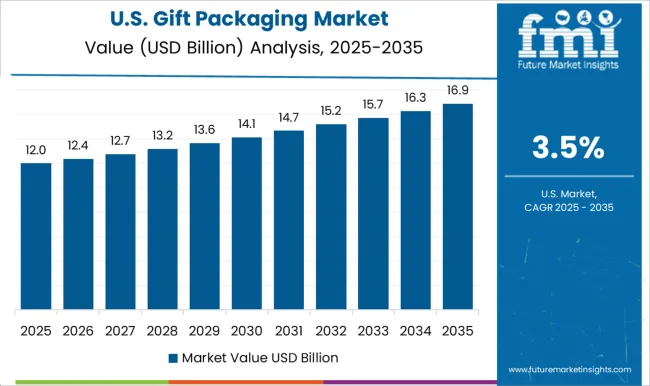
The North America market relishes a broader market share in the global gift packaging market, thanks to enthusiastic celebrations and holiday gifting during Christmas time, and other occasions. The United States leads the regional market composition, with Canada following behind. Globally, the United States share accounts for 14.3%, demonstrating its greater influence in the global turnover generated from the gift packaging market.

Emphasis on Strengthening Distribution Networks by Small Businesses Catalyze Market Growth

Consumption of packaging supplies in Canada is surging at an increased pace. A chief driver for this trend is a surge in the migrating population, coming to the country for education, employment opportunities, etc. The increasing population, in tandem with their inflated disposable incomes, is contributing to the sales of gift packaging solutions. Canada is expected to occupy a 1.5% share of the global market.

Soaring demand for diverse gifting accessories like containers, ribbons & bows, gift sacks, and gift bags, etc. is catalyzing the market growth in Canada. Apart from this, leading vendors are strengthening their distribution networks to yield increased accessibility and sales from their products. The widespread establishment of small business entities in the country is increasing opportunities for gift packaging suppliers.

Europe to Witness Notable Use of Sustainable Gift Wrap

Country Market Share in 2023
Germany 4.2%
United Kingdom 3%
Italy 2.6%
France 1.7%
Spain 1.6%

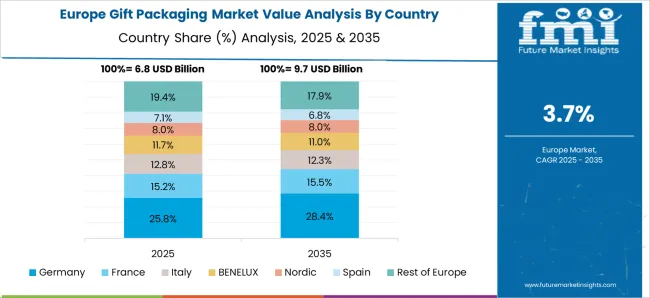
The Europe gift packaging market is filled with strong contenders for gift packaging solutions. To differentiate their offerings, competitors are offering eco-friendly gift packaging solutions. This strategy chiefly captures the wide environment-conscious population in Europe. Key players are offering custom-made gift bags and other products, available in different sizes and materials, for a more personalized experience. In the future, top vendors are projected to strive for packaging innovations to sustain consumers' intrigue in gift packaging.

Germany and the United Kingdom enjoy a substantial market share. Going forward, key players are predicted to enter or expand their reach in less penetrated countries like Spain, Italy, France, etc.

Rising Demand for Custom Gift Boxes in Germany to Proliferate the Market

Germany is anticipated to account for 4.2% market share in 2023. Market leaders of gift packaging in Germany are considered trendsetters in terms of design and material implementation. Key players are offering a wide selection of solutions that promise high-quality gift packaging solutions. Gift packaging providers offer custom gift boxes and other solutions to assist businesses in providing gifts with a custom design.

Category-wise Insights

Gift Boxes Enjoying High Traction as a Gift Packaging Option

Top Product Type Gift Boxes
Market Share in 2023 21.3%

The gift boxes segment is anticipated to gain a market share of 21.3% in 2023. Surging demand for personalized gifting and rising consumer liking for eye-catching packaging designs have been pushing segment growth. Technological innovations in box material options, plus rampant e-commerce growth, are propelling businesses to opt for boxes more cautiously. Manufacturers are improving their services by offering high-performing materials, cost-effectiveness, on-demand delivery systems, etc.

Gift boxes are typically composed of plastic, paperboard, aluminum, and tin. The demand for gift boxes is rising on account of the increasing consumption of food and beverages, including sweets, chocolate, toys, and wine across the globe. Sellers of food products deploy gift boxes for packaging as it enhances the appeal of the food item. Apart from food and beverages, gift boxes are used to package toys, cosmetic products, sculptures, personal care products, jewelry, electronic devices, and other items.

Higher Preference for Paper and Paperboard as Concerns over Sustainability Rises

Top Material Type Paper and Paperboard
Market Share in 2023 43%

Paper and paperboard are predicted to settle at a significant market share of 43%. These materials find extensive use in packaging food and drinks, due to high returns available on investment. The introduction of bans on single-use plastics and other materials has pushed the sales of eco-friendly gift packaging solutions like paper and paperboard.

The concept of environmental conservation is bearing positive results with the use of recycled paper and paperboard. Paper packaging is gaining widespread popularity owing to its durability and attractive packaging. Apart from surging demand for cards, the flourishing market of bouquets is also spurring gift packaging market growth.

Competitive Landscape in the Gift Packaging Market

The gift packaging industry is quite fragmented and has fierce competition. The market is filled with domestic as well as regional contenders. Some typical market expansion strategies include expansions, M&A, partnerships, and collaborations. Apart from this, top players are developing new products as a strategic approach to elevate their market presence. Strategies like these are predicted to boost the level of competition and the product portfolio.

Recent Developments in the Gift Packaging Market

  • Hotel Éclat Beijing is a small premium hotel famous for its museum-quality artwork collection. In September 2023, the hotel introduced a limited mooncake gift box equipped with the artwork of Dreamy Rabbit created by Eirdís Ragnarsdóttir, an Icelandic-Chinese artist. The artwork celebrates the impending Mid-Autumn Festival.
  • In September 2023, Louis Vuitton opted for craft gift boxes to depict its commitment to the China market. This year, the gift box designed by Louis Vuitton is inspired by the Qianlong book box, which was initially used for protecting precious books and calligraphy during Emperor Qianlong’s reign in the 1700s.
  • In August 2023, Hallmark and Venmo declared its first-ever and unique collaboration that simplifies the gifting process with the introduction of Hallmark + Venmo Cards. With this innovation, customers can safely send money to friends and family. Thus, offering a unique and user-friendly way to gift to near and dear ones, and transforming the gift-giving experience.
  • In May 2022, Smurfit Kappa UK Limited, which is a paper-based packaging product manufacturer, acquired Atlas Packaging which provides corrugated packaging solutions.

Key Players in the Gift Packaging Market

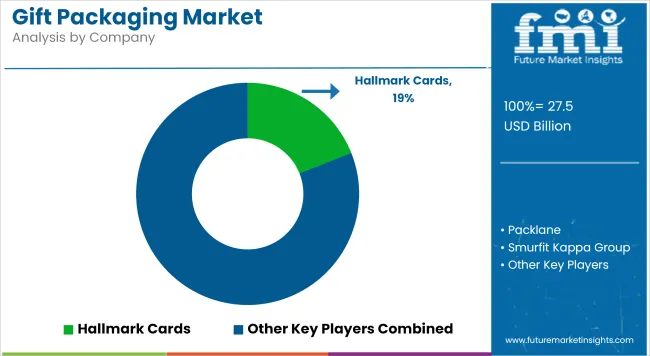
  • Hallmark Cards
  • Packlane
  • Smurfit Kappa Group
  • Ebro Colour GmbH
  • Interpack
  • Card Factory
  • DS Smith plc
  • IG Design Group plc
  • Karl Knauer KG
  • Mondi plc
  • Manjushree Technopack Limited
  • Qwikcilver Solutions
  • Diageo

Key Segments in the Gift Packaging Market

By Packaging Type:

  • Primary
  • Secondary
  • Tertiary

By Product Type:

  • Gift Boxes
  • Containers
  • Ribbon & Bows
  • Gift Sacks
  • Gift Bags
  • Wrapping Paper
  • Tissue Paper & Shreds
  • Cellophane Over Wrap & Bags
  • Gift Cards & Money Holders
  • Others

By Material:

  • Plastic
  • Paper & Paperboard
  • Metals
  • Glass
  • Others

By Region:

  • North America
  • Latin America
  • Europe
  • Asia Pacific
  • Middle East and Africa

Table of Content

  • 1. Executive Summary
  • 2. Market Overview
  • 3. Market Background
  • 4. Global Market Analysis 2018 to 2022 and Forecast, 2023 to 2033
  • 5. Global Market Analysis 2018 to 2022 and Forecast 2023 to 2033, By Packaging Type
    • 5.1. Primary
    • 5.2. Secondary
    • 5.3. Tertiary
  • 6. Global Market Analysis 2018 to 2022 and Forecast 2023 to 2033, By Product Type
    • 6.1. Gift Boxes
    • 6.2. Containers
    • 6.3. Ribbon & Bows
    • 6.4. Gift Sacks
    • 6.5. Gift Bags
    • 6.6. Wrapping Paper
    • 6.7. Tissue Paper & Shreds
    • 6.8. Cellophane Over Wrap & Bags
    • 6.9. Gift Cards & Money Holders
    • 6.10. Others
  • 7. Global Market Analysis 2018 to 2022 and Forecast 2023 to 2033, By Region
    • 7.1. North America
    • 7.2. Latin America
    • 7.3. Western Europe
    • 7.4. Eastern Europe
    • 7.5. South Asia and Pacific
    • 7.6. East Asia
    • 7.7. Middle East and Africa
  • 8. North America Market Analysis 2018 to 2022 and Forecast 2023 to 2033, By Country
  • 9. Latin America Market Analysis 2018 to 2022 and Forecast 2023 to 2033, By Country
  • 10. Western Europe Market Analysis 2018 to 2022 and Forecast 2023 to 2033, By Country
  • 11. Eastern Europe Market Analysis 2018 to 2022 and Forecast 2023 to 2033, By Country
  • 12. South Asia and Pacific Market Analysis 2018 to 2022 and Forecast 2023 to 2033, By Country
  • 13. East Asia Market Analysis 2018 to 2022 and Forecast 2023 to 2033, By Country
  • 14. Middle East and Africa Market Analysis 2018 to 2022 and Forecast 2023 to 2033, By Country
  • 15. Key Countries Market Analysis
  • 16. Market Structure Analysis
  • 17. Competition Analysis
    • 17.1. Hallmark Cards
    • 17.2. Packlane
    • 17.3. Smurfit Kappa Group
    • 17.4. Ebro Colour GmbH
    • 17.5. Interpack
    • 17.6. Card Factory
    • 17.7. DS Smith plc
    • 17.8. IG Design Group plc
    • 17.9. Karl Knauer KG
    • 17.10. Mondi plc
    • 17.11. Manjushree Technopack Limited
    • 17.12. Qwikcilver Solutions
    • 17.13. Diageo
  • 18. Assumptions & Acronyms Used
  • 19. Research Methodology

List of Tables

Table 1: Global Market Value (US$ Million) Forecast by Region, 2018 to 2033

Table 2: Global Market Volume (Units) Forecast by Region, 2018 to 2033

Table 3: Global Market Value (US$ Million) Forecast by Packaging Type, 2018 to 2033

Table 4: Global Market Volume (Units) Forecast by Packaging Type, 2018 to 2033

Table 5: Global Market Value (US$ Million) Forecast by Product Type, 2018 to 2033

Table 6: Global Market Volume (Units) Forecast by Product Type, 2018 to 2033

Table 7: North America Market Value (US$ Million) Forecast by Country, 2018 to 2033

Table 8: North America Market Volume (Units) Forecast by Country, 2018 to 2033

Table 9: North America Market Value (US$ Million) Forecast by Packaging Type, 2018 to 2033

Table 10: North America Market Volume (Units) Forecast by Packaging Type, 2018 to 2033

Table 11: North America Market Value (US$ Million) Forecast by Product Type, 2018 to 2033

Table 12: North America Market Volume (Units) Forecast by Product Type, 2018 to 2033

Table 13: Latin America Market Value (US$ Million) Forecast by Country, 2018 to 2033

Table 14: Latin America Market Volume (Units) Forecast by Country, 2018 to 2033

Table 15: Latin America Market Value (US$ Million) Forecast by Packaging Type, 2018 to 2033

Table 16: Latin America Market Volume (Units) Forecast by Packaging Type, 2018 to 2033

Table 17: Latin America Market Value (US$ Million) Forecast by Product Type, 2018 to 2033

Table 18: Latin America Market Volume (Units) Forecast by Product Type, 2018 to 2033

Table 19: Western Europe Market Value (US$ Million) Forecast by Country, 2018 to 2033

Table 20: Western Europe Market Volume (Units) Forecast by Country, 2018 to 2033

Table 21: Western Europe Market Value (US$ Million) Forecast by Packaging Type, 2018 to 2033

Table 22: Western Europe Market Volume (Units) Forecast by Packaging Type, 2018 to 2033

Table 23: Western Europe Market Value (US$ Million) Forecast by Product Type, 2018 to 2033

Table 24: Western Europe Market Volume (Units) Forecast by Product Type, 2018 to 2033

Table 25: Eastern Europe Market Value (US$ Million) Forecast by Country, 2018 to 2033

Table 26: Eastern Europe Market Volume (Units) Forecast by Country, 2018 to 2033

Table 27: Eastern Europe Market Value (US$ Million) Forecast by Packaging Type, 2018 to 2033

Table 28: Eastern Europe Market Volume (Units) Forecast by Packaging Type, 2018 to 2033

Table 29: Eastern Europe Market Value (US$ Million) Forecast by Product Type, 2018 to 2033

Table 30: Eastern Europe Market Volume (Units) Forecast by Product Type, 2018 to 2033

Table 31: South Asia and Pacific Market Value (US$ Million) Forecast by Country, 2018 to 2033

Table 32: South Asia and Pacific Market Volume (Units) Forecast by Country, 2018 to 2033

Table 33: South Asia and Pacific Market Value (US$ Million) Forecast by Packaging Type, 2018 to 2033

Table 34: South Asia and Pacific Market Volume (Units) Forecast by Packaging Type, 2018 to 2033

Table 35: South Asia and Pacific Market Value (US$ Million) Forecast by Product Type, 2018 to 2033

Table 36: South Asia and Pacific Market Volume (Units) Forecast by Product Type, 2018 to 2033

Table 37: East Asia Market Value (US$ Million) Forecast by Country, 2018 to 2033

Table 38: East Asia Market Volume (Units) Forecast by Country, 2018 to 2033

Table 39: East Asia Market Value (US$ Million) Forecast by Packaging Type, 2018 to 2033

Table 40: East Asia Market Volume (Units) Forecast by Packaging Type, 2018 to 2033

Table 41: East Asia Market Value (US$ Million) Forecast by Product Type, 2018 to 2033

Table 42: East Asia Market Volume (Units) Forecast by Product Type, 2018 to 2033

Table 43: Middle East and Africa Market Value (US$ Million) Forecast by Country, 2018 to 2033

Table 44: Middle East and Africa Market Volume (Units) Forecast by Country, 2018 to 2033

Table 45: Middle East and Africa Market Value (US$ Million) Forecast by Packaging Type, 2018 to 2033

Table 46: Middle East and Africa Market Volume (Units) Forecast by Packaging Type, 2018 to 2033

Table 47: Middle East and Africa Market Value (US$ Million) Forecast by Product Type, 2018 to 2033

Table 48: Middle East and Africa Market Volume (Units) Forecast by Product Type, 2018 to 2033

List of Figures

Figure 1: Global Market Value (US$ Million) by Packaging Type, 2023 to 2033

Figure 2: Global Market Value (US$ Million) by Product Type, 2023 to 2033

Figure 3: Global Market Value (US$ Million) by Region, 2023 to 2033

Figure 4: Global Market Value (US$ Million) Analysis by Region, 2018 to 2033

Figure 5: Global Market Volume (Units) Analysis by Region, 2018 to 2033

Figure 6: Global Market Value Share (%) and BPS Analysis by Region, 2023 to 2033

Figure 7: Global Market Y-o-Y Growth (%) Projections by Region, 2023 to 2033

Figure 8: Global Market Value (US$ Million) Analysis by Packaging Type, 2018 to 2033

Figure 9: Global Market Volume (Units) Analysis by Packaging Type, 2018 to 2033

Figure 10: Global Market Value Share (%) and BPS Analysis by Packaging Type, 2023 to 2033

Figure 11: Global Market Y-o-Y Growth (%) Projections by Packaging Type, 2023 to 2033

Figure 12: Global Market Value (US$ Million) Analysis by Product Type, 2018 to 2033

Figure 13: Global Market Volume (Units) Analysis by Product Type, 2018 to 2033

Figure 14: Global Market Value Share (%) and BPS Analysis by Product Type, 2023 to 2033

Figure 15: Global Market Y-o-Y Growth (%) Projections by Product Type, 2023 to 2033

Figure 16: Global Market Attractiveness by Packaging Type, 2023 to 2033

Figure 17: Global Market Attractiveness by Product Type, 2023 to 2033

Figure 18: Global Market Attractiveness by Region, 2023 to 2033

Figure 19: North America Market Value (US$ Million) by Packaging Type, 2023 to 2033

Figure 20: North America Market Value (US$ Million) by Product Type, 2023 to 2033

Figure 21: North America Market Value (US$ Million) by Country, 2023 to 2033

Figure 22: North America Market Value (US$ Million) Analysis by Country, 2018 to 2033

Figure 23: North America Market Volume (Units) Analysis by Country, 2018 to 2033

Figure 24: North America Market Value Share (%) and BPS Analysis by Country, 2023 to 2033

Figure 25: North America Market Y-o-Y Growth (%) Projections by Country, 2023 to 2033

Figure 26: North America Market Value (US$ Million) Analysis by Packaging Type, 2018 to 2033

Figure 27: North America Market Volume (Units) Analysis by Packaging Type, 2018 to 2033

Figure 28: North America Market Value Share (%) and BPS Analysis by Packaging Type, 2023 to 2033

Figure 29: North America Market Y-o-Y Growth (%) Projections by Packaging Type, 2023 to 2033

Figure 30: North America Market Value (US$ Million) Analysis by Product Type, 2018 to 2033

Figure 31: North America Market Volume (Units) Analysis by Product Type, 2018 to 2033

Figure 32: North America Market Value Share (%) and BPS Analysis by Product Type, 2023 to 2033

Figure 33: North America Market Y-o-Y Growth (%) Projections by Product Type, 2023 to 2033

Figure 34: North America Market Attractiveness by Packaging Type, 2023 to 2033

Figure 35: North America Market Attractiveness by Product Type, 2023 to 2033

Figure 36: North America Market Attractiveness by Country, 2023 to 2033

Figure 37: Latin America Market Value (US$ Million) by Packaging Type, 2023 to 2033

Figure 38: Latin America Market Value (US$ Million) by Product Type, 2023 to 2033

Figure 39: Latin America Market Value (US$ Million) by Country, 2023 to 2033

Figure 40: Latin America Market Value (US$ Million) Analysis by Country, 2018 to 2033

Figure 41: Latin America Market Volume (Units) Analysis by Country, 2018 to 2033

Figure 42: Latin America Market Value Share (%) and BPS Analysis by Country, 2023 to 2033

Figure 43: Latin America Market Y-o-Y Growth (%) Projections by Country, 2023 to 2033

Figure 44: Latin America Market Value (US$ Million) Analysis by Packaging Type, 2018 to 2033

Figure 45: Latin America Market Volume (Units) Analysis by Packaging Type, 2018 to 2033

Figure 46: Latin America Market Value Share (%) and BPS Analysis by Packaging Type, 2023 to 2033

Figure 47: Latin America Market Y-o-Y Growth (%) Projections by Packaging Type, 2023 to 2033

Figure 48: Latin America Market Value (US$ Million) Analysis by Product Type, 2018 to 2033

Figure 49: Latin America Market Volume (Units) Analysis by Product Type, 2018 to 2033

Figure 50: Latin America Market Value Share (%) and BPS Analysis by Product Type, 2023 to 2033

Figure 51: Latin America Market Y-o-Y Growth (%) Projections by Product Type, 2023 to 2033

Figure 52: Latin America Market Attractiveness by Packaging Type, 2023 to 2033

Figure 53: Latin America Market Attractiveness by Product Type, 2023 to 2033

Figure 54: Latin America Market Attractiveness by Country, 2023 to 2033

Figure 55: Western Europe Market Value (US$ Million) by Packaging Type, 2023 to 2033

Figure 56: Western Europe Market Value (US$ Million) by Product Type, 2023 to 2033

Figure 57: Western Europe Market Value (US$ Million) by Country, 2023 to 2033

Figure 58: Western Europe Market Value (US$ Million) Analysis by Country, 2018 to 2033

Figure 59: Western Europe Market Volume (Units) Analysis by Country, 2018 to 2033

Figure 60: Western Europe Market Value Share (%) and BPS Analysis by Country, 2023 to 2033

Figure 61: Western Europe Market Y-o-Y Growth (%) Projections by Country, 2023 to 2033

Figure 62: Western Europe Market Value (US$ Million) Analysis by Packaging Type, 2018 to 2033

Figure 63: Western Europe Market Volume (Units) Analysis by Packaging Type, 2018 to 2033

Figure 64: Western Europe Market Value Share (%) and BPS Analysis by Packaging Type, 2023 to 2033

Figure 65: Western Europe Market Y-o-Y Growth (%) Projections by Packaging Type, 2023 to 2033

Figure 66: Western Europe Market Value (US$ Million) Analysis by Product Type, 2018 to 2033

Figure 67: Western Europe Market Volume (Units) Analysis by Product Type, 2018 to 2033

Figure 68: Western Europe Market Value Share (%) and BPS Analysis by Product Type, 2023 to 2033

Figure 69: Western Europe Market Y-o-Y Growth (%) Projections by Product Type, 2023 to 2033

Figure 70: Western Europe Market Attractiveness by Packaging Type, 2023 to 2033

Figure 71: Western Europe Market Attractiveness by Product Type, 2023 to 2033

Figure 72: Western Europe Market Attractiveness by Country, 2023 to 2033

Figure 73: Eastern Europe Market Value (US$ Million) by Packaging Type, 2023 to 2033

Figure 74: Eastern Europe Market Value (US$ Million) by Product Type, 2023 to 2033

Figure 75: Eastern Europe Market Value (US$ Million) by Country, 2023 to 2033

Figure 76: Eastern Europe Market Value (US$ Million) Analysis by Country, 2018 to 2033

Figure 77: Eastern Europe Market Volume (Units) Analysis by Country, 2018 to 2033

Figure 78: Eastern Europe Market Value Share (%) and BPS Analysis by Country, 2023 to 2033

Figure 79: Eastern Europe Market Y-o-Y Growth (%) Projections by Country, 2023 to 2033

Figure 80: Eastern Europe Market Value (US$ Million) Analysis by Packaging Type, 2018 to 2033

Figure 81: Eastern Europe Market Volume (Units) Analysis by Packaging Type, 2018 to 2033

Figure 82: Eastern Europe Market Value Share (%) and BPS Analysis by Packaging Type, 2023 to 2033

Figure 83: Eastern Europe Market Y-o-Y Growth (%) Projections by Packaging Type, 2023 to 2033

Figure 84: Eastern Europe Market Value (US$ Million) Analysis by Product Type, 2018 to 2033

Figure 85: Eastern Europe Market Volume (Units) Analysis by Product Type, 2018 to 2033

Figure 86: Eastern Europe Market Value Share (%) and BPS Analysis by Product Type, 2023 to 2033

Figure 87: Eastern Europe Market Y-o-Y Growth (%) Projections by Product Type, 2023 to 2033

Figure 88: Eastern Europe Market Attractiveness by Packaging Type, 2023 to 2033

Figure 89: Eastern Europe Market Attractiveness by Product Type, 2023 to 2033

Figure 90: Eastern Europe Market Attractiveness by Country, 2023 to 2033

Figure 91: South Asia and Pacific Market Value (US$ Million) by Packaging Type, 2023 to 2033

Figure 92: South Asia and Pacific Market Value (US$ Million) by Product Type, 2023 to 2033

Figure 93: South Asia and Pacific Market Value (US$ Million) by Country, 2023 to 2033

Figure 94: South Asia and Pacific Market Value (US$ Million) Analysis by Country, 2018 to 2033

Figure 95: South Asia and Pacific Market Volume (Units) Analysis by Country, 2018 to 2033

Figure 96: South Asia and Pacific Market Value Share (%) and BPS Analysis by Country, 2023 to 2033

Figure 97: South Asia and Pacific Market Y-o-Y Growth (%) Projections by Country, 2023 to 2033

Figure 98: South Asia and Pacific Market Value (US$ Million) Analysis by Packaging Type, 2018 to 2033

Figure 99: South Asia and Pacific Market Volume (Units) Analysis by Packaging Type, 2018 to 2033

Figure 100: South Asia and Pacific Market Value Share (%) and BPS Analysis by Packaging Type, 2023 to 2033

Figure 101: South Asia and Pacific Market Y-o-Y Growth (%) Projections by Packaging Type, 2023 to 2033

Figure 102: South Asia and Pacific Market Value (US$ Million) Analysis by Product Type, 2018 to 2033

Figure 103: South Asia and Pacific Market Volume (Units) Analysis by Product Type, 2018 to 2033

Figure 104: South Asia and Pacific Market Value Share (%) and BPS Analysis by Product Type, 2023 to 2033

Figure 105: South Asia and Pacific Market Y-o-Y Growth (%) Projections by Product Type, 2023 to 2033

Figure 106: South Asia and Pacific Market Attractiveness by Packaging Type, 2023 to 2033

Figure 107: South Asia and Pacific Market Attractiveness by Product Type, 2023 to 2033

Figure 108: South Asia and Pacific Market Attractiveness by Country, 2023 to 2033

Figure 109: East Asia Market Value (US$ Million) by Packaging Type, 2023 to 2033

Figure 110: East Asia Market Value (US$ Million) by Product Type, 2023 to 2033

Figure 111: East Asia Market Value (US$ Million) by Country, 2023 to 2033

Figure 112: East Asia Market Value (US$ Million) Analysis by Country, 2018 to 2033

Figure 113: East Asia Market Volume (Units) Analysis by Country, 2018 to 2033

Figure 114: East Asia Market Value Share (%) and BPS Analysis by Country, 2023 to 2033

Figure 115: East Asia Market Y-o-Y Growth (%) Projections by Country, 2023 to 2033

Figure 116: East Asia Market Value (US$ Million) Analysis by Packaging Type, 2018 to 2033

Figure 117: East Asia Market Volume (Units) Analysis by Packaging Type, 2018 to 2033

Figure 118: East Asia Market Value Share (%) and BPS Analysis by Packaging Type, 2023 to 2033

Figure 119: East Asia Market Y-o-Y Growth (%) Projections by Packaging Type, 2023 to 2033

Figure 120: East Asia Market Value (US$ Million) Analysis by Product Type, 2018 to 2033

Figure 121: East Asia Market Volume (Units) Analysis by Product Type, 2018 to 2033

Figure 122: East Asia Market Value Share (%) and BPS Analysis by Product Type, 2023 to 2033

Figure 123: East Asia Market Y-o-Y Growth (%) Projections by Product Type, 2023 to 2033

Figure 124: East Asia Market Attractiveness by Packaging Type, 2023 to 2033

Figure 125: East Asia Market Attractiveness by Product Type, 2023 to 2033

Figure 126: East Asia Market Attractiveness by Country, 2023 to 2033

Figure 127: Middle East and Africa Market Value (US$ Million) by Packaging Type, 2023 to 2033

Figure 128: Middle East and Africa Market Value (US$ Million) by Product Type, 2023 to 2033

Figure 129: Middle East and Africa Market Value (US$ Million) by Country, 2023 to 2033

Figure 130: Middle East and Africa Market Value (US$ Million) Analysis by Country, 2018 to 2033

Figure 131: Middle East and Africa Market Volume (Units) Analysis by Country, 2018 to 2033

Figure 132: Middle East and Africa Market Value Share (%) and BPS Analysis by Country, 2023 to 2033

Figure 133: Middle East and Africa Market Y-o-Y Growth (%) Projections by Country, 2023 to 2033

Figure 134: Middle East and Africa Market Value (US$ Million) Analysis by Packaging Type, 2018 to 2033

Figure 135: Middle East and Africa Market Volume (Units) Analysis by Packaging Type, 2018 to 2033

Figure 136: Middle East and Africa Market Value Share (%) and BPS Analysis by Packaging Type, 2023 to 2033

Figure 137: Middle East and Africa Market Y-o-Y Growth (%) Projections by Packaging Type, 2023 to 2033

Figure 138: Middle East and Africa Market Value (US$ Million) Analysis by Product Type, 2018 to 2033

Figure 139: Middle East and Africa Market Volume (Units) Analysis by Product Type, 2018 to 2033

Figure 140: Middle East and Africa Market Value Share (%) and BPS Analysis by Product Type, 2023 to 2033

Figure 141: Middle East and Africa Market Y-o-Y Growth (%) Projections by Product Type, 2023 to 2033

Figure 142: Middle East and Africa Market Attractiveness by Packaging Type, 2023 to 2033

Figure 143: Middle East and Africa Market Attractiveness by Product Type, 2023 to 2033

Figure 144: Middle East and Africa Market Attractiveness by Country, 2023 to 2033

Frequently Asked Questions

How Big is the Gift Packaging Market?

The gift packaging market revenue is USD 25.3 billion in 2023.

What is the Growth Potential of the Gift Packaging Market?

The market is expected to expand at a CAGR of 4.3% through 2033.

What is the Future of the Gift Packaging Industry?

The gift packaging market is predicted to account for USD 37.4 billion by 2033.

Which Country is Expected to Attain the Maximum Share?

The United States is projected to grab a maximum market share.

Which Material is Highly Preferred by Consumers?

Paper and paperboard are highly preferred for packaging, accounting for 43% of the global market share.

Which Companies are the Key Competitors in the Gift Packaging Market?

Hallmark Cards, Packlane, and Smurfit Kappa Group are the key competitors in the market.

Explore Similar Insights

Future Market Insights

Gift Packaging Market