

- Market Size (2026)
- USD 1.4 Bn
- Forecast (2036)
- USD 2.3 Bn
- CAGR (2026 to 2036)
- 5.1%
How big is Flare Gas Recovery System Market in 2026?
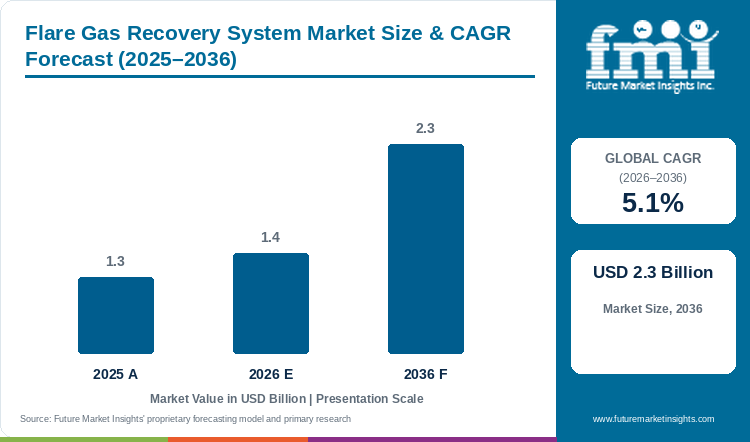
Demand is projected to expand at 5.1% CAGR from 2026 to 2036. Market value rises from USD 1.3 billion in 2025 to USD 1.4 billion in 2026 and USD 2.3 billion by 2036.
The flare gas recovery system market is estimated at USD 1.4 billion in 2026 and is projected to reach USD 2.3 billion by 2036, compared with USD 1.3 billion in 2025, as operators assess the value of capturing gas within the practical constraints of an existing process site. The commercial requirement combines a defined gas stream with compression, controls and an outlet that can use the recovered product, making engineering integration central to the equipment decision. The World Bank's 2026 gas-flaring assessment describes the wider economic opportunity and the infrastructure conditions that influence recovery. [2] Nigeria's awarded-site programme provides a separate example of the steps between a right to develop a flare site and an operating project. [1] Equipment suppliers therefore need to connect their offer with the customer's gas conditions and the responsibilities of the wider installation. John Zink and Zeeco describe recovery equipment within broader flare and vapour-control capabilities, illustrating why the buyer needs to establish the actual recovery package being proposed. [3][4] Through 2036, purchases are likely to depend on a workable gas outlet and dependable operating performance alongside the commercial value of the gas captured.
Key Market Trends & Insights
- Implementation obligations encourage awarded sites to progress toward executable projects.
- Unresolved financing and integration can keep a permit from becoming an equipment order.
- A defined capture package can make the wider recovery project easier to procure.
Regional Highlights
- US process-site buyers need to distinguish flare gas recovery from equipment that changes flare combustion alone, because capturing and reusing the gas introduces a receiving-process requirement as well as a controls and compression task (FMI outlook: 6.1% CAGR, 2026 to 2036).
- Iraqi associated-gas recovery projects need a practical connection between the capture equipment and an outlet that can use the recovered gas, making the wider process arrangement important to the equipment purchase (FMI outlook: 5.1% CAGR, 2026 to 2036).
- Russian site-recovery purchases depend on the characteristics of the gas stream and the requirements of the operation receiving the captured product, so equipment selection needs to remain closely connected with the existing process (FMI outlook: 5.1% CAGR, 2026 to 2036).
Market Size & Forecast
Table 1: Market Size and Forecast for Flare Gas Recovery System Market (USD billion and percentage), 2025 to 2036
| Metric | Value |
|---|---|
| 2025 market value | USD 1.3 billion |
| 2026 market value | USD 1.4 billion |
| 2036 market value | USD 2.3 billion |
| CAGR 2026 to 2036 | 5.1% |
| Revenue increase 2026 to 2036 | USD 0.9 billion |
| Market expansion 2026 to 2036 | 1.64 times |
Flare-gas recovery investment becomes a purchasing decision when a site has an identified gas stream and a receiving use for the captured product. The forecast reflects demand for the recovery package and its integration, with project financing, compression requirements and downstream readiness influencing the timing of equipment orders.
Customers assessing the destination of captured gas can also examine the storage-vessel configurations discussed in the CNG Tanks Cylinders Market.
Recovery projects and gas-use infrastructure
Flaring-reduction programmes create an implementation setting in which equipment must be connected with a practical gas-use project. Nigeria’s awarded sites and the World Bank’s wider assessment illustrate the project environment, while supplier documentation explains the engineering responsibilities within a recovery installation. [1][2][3]
Table 2: Industry evidence relevant to the flare gas recovery system market
| Indicator | Data point or observation | Market relevance | Source |
|---|---|---|---|
| Project implementation | NUPRC describes awarded flare sites and continuing obligations. | Site rights need to be connected with financing and an operating project. | [1] |
| Infrastructure conditions | The World Bank assesses flaring and the conditions for gas recovery. | A receiving use and supporting infrastructure affect project viability. | [2] |
| Recovery engineering | John Zink describes flare-gas recovery equipment and integration considerations. | Compression and site interfaces shape the equipment package. | [3] |
Analyst Perspective
"Compression equipment has to match the gas stream and the receiving process within a flare-gas recovery project. Suppliers need to connect the selected configuration with flow conditions and system interfaces, making commissioning and continuing service relevant to the value of the complete recovery package."
- Nikhil Kaitwade, Future Market Insights
How is the Flare Gas Recovery System Market segmented?
The market is segmented by Operating Pressure, Technology, Application, and Region.
The market is segmented by Operating Pressure, Technology, Application and Region, with the recovery package examined in relation to the gas stream and the receiving process at the operating site.
Why does the Up to 5 bar systems segment account for a substantial share of operating pressure demand?
Table 3: Operating Pressure Share for Flare Gas Recovery System Market (percentage share), 2026
| Operating Pressure | Scenario share estimate (2026) |
|---|---|
| Up to 5 bar systems | 44.0% |
| Other operating-pressure categories combined | 56.0% |
| Total | 100.0% |
Table 4: Segment Position and Market Growth for Flare Gas Recovery System Market, 2026 to 2036
| Metric | Value |
|---|---|
| Global CAGR (2026 to 2036) | 5.1% |
| Profiled operating pressure segment | Up to 5 bar systems |
- Systems operating at up to 5 bar represent an estimated 44.0% of pressure-category demand under the 2026 market scenario, reflecting the relevance of lower-pressure gas streams to recovery decisions at operating sites. A purchaser needs to define the incoming gas and the pressure required by the receiving process before selecting equipment, while the recovery arrangement must preserve the intended operation of the relief and flare system. John Zink describes back-pressure control and the evaluation of compression technology within its recovery offer. [3] Those requirements make system integration commercially important, because a package needs to fit the existing installation and provide a dependable route for handling the gas under the customer's specified operating conditions.
The Up to 5 bar systems segment accounts for an estimated 44.0% of operating pressure demand under the 2026 market scenario.
- The Up to 5 bar systems segment accounts for an estimated 44.0% of operating pressure demand in 2026.
- The pressure category should be assessed together with gas flow, composition and the requirements of the process receiving the recovered gas.
Why does the Compressor-based systems segment account for a substantial share of technology demand?
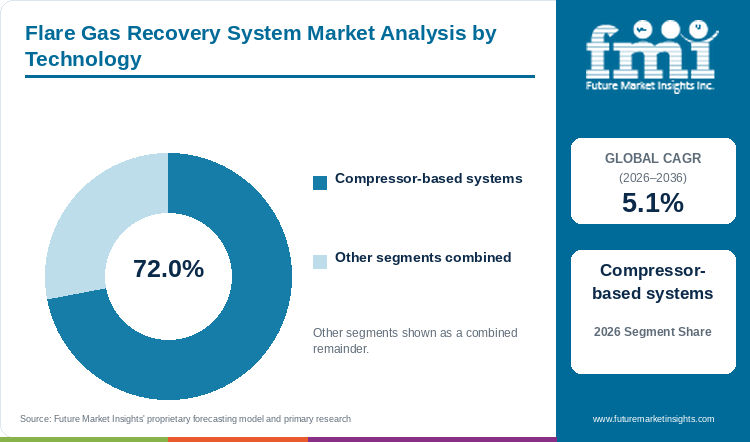
Table 5: Technology Share for Flare Gas Recovery System Market (percentage share), 2026
| Technology | Scenario share estimate (2026) |
|---|---|
| Compressor-based systems | 72.0% |
| Other recovery technologies combined | 28.0% |
| Total | 100.0% |
Compressor-based systems account for an estimated 72.0% of technology demand under the 2026 market scenario, bringing the selection of compression equipment into the wider engineering task of capturing and reusing flare gas. The buyer needs a configuration that fits the gas composition and flow conditions while remaining compatible with the flare and relief arrangement. John Zink describes the evaluation of alternative compression technologies, while Zeeco identifies flare gas recovery within its vapour-control offering. [3][4] Equipment selection consequently depends on the application and the support needed to bring the package into service, with performance expectations tied to an identifiable gas stream and receiving process rather than the nominal capacity of an isolated machine.
The Compressor-based systems segment accounts for an estimated 72.0% of technology demand under the 2026 market scenario.
- The Compressor-based systems segment accounts for an estimated 72.0% of technology demand in 2026.
- The equipment comparison needs to cover controls and site integration alongside the selected compressor configuration.
- Operating information from a recovery installation can connect with the decision-support applications examined in the Oil & Gas Analytics Market.
What are the drivers, restraints, and opportunities in the Flare Gas Recovery System Market?
A recoverable gas stream and an identifiable outlet create the basis for equipment demand, while integration with the flare and receiving process affects cost and timing. Suppliers can support implementation by defining package responsibilities clearly and providing the commissioning support needed for continuing operation.
Driver
A defined gas stream and an outlet capable of using recovered product create a practical requirement for capture, compression and associated controls. The World Bank’s assessment describes the wider economic and infrastructure conditions influencing flaring reduction. [2] Equipment demand develops when operators can connect those conditions with a funded project and a recovery package suited to the existing process site.
Restraint
A recovery package needs to operate within the relief and flare arrangement while delivering gas to an identifiable receiving process, making site integration a meaningful part of project cost and timing. John Zink describes application-specific compression and back-pressure considerations within recovery engineering. [3] Buyers consequently need to establish the operating envelope and downstream readiness before treating a proposed package as a dependable route to gas reuse.
Opportunity
Suppliers can strengthen a project by defining the equipment boundary and commissioning responsibilities clearly, helping the customer connect capture technology with the wider gas-use arrangement. Nigeria’s awarded-site programme illustrates a pipeline in which implementation work follows the initial award. [1] A provider able to explain the proposed configuration and the support available after installation can help buyers evaluate how the package will enter and remain in operation.
Commissioning and continuing checks create a related requirement for the measurement tools discussed in the Multifunction Calibrators Market.
Which country CAGRs are profiled in the Flare Gas Recovery System Market?
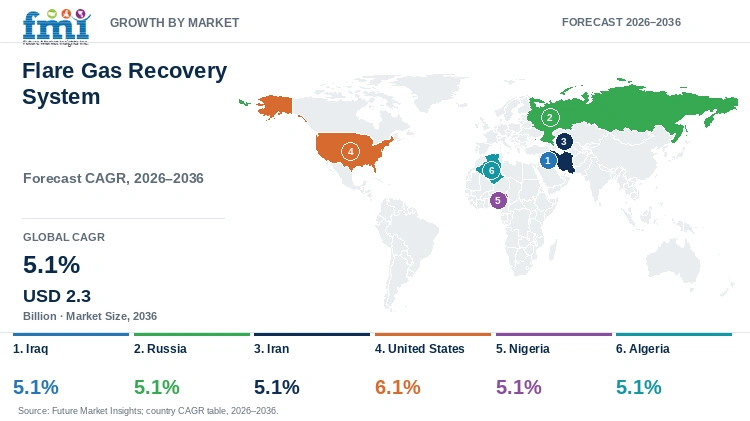
Table 6: Country CAGR Comparison for Flare Gas Recovery System Market (CAGR percentage), 2026 to 2036
| Country | CAGR |
|---|---|
| Iraq | 5.1% |
| Russia | 5.1% |
| Iran | 5.1% |
| United States | 6.1% |
| Nigeria | 5.1% |
| Algeria | 5.1% |
Country-wise Analysis
Iraq Flare Gas Recovery System Market Outlook (2026 to 2036)
Iraqi associated-gas recovery projects need a practical connection between the capture equipment and an outlet that can use the recovered gas, making the wider process arrangement important to the equipment purchase. The World Bank's global assessment describes the role of infrastructure and gas-market access in moving flaring-reduction opportunities toward implementation. [2] For a project buyer, the recovery package needs to be specified against an identifiable stream and its operating conditions, while responsibility for compression and the downstream connection must be clear. Suppliers can support that transition through engineering that fits the intended installation, with the commercial value of the package linked to a deliverable gas-handling arrangement rather than a general development announcement.
Russia Flare Gas Recovery System Market Outlook (2026 to 2036)
Russian site-recovery purchases depend on the characteristics of the gas stream and the requirements of the operation receiving the captured product, so equipment selection needs to remain closely connected with the existing process. A recovery package can involve compression and controls as well as a defined interface with the flare arrangement, giving the supplier an integration task alongside equipment delivery. John Zink's description of recovery technology illustrates the importance of back-pressure control and application-specific compression evaluation. [3] Buyers comparing configurations therefore need to examine the proposed operating envelope and the support available during commissioning, while the commercial opportunity depends on an identifiable project and a workable destination for the recovered gas.
Iran Flare Gas Recovery System Market Outlook (2026 to 2036)
Iranian retrofit opportunities require a recovery package that fits the operating site and a defined receiving process for the captured gas, with the division of engineering responsibility established before equipment selection. The World Bank's gas-flaring assessment discusses the infrastructure conditions that influence whether recovery can become an implemented project. [2] A buyer therefore needs to compare the proposed package with the actual gas stream and the requirements of the existing installation, while suppliers must explain how compression and controls will operate within that arrangement. The commercial proposition is strongest when the gas outlet and the commissioning responsibilities are clear, allowing the equipment purchase to be assessed against a practical route to continued operation.
United States Flare Gas Recovery System Market Outlook (2026 to 2036)
US process-site buyers need to distinguish flare gas recovery from equipment that changes flare combustion alone, because capturing and reusing the gas introduces a receiving-process requirement as well as a controls and compression task. The World Bank's 2026 assessment describes the relationship between gas infrastructure and reductions in flaring, providing context for the role of a dependable outlet. [2] Suppliers serving a recovery project consequently need a clear equipment boundary and a configuration suited to the customer's gas conditions, while the operator compares expected performance with the integration and maintenance obligations of the installation. Application engineering and continuing support therefore remain relevant alongside the initial quoted price of the recovery package.
Nigeria Flare Gas Recovery System Market Outlook (2026 to 2036)
Nigeria's awarded-site programme identifies a pipeline in which project rights and implementation obligations precede commissioned recovery equipment. NUPRC reported awards for 27 of 43 identified sites and described implementation progress as relevant to the continued use of permits. [1] A developer seeking to convert that opportunity into a purchase needs a gas stream and receiving outlet that can support a defined equipment specification, while suppliers need to understand the project's stage and the responsibilities attached to installation. The commercial transition therefore involves connecting the award with financing and engineering commitments, giving buyers a reason to compare the recovery package within the practical requirements of the wider project rather than the permit alone.
Algeria Flare Gas Recovery System Market Outlook (2026 to 2036)
Algerian recovery projects need an identifiable purchaser and a process capable of receiving the captured gas, which makes the destination of the product central to the system's commercial value. The World Bank's assessment of global flaring discusses infrastructure and gas-market conditions as practical influences on implementation. [2] Equipment suppliers consequently need to define the capture package and the interfaces with compression and downstream use, while the customer needs a clear account of what will be supplied and commissioned. A useful comparison also considers the operating envelope and support obligations, because the expected recovery benefit depends on a package that can function within the existing installation and continue serving the intended receiving process.
Who are the notable companies in the Flare Gas Recovery System Market?
John Zink Hamworthy Combustion; Zeeco; Honeywell UOP; Flowserve; Baker Hughes
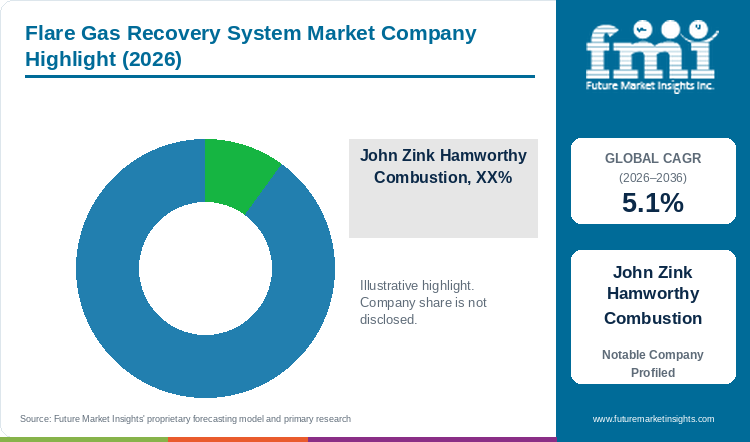
John Zink Hamworthy Combustion and Zeeco bring flare and recovery-system capabilities, while Honeywell UOP, Flowserve and Baker Hughes participate through related processing, flow-control and compression roles. The company comparison follows the equipment supplied and its connection with the site’s flare arrangement and receiving process.
Competitive Benchmarking: Flare Gas Recovery System Market
Table 7: Competitive positioning for the flare gas recovery system market
| Company | Positioning | Commercial distinction |
|---|---|---|
| John Zink Hamworthy Combustion | Flare-gas recovery equipment | Capture-package scope and site integration |
| Zeeco | Flare and recovery systems | Recovery configuration rather than combustion alone |
| Honeywell UOP | Gas-processing and recovery technology | Equipment boundary within the wider process |
| Flowserve | Flow-control and related equipment | Recovery-project component scope |
| Baker Hughes | Compression and gas technology | Recovery-specific equipment and operating fit |
Key Developments in the Flare Gas Recovery System Market
- NUPRC describes awarded sites and continuing implementation obligations. [1] Developers need to connect site rights with an operating project.
- The World Bank assesses global flaring and implementation conditions. [2] Operators seek a practical use for associated gas.
- John Zink and Zeeco describe current flare-gas recovery offerings. [3][4] Customers need equipment suited to their gas stream and flare interfaces.
Key Players in the Flare Gas Recovery System Market
Flare-gas recovery equipment
- John Zink Hamworthy Combustion
Flare and recovery systems
- Zeeco
Gas-processing and recovery technology
- Honeywell UOP
Flow-control and related equipment
- Flowserve
Compression and gas technology
- Baker Hughes
Flare Gas Recovery System Market Report Scope
Table 8: Report Scope for Flare Gas Recovery System Market, 2026 to 2036
| Coverage field | Report scope |
|---|---|
| Market definition | The market covers equipment that captures gas otherwise flared. Recovery systems are distinct from flare-combustion improvements and venting controls, as well as unrelated LNG infrastructure. |
| Quantitative units | USD billion |
| Historical reference year | 2025 |
| Forecast period | 2026 to 2036 |
| Market breakdown | Operating Pressure; Technology; Application; Region |
| Countries profiled | Iraq; Russia; Iran; United States; Nigeria; Algeria |
| Regions covered | North America; Latin America; Western Europe; Eastern Europe; East Asia; South Asia and Pacific; Middle East and Africa |
| Key companies profiled | John Zink Hamworthy Combustion; Zeeco; Honeywell UOP; Flowserve; Baker Hughes |
Flare Gas Recovery System Market Research Methodology
Table 9: Research Methodology for Flare Gas Recovery System Market, 2026 edition
| Method | Approach |
|---|---|
| Market definition | The market covers equipment that captures gas otherwise flared. Recovery systems are distinct from flare-combustion improvements and venting controls, as well as unrelated LNG infrastructure. |
| Secondary research | Public institutional reports, regulator publications, technical literature and supplier documentation provide the operating context for the market. |
| Quantitative coverage | Market values are expressed in USD billion, with a 2025 base value, a 2026 estimate and a projection for 2036. |
| Segment and country assessment | Segment categories retain distinct demand measures, while each country profile is linked with its estimated CAGR for 2026 to 2036. |
| Company comparison | Representative participants are compared by the product or service offered, the customer application and the implementation requirements relevant to procurement. |
Flare Gas Recovery System Market by Segments
Flare Gas Recovery System Market segmented by Operating Pressure:
- Up to 5 bar
- 5 to 10 bar
- Above 10 bar
Flare Gas Recovery System Market segmented by Technology:
- Compressor-based systems
- Reciprocating configurations
- Screw configurations
- Liquid-ring configurations
- Ejector-based systems
- Other recovery technologies
- Reciprocating configurations
Flare Gas Recovery System Market segmented by Application:
- Oil and gas
- Petrochemical and refining operations
- Natural-gas liquids plants
- Biogas and landfill operations
Flare Gas Recovery System Market by Region
- North America
- United States
- Canada
- Latin America
- Brazil
- Mexico
- Argentina
- Chile
- Western Europe
- Germany
- France
- United Kingdom
- Italy
- Spain
- Benelux
- Nordics
- Eastern Europe
- Poland
- Czech Republic
- Romania
- Hungary
- East Asia
- China
- Japan
- South Korea
- South Asia and Pacific
- India
- ASEAN
- Australia and New Zealand
- Middle East and Africa
- GCC Countries
- South Africa
- Türkiye
- Israel
Research Sources and Bibliography
- [1] Nigerian Upstream Petroleum Regulatory Commission. 2026-09-09. Awardees may lose unused flare-gas permits
- [2] World Bank. Accessed 16 October 2026. 2026 Global Gas Flaring Tracker Report
- [3] John Zink. Accessed 16 October 2026. Flare Gas Recovery
- [4] Zeeco. Accessed 16 October 2026. Vapor Control
This Report Answers
- How large is the Flare Gas Recovery System Market in 2026?
- What is the growth outlook for the Flare Gas Recovery System Market through 2036?
- What is the 2026 share of Up to 5 bar systems?
- What is the 2026 share of Compressor-based systems?
- Which profiled market has the highest projected growth?
- Who are the notable participants in the Flare Gas Recovery System Market?
Frequently Asked Questions
How large is the Flare Gas Recovery System Market in 2026?
The market is estimated at USD 1.4 billion in 2026, compared with USD 1.3 billion in 2025.
What is the growth outlook for the Flare Gas Recovery System Market through 2036?
The market is projected to reach USD 2.3 billion by 2036, representing a CAGR of 5.1% from 2026 to 2036.
What is the 2026 share of Up to 5 bar systems?
The Up to 5 bar systems segment is estimated to account for 44% of operating pressure demand under the 2026 market scenario. The pressure category should be assessed together with gas flow, composition and the requirements of the process receiving the recovered gas.
What is the 2026 share of Compressor-based systems?
The Compressor-based systems segment is estimated to account for 72% of technology demand under the 2026 market scenario. The equipment comparison needs to cover controls and site integration alongside the selected compressor configuration.
Which profiled market has the highest projected growth?
United States has the highest projected rate among the markets profiled, at 6.1% CAGR from 2026 to 2036.
Who are the notable participants in the Flare Gas Recovery System Market?
Representative participants include John Zink Hamworthy Combustion, Zeeco, Honeywell UOP, Flowserve, Baker Hughes.
Preview the report firsthand - request a free sample
Get SampleGet the brochure for pricing and purchase details.
Get PDFTable of Content
- Key Takeaways
- Market Size and CAGR
- Top Growth Driver
- Fastest Growing Segment
- Leading Region
- Key Companies
- Emerging Opportunities
- Executive Summary
- Global Market Outlook
- Demand-side Trends
- Supply-side Trends
- Technology Roadmap Analysis
- Analysis and Recommendations
- Analyst Perspective (What is happening? Why now? What should investors know?)
- Key Questions Answered
- How large is the market?
- What is the CAGR?
- What are key trends?
- Which region dominates?
- Who are the leaders?
- Market Overview
- Market Coverage / Taxonomy
- Market Definition / Scope / Limitations
- Research Methodology
- Chapter Orientation
- Analytical Lens and Working Hypotheses
- Market Structure, Signals, and Trend Drivers
- Benchmarking and Cross-market Comparability
- Market Sizing, Forecasting, and Opportunity Mapping
- Research Design and Evidence Framework
- Desk Research Programme (Secondary Evidence)
- Expert Input and Fieldwork (Primary Evidence)
- Tooling, Models, and Reference Databases
- Data Engineering and Model Build
- Quality Assurance and Audit Trail
- Market Background
- Market Dynamics (Drivers, Restraints, Opportunity, Trends)
- Scenario Forecast (Optimistic, Likely, Conservative)
- Impact Analysis
- AI Impact
- Sustainability Impact
- Regulatory Impact
- Technology Impact
- Consumer / Buyer Analysis
- Purchase Drivers
- Adoption Barriers
- Buyer Journey
- Opportunity Map Analysis
- Product Life Cycle Analysis
- Supply Chain Analysis
- Investment Feasibility Matrix
- Value Chain Analysis
- PESTLE and Porter's Analysis
- Regulatory Landscape
- Regional Parent Market Outlook
- Production and Consumption Statistics
- Import and Export Statistics
- Global Market Analysis and Forecast, 2021 to 2036
- Historical Market Size Value (USD Billion) Analysis, 2021 to 2025
- Current and Future Market Size Value (USD Billion) Projections, 2026 to 2036
- Y-o-Y Growth Trend Analysis
- Absolute $ Opportunity Analysis
- Global Market Pricing Analysis, 2021 to 2036
- Global Market Analysis and Forecast, By Operating Pressure, 2021 to 2036
- Introduction / Key Findings
- Historical Market Size Value (USD Billion) Analysis By Operating Pressure, 2021 to 2025
- Current and Future Market Size Value (USD Billion) Analysis and Forecast By Operating Pressure, 2026 to 2036
- Up to 5 bar
- 5 to 10 bar
- Above 10 bar
- Y-o-Y Growth Trend Analysis By Operating Pressure, 2021 to 2025
- Absolute $ Opportunity Analysis By Operating Pressure, 2026 to 2036
- Global Market Analysis and Forecast, By Technology, 2021 to 2036
- Introduction / Key Findings
- Historical Market Size Value (USD Billion) Analysis By Technology, 2021 to 2025
- Current and Future Market Size Value (USD Billion) Analysis and Forecast By Technology, 2026 to 2036
- Compressor-based systems
- Reciprocating configurations
- Screw configurations
- Liquid-ring configurations
- Ejector-based systems
- Other recovery technologies
- Y-o-Y Growth Trend Analysis By Technology, 2021 to 2025
- Absolute $ Opportunity Analysis By Technology, 2026 to 2036
- Global Market Analysis and Forecast, By Application, 2021 to 2036
- Introduction / Key Findings
- Historical Market Size Value (USD Billion) Analysis By Application, 2021 to 2025
- Current and Future Market Size Value (USD Billion) Analysis and Forecast By Application, 2026 to 2036
- Oil and gas
- Petrochemical and refining operations
- Natural-gas liquids plants
- Biogas and landfill operations
- Y-o-Y Growth Trend Analysis By Application, 2021 to 2025
- Absolute $ Opportunity Analysis By Application, 2026 to 2036
- Global Market Analysis and Forecast, By Region, 2021 to 2036
- Introduction
- Historical Market Size Value (USD Billion) Analysis By Region, 2021 to 2025
- Current Market Size Value (USD Billion) Analysis and Forecast By Region, 2026 to 2036
- North America
- Latin America
- Western Europe
- Eastern Europe
- East Asia
- South Asia and Pacific
- Middle East and Africa
- Market Attractiveness Analysis By Region
- North America Market Analysis and Forecast, By Country, 2021 to 2036
- Historical Market Size Value (USD Billion) Trend Analysis By Market Taxonomy, 2021 to 2025
- Market Size Value (USD Billion) Forecast By Market Taxonomy, 2026 to 2036
- By Country
- United States
- Canada
- By Operating Pressure
- By Technology
- By Application
- By Country
- Market Attractiveness Analysis
- By Country
- By Operating Pressure
- By Technology
- By Application
- Key Takeaways
- Latin America Market Analysis and Forecast, By Country
- Historical Market Size Value (USD Billion) Trend Analysis By Market Taxonomy, 2021 to 2025
- Market Size Value (USD Billion) Forecast By Market Taxonomy, 2026 to 2036
- By Country
- Brazil
- Mexico
- Argentina
- Chile
- By Operating Pressure
- By Technology
- By Application
- By Country
- Market Attractiveness Analysis
- By Country
- By Operating Pressure
- By Technology
- By Application
- Key Takeaways
- Western Europe Market Analysis and Forecast, By Country
- Historical Market Size Value (USD Billion) Trend Analysis By Market Taxonomy, 2021 to 2025
- Market Size Value (USD Billion) Forecast By Market Taxonomy, 2026 to 2036
- By Country
- Germany
- France
- United Kingdom
- Italy
- Spain
- Benelux
- Nordics
- By Operating Pressure
- By Technology
- By Application
- By Country
- Market Attractiveness Analysis
- By Country
- By Operating Pressure
- By Technology
- By Application
- Key Takeaways
- Eastern Europe Market Analysis and Forecast, By Country
- Historical Market Size Value (USD Billion) Trend Analysis By Market Taxonomy, 2021 to 2025
- Market Size Value (USD Billion) Forecast By Market Taxonomy, 2026 to 2036
- By Country
- Russia
- Poland
- Czech Republic
- Romania
- Hungary
- By Operating Pressure
- By Technology
- By Application
- By Country
- Market Attractiveness Analysis
- By Country
- By Operating Pressure
- By Technology
- By Application
- Key Takeaways
- East Asia Market Analysis and Forecast, By Country
- Historical Market Size Value (USD Billion) Trend Analysis By Market Taxonomy, 2021 to 2025
- Market Size Value (USD Billion) Forecast By Market Taxonomy, 2026 to 2036
- By Country
- China
- Japan
- South Korea
- By Operating Pressure
- By Technology
- By Application
- By Country
- Market Attractiveness Analysis
- By Country
- By Operating Pressure
- By Technology
- By Application
- Key Takeaways
- South Asia and Pacific Market Analysis and Forecast, By Country
- Historical Market Size Value (USD Billion) Trend Analysis By Market Taxonomy, 2021 to 2025
- Market Size Value (USD Billion) Forecast By Market Taxonomy, 2026 to 2036
- By Country
- India
- ASEAN
- Australia and New Zealand
- By Operating Pressure
- By Technology
- By Application
- By Country
- Market Attractiveness Analysis
- By Country
- By Operating Pressure
- By Technology
- By Application
- Key Takeaways
- Middle East and Africa Market Analysis and Forecast, By Country
- Historical Market Size Value (USD Billion) Trend Analysis By Market Taxonomy, 2021 to 2025
- Market Size Value (USD Billion) Forecast By Market Taxonomy, 2026 to 2036
- By Country
- Nigeria
- Iraq
- Iran
- Algeria
- GCC Countries
- South Africa
- Türkiye
- Israel
- By Operating Pressure
- By Technology
- By Application
- By Country
- Market Attractiveness Analysis
- By Country
- By Operating Pressure
- By Technology
- By Application
- Key Takeaways
- Key Countries Market Analysis
- United States
- Pricing Analysis
- Market Share Analysis, 2025
- By Operating Pressure
- By Technology
- By Application
- Canada
- Pricing Analysis
- Market Share Analysis, 2025
- By Operating Pressure
- By Technology
- By Application
- Mexico
- Pricing Analysis
- Market Share Analysis, 2025
- By Operating Pressure
- By Technology
- By Application
- Brazil
- Pricing Analysis
- Market Share Analysis, 2025
- By Operating Pressure
- By Technology
- By Application
- Chile
- Pricing Analysis
- Market Share Analysis, 2025
- By Operating Pressure
- By Technology
- By Application
- Germany
- Pricing Analysis
- Market Share Analysis, 2025
- By Operating Pressure
- By Technology
- By Application
- United Kingdom
- Pricing Analysis
- Market Share Analysis, 2025
- By Operating Pressure
- By Technology
- By Application
- Italy
- Pricing Analysis
- Market Share Analysis, 2025
- By Operating Pressure
- By Technology
- By Application
- Spain
- Pricing Analysis
- Market Share Analysis, 2025
- By Operating Pressure
- By Technology
- By Application
- France
- Pricing Analysis
- Market Share Analysis, 2025
- By Operating Pressure
- By Technology
- By Application
- India
- Pricing Analysis
- Market Share Analysis, 2025
- By Operating Pressure
- By Technology
- By Application
- ASEAN
- Pricing Analysis
- Market Share Analysis, 2025
- By Operating Pressure
- By Technology
- By Application
- Australia and New Zealand
- Pricing Analysis
- Market Share Analysis, 2025
- By Operating Pressure
- By Technology
- By Application
- China
- Pricing Analysis
- Market Share Analysis, 2025
- By Operating Pressure
- By Technology
- By Application
- Japan
- Pricing Analysis
- Market Share Analysis, 2025
- By Operating Pressure
- By Technology
- By Application
- South Korea
- Pricing Analysis
- Market Share Analysis, 2025
- By Operating Pressure
- By Technology
- By Application
- Russia
- Pricing Analysis
- Market Share Analysis, 2025
- By Operating Pressure
- By Technology
- By Application
- Poland
- Pricing Analysis
- Market Share Analysis, 2025
- By Operating Pressure
- By Technology
- By Application
- Hungary
- Pricing Analysis
- Market Share Analysis, 2025
- By Operating Pressure
- By Technology
- By Application
- Türkiye
- Pricing Analysis
- Market Share Analysis, 2025
- By Operating Pressure
- By Technology
- By Application
- South Africa
- Pricing Analysis
- Market Share Analysis, 2025
- By Operating Pressure
- By Technology
- By Application
- Iraq
- Pricing Analysis
- Market Share Analysis, 2025
- By Operating Pressure
- By Technology
- By Application
- Iran
- Pricing Analysis
- Market Share Analysis, 2025
- By Operating Pressure
- By Technology
- By Application
- Nigeria
- Pricing Analysis
- Market Share Analysis, 2025
- By Operating Pressure
- By Technology
- By Application
- Algeria
- Pricing Analysis
- Market Share Analysis, 2025
- By Operating Pressure
- By Technology
- By Application
- United States
- Market Structure Analysis
- Competition Dashboard
- Competition Benchmarking
- Market Share Analysis of Top Players
- By Regional
- By Operating Pressure
- By Technology
- By Application
- Emerging Startups
- Innovation Benchmarking
- Competition Analysis
- Competition Deep Dive
- John Zink Hamworthy Combustion
- Overview
- Product Portfolio
- Profitability by Market Segments
- Sales Footprint
- Strategy Overview
- Marketing Strategy
- Product Strategy
- Channel Strategy
- Zeeco
- Honeywell UOP
- Flowserve
- Baker Hughes
- John Zink Hamworthy Combustion
- Case Studies
- Success Stories
- Recent Developments
- Competition Deep Dive
- Assumptions & Acronyms Used


