

- Market Size (2026)
- USD 2860.7 Mn
- Forecast (2036)
- USD 5319.7 Mn
- CAGR (2026 to 2036)
- 6.4%
How big is the heat shrink kits market size?
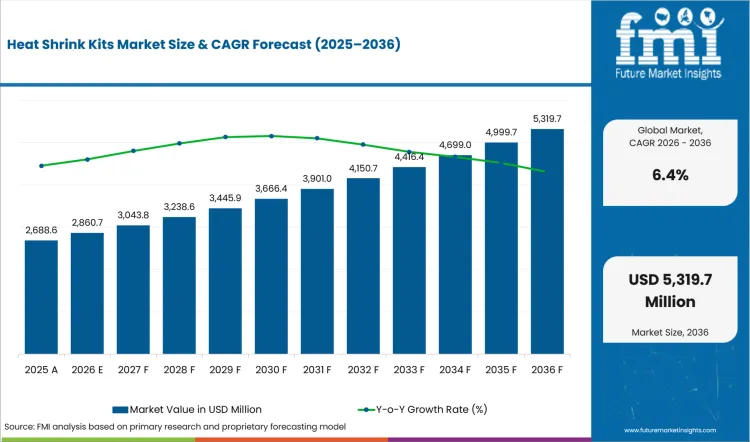
USD 2,860.7 million in 2026 and USD 5,319.7 million by 2036 at a 6.4% CAGR.
Demand for heat shrink kits is projected to expand at 6.4% CAGR between 2026 and 2036, increasing valuation from USD 2,860.7 million in 2026 to USD 5,319.7 million by 2036. Reliable electrical infrastructure depends on qualifying heat shrink kits around sleeve recovery with voltage-class documentation. Consistent clean energy growth directly fuels cable accessory demand across new grid connection projects. IRENA reported in March 2026 stating renewables accounted for 85.6% of annual global power additions in 2025. Such high deployment volume naturally increases requirements for dependable cable termination components across newly connected energy systems.
International project success requires matching specific regional operational preferences. India and China utility enterprises prioritize local kit stock alongside voltage-class coverage during repair programs. The United Kingdom and Germany organizations assess installation records alongside sealing proof before completing vendor approvals. Adapting toward regional expectations proves significant since global infrastructure operations connect increasingly growing clean energy networks. International Energy Agency reported in 2025 noting renewable power capacity is projected to increase almost 4,600 GW between 2025 and 2030. This projected growth reinforces long-term demand for cable termination hardware supporting renewable power connections worldwide.
| Metric | Value |
|---|---|
| 2025 Market Size | USD 2,688.6 million |
| 2026 Market Size | USD 2,860.7 million |
| 2036 Market Size | USD 5,319.7 million |
| Forecast CAGR (2026-2036) | 6.4% |
| Voltage Rating Focus | Medium voltage |
| Medium voltage Share (2026) | 46.0% |
| Sales Channel Focus | Electrical distributors |
| Electrical distributors Share (2026) | 39.0% |
| End Use Focus | Utilities |
| Utilities Share (2026) | 33.0% |
Summary of the Heat Shrink Kits Market
| Market Signal | Commercial Impact |
|---|---|
| Demand and Growth Drivers | Purchasing for heat shrink kits is estimated to rise as utilities connect cable repair with moisture exclusion. Account decisions are expected to reflect kit completeness and distributor response across repeat field programs.
|
| Product and Segment View | Segment demand is led by medium voltage kits and utilities needing repeat cable accessory performance. Specification work is anticipated to focus on packaged kits designed for shorter approval cycles and field installation clarity.
|
| Geography and Growth Outlook | Country demand is likely to improve across markets investing in grid repair and renewable power connections. Supplier gains are projected to reflect distributor access, installer training, and cable accessory proof.
|
| Competitive Landscape | Competition is likely to focus on cable accessory breadth and installation support. Suppliers are expected to acquire accounts in favor with documented sleeve performance and distributor coverage.
|
| Analyst Perspective | Heat shrink kits are developing into a specification-led cable accessory group linked to utility uptime and installation discipline. Supplier progress is projected to improve led by kit packing and field support aligned with utility and contractor requirements.
|
Source: Future Market Insights analysis, 2026.
How is the heat shrink kits market segmented?
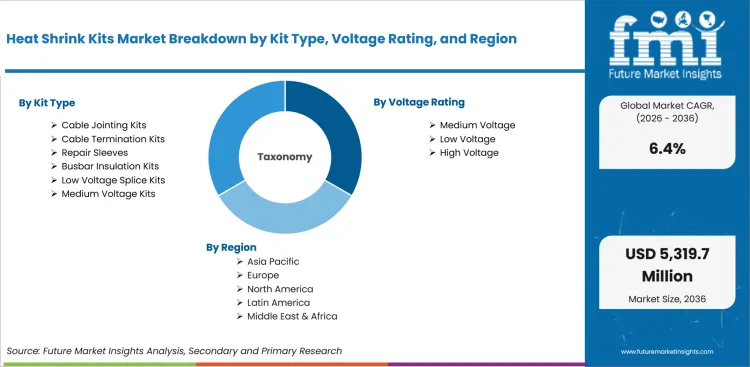
The heat shrink kits market is segmented by kit type, voltage rating, component, application, end use, sales channel, and region.
The heat shrink kits industry is segmented by kit type, voltage rating, component, application, end use, sales channel, and region. Kit type coverage includes cable jointing kits, cable termination kits, repair sleeves, busbar insulation kits, low voltage splice kits, and medium voltage kits. Voltage rating coverage includes low voltage, medium voltage, and high voltage. Component coverage includes heat shrink tubes, mastic or sealants, stress control tubes, connector or lug accessories, and cleaning and installation accessories. Application coverage includes underground cable joints, overhead line termination, industrial power distribution, utilities and grid repair, and renewable energy cabling. End-use coverage includes utilities, industrial facilities, EPC or contractors, renewable energy, and telecom or rail. Sales channel coverage includes electrical distributors, direct OEM, EPC or project supply, and utility framework contracts. Regional coverage includes North America, Latin America, Western Europe, Eastern Europe, East Asia, South Asia and Pacific, and Middle East and Africa.
Why do cable jointing kits lead kit type demand?
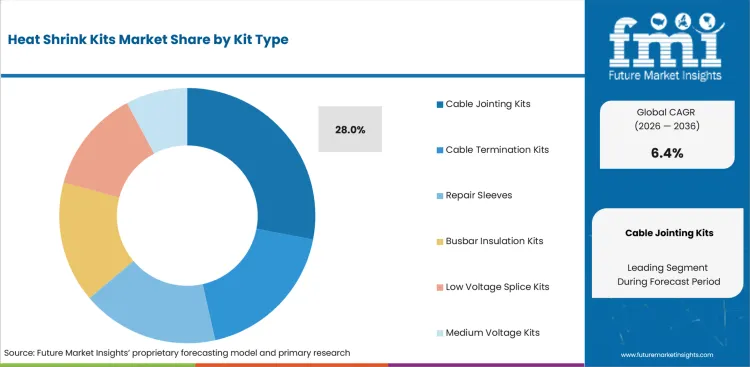
3M reported in 2025 stating its MV heat shrink splice kits are available for 11 kV, 22 kV, and 33 kV joints, impacting cable jointing kit selection across common medium voltage networks. Cable jointing kits are anticipated to influence demand as utilities and contractors prefer packaged sleeves and accessories for field cable closure. Installer teams are likely to compare connector compatibility and moisture sealing before kit approval.
- In 2026, cable jointing kits are predicted to secure 28.0% share due to packaged sealant and cleaning accessory needs. Installers prefer kit-based formats once cable diameter and joint closure records affect field timing.
- Cable termination kits and repair sleeves are expected to retain service value. Cable jointing kits gain preference after crews need sleeve recovery and sealing materials in one approved pack.
What makes medium voltage work important for heat shrink suppliers?
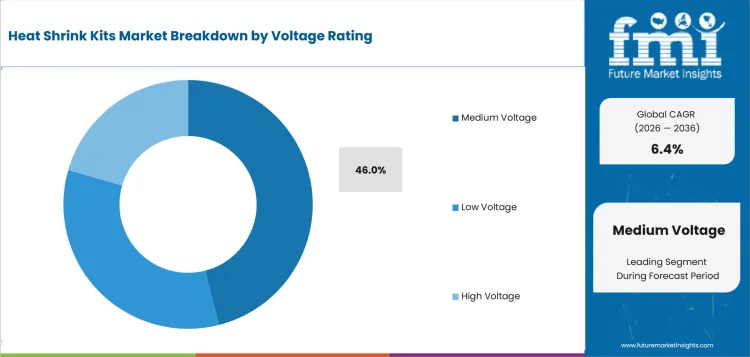
Medium voltage kits are expected to guide purchasing as distribution networks require electrical stress control and stronger insulation around joints. Buyers are likely to compare anti-tracking tube performance and installation skill requirements before field use. International Energy Agency reported on February 2025 noting its transmission survey covered lines above 66 kV, strengthening medium voltage accessory review around higher-load distribution corridors.
- Medium voltage is anticipated to garner 46.0% share in 2026, reflected by distribution cable work needing stress-control tubes and recovered sleeves. Suppliers acquire account approval on kit instructions supporting trained field installation.
- Low voltage and high voltage applications serve different maintenance needs. Medium voltage designs gain attention as utility teams compare insulation strength and moisture protection across repeat distribution jobs.
Why do heat shrink tubes remain the core component?
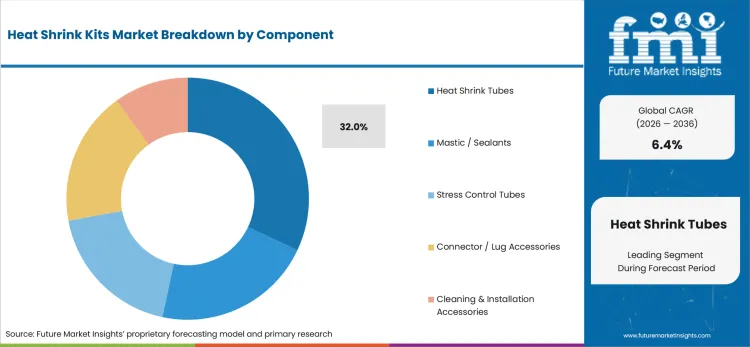
HellermannTyton reported in 2025 noting heat shrink tubing shrink ratios range from 2:1 to 6:1, influencing tube selection around cable diameter variation and installer inventory planning. Heat shrink tubes are estimated to influence component selection as the tube forms the main protective layer around cable joints and terminations. Cable accessory teams assess recovered wall thickness and sealing contact before approving kits for field use.
- Based on the core component, heat shrink tubes are forecast to hold 32.0% share in 2026 since it has direct use as the sleeve closing around cable connections. Account teams prefer tubes supported by clear size charts and recovered-diameter evidence.
- Connector or lug accessories and cleaning accessories support full kit performance. Heat shrink tubes achieve selection preference for buyers needing one main insulating layer around prepared cable work.
How do underground cable joints create repeat demand?
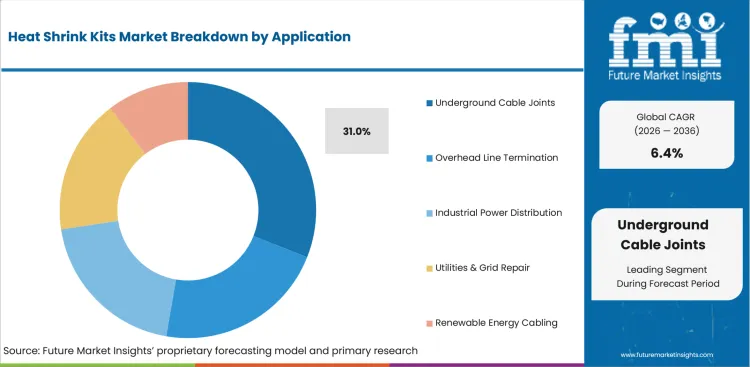
Underground cable joints are projected to promote application as buried connections need moisture exclusion and mechanical protection after field installation. Crews are expected to assess sleeve bonding and sealant contact before trench closure or access restoration. Yamuna Power & Infrastructure reported in 2025 stating heat shrinkable power cable jointing systems are offered from 1.1 kV onwards, promoting underground joint demand across long-length cable continuity work.
- Underground cable joints are predicted to account for 31.0% share of application in 2026, backed by buried cable repair and distribution extension work. Buyers prefer kits with clear heat application steps and sealing material compatibility.
- Overhead line termination and industrial power distribution retain commercial use. Underground cable joints secure account attention after access limits make first-time installation quality more valuable.
Why do utilities lead end-use demand?
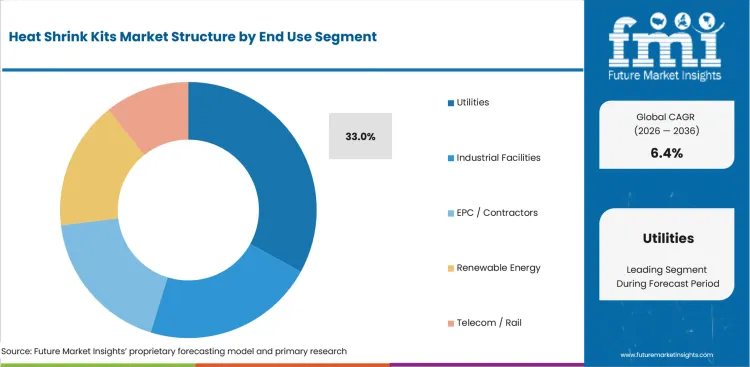
Utilities are anticipated to propel heat shrink kit adoption as network owners repeat termination and repair work across distribution assets. Buyer teams are likely to prioritize familiar kit sizes and proven sealing behavior before wider field use. Department for Energy Security and Net Zero reported on June 2026 announcing renewable electricity generation of 43.7 TWh in Q1 2026, increasing utility review of cable protection around clean-power connections.
- By end-use, utilities are estimated to capture 33.0% share in 2026 owing to network maintenance and distribution project work. Utility teams prefer kit lines with stable availability and installer-ready documentation.
- Industrial facilities and EPC or contractors serve project and maintenance profiles. Utilities gain preference on repeat field work demands standard kits and dependable distributor response.
Why do electrical distributors remain the leading sales channel?
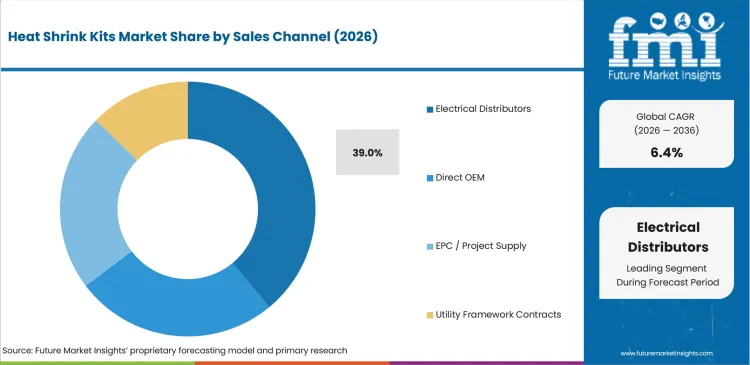
Electrical distributors are projected to propel demand as cable repairs often need standard kits close to active worksites. Contractors are expected to seek voltage rating and termination accessory access before field dispatch. 3M reported in 2025 noting its support for medium and high voltage cable accessories covers 5 kV to 145 kV, impacting distributor need for technical assistance around kit selection.
- Electrical distributors are expected to account for 39.0% share in 2026, aided by stocked kit access and contractor purchasing habits. Field teams prefer distributor channels once urgent repair work needs common sizes without long waits.
- EPC or project supply and utility framework contracts address larger program needs. Electrical distributors gain attention once recurring repair crews need kit familiarity and local availability.
What are the drivers, restraints, and opportunities in the heat shrink kits market?
Near-term purchases are shaped by product availability and service-led adoption routes outlined below.
- Driver: Distribution repair and industrial power work are lifting use of sleeves used to insulate and seal field connections.
- Restraint: Poor cable preparation or wrong sleeve sizing may reduce expected kit protection.
- Opportunity: Renewable energy cabling and industrial facilities are opening demand for kits combining stress-control parts and connector accessories.
Expanding electrical networks require highly secure and dependable seals after new power connections are added in the field. International Energy Agency reported in October 2025 announcing annual renewable capacity additions rising from 683 GW in 2024 to almost 890 GW in 2030. Massive increases in clean energy infrastructure give kit suppliers a clear base for ongoing renewable cabling support.
Ensuring standard installation methods actually deliver the expected level of long-term cable protection remains a major hurdle for field crews. Occupational Safety and Health Administration reported on April 2026 noting Control of Hazardous Energy ranked 4th among fiscal year 2025 most cited standards. Safety violations of such high frequency naturally raise the training focus around field cable work and accessory installation evidence.
Fresh growth paths open up as electrical power grids upgrade to handle much larger volumes of green energy. IEA Renewable Energy Progress Tracker stated on December 2025 noting cumulative onshore wind capacity additions are expected to reach 732 GW during 2025 to 2030. Rapid development of wind farms creates a continuous need for protected terminations across regional connection programs.
What country CAGRs are profiled in the heat shrink kits market?
.webp "Top Country Growth Comparison Heat Shrink Kits Market Cagr (2026 2036)")
| Country | CAGR |
|---|---|
| India | 8.3% |
| China | 7.5% |
| Brazil | 6.0% |
| United Kingdom | 5.8% |
| United States | 5.5% |
| Germany | 5.1% |
| Japan | 4.8% |
Source: Future Market Insights analysis, 2026.
How do country-level CAGRs compare in the heat shrink kits market?
Country demand in heat shrink kits is expected to be guided by renewable cabling and distributor availability. India and China are likely to connect demand with transmission buildout and renewable capacity additions. Brazil and United Kingdom are anticipated to connect adoption with energy system renewal and renewable power connections. United States, Germany, and Japan are projected to connect demand with grid modernization and longer qualification cycles.
- India heat shrink kit sector is predicted to scale at 8.3% CAGR between 2026 and 2036, influenced by transmission additions and local distributor access. Press Information Bureau reported on January 2026 claiming India added 6,511 ckm of 220 kV and above transmission lines in 2025, promoting jointing kit demand across utility field work. Local suppliers are expected to secure account attention through common kit sizes and shorter response cycles.
- China heat shrink kit industry is projected to be influenced by renewable capacity scale and distribution network depth. National Energy Administration reported on January 2025 announcing China added 373 million kW of renewable energy capacity in 2024, impacting cable accessory needs across renewable interconnection work. Sales in China are forecast to expand at 7.5% CAGR from 2026 to 2036, backed by utility expansion and local heat shrink material availability.
- Brazil accounts are likely to expand around utility repair and distributor-led field access. Empresa de Pesquisa Energética reported in 2025 noting Brazil renewable sources represented 50.0% of its energy matrix in 2024, reinforcing cable protection needs across renewable and grid maintenance programs. Demand in Brazil is projected at 6.0% CAGR through 2036, helped by energy system renewal and power distribution work.
- Sales in the United Kingdom are estimated to post 5.8% CAGR by 2036, shaped by renewable cabling and contractor-led utility maintenance. Office for National Statistics reported on March 2025 stating electricity and air conditioning supply output grew 2.4% in 2024, supporting field accessories used around energy infrastructure maintenance. Installer teams are expected to value kit packing and sealing guidance across planned repair work.
- United States purchasing is anticipated to reflect grid additions and utility-scale power connections. USA Energy Information Administration reported on February 2026 stating developers added 53 GW of new capacity to the grid in 2025, propelling cable accessory needs around new power sites. The market in United States is expected to scale at 5.5% CAGR through 2036, guided by replacement work and utility project schedules.
- Industry in Germany is expected to expand at 5.1% CAGR between 2026 and 2036, reinforced by disciplined grid planning and renewable integration. Bundesnetzagentur reported on January 8, 2026 announcing renewable installed capacity increased by nearly 21 GW in 2025, supporting medium voltage cable accessories across connection and repair programs. German buyers are likely to review kit evidence and installer records before wider account use.
- Japan heat shrink kit demand is likely to be guided by constrained installation space, and long qualification cycles. Ministry of Economy, Trade and Industry reported in 2025 stating Japan energy self-sufficiency stood at 15.3%, keeping energy security planning close to power network reliability. Sector in Japan is projected to post 4.8% CAGR during the forecast period, shaped by careful supplier approval and field performance records.
Who are the notable companies in the heat shrink kits market?
TE Connectivity, 3M, nVent, HellermannTyton, Raychem RPG, Prysmian Group, Nexans, Sumitomo Electric Industries, Yamuna Power & Infrastructure, and Shenzhen Woer Heat-Shrinkable Material are expected to shape demand.
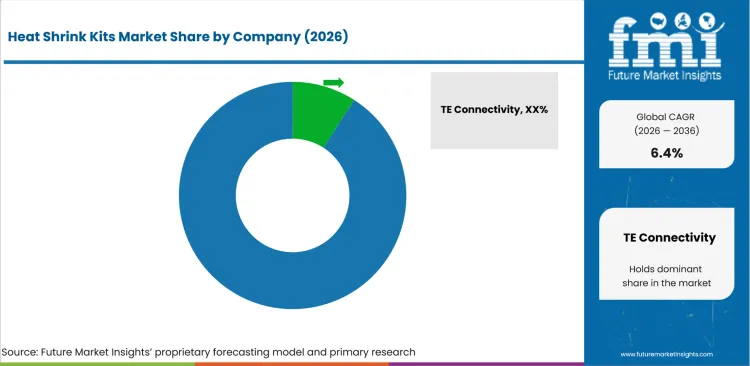
Competition in heat shrink kits is anticipated to center on cable accessory coverage and regional service reach. Account teams are likely to compare suppliers based on sleeve recovery evidence and ability to support repeat field programs after initial approval. TE Connectivity and Raychem RPG are expected to receive review attention due to heat shrink material knowledge and cable accessory support. Prysmian Group and nVent are projected to compete through cable system knowledge and project assistance. Yamuna Power & Infrastructure and Shenzhen Woer Heat-Shrinkable Material are estimated to support account demand led by regional availability and installer familiarity.
- TE Connectivity and Raychem RPG are expected to gain account attention based on cable accessory depth and heat shrink knowledge. Power accessory experience is likely to promote programs needing voltage-class documentation and repeat installation discipline.
- Prysmian Group and nVent are anticipated to compete led by engineering service and project support. Their role is projected to improve as utilities review installation files and channel availability before approval.
- Yamuna Power & Infrastructure and Shenzhen Woer Heat-Shrinkable Material are forecast to support demand driven by regional access and material familiarity. Local availability is expected to help accounts compare kit compatibility and field-service response.
- Specialist suppliers are estimated to gain review strength due to customization and service proximity. Supplier access is likely to improve as contractors need validated cable protection support for narrow installation schedules.
Competitive Benchmarking: Heat Shrink Kits Market
| Company | Portfolio Depth | Kit Format Match | Application Support | Service Reach |
|---|---|---|---|---|
| TE Connectivity | High | High | High | Global |
| 3M | High | High | High | Global |
| HellermannTyton | Medium | High | Medium | Global |
| Raychem RPG | High | High | High | Regional/Global |
| Prysmian Group | High | Medium | High | Global |
| Nexans | High | Medium | High | Global |
| Sumitomo Electric Industries | Medium | Medium | Medium | Global |
| nVent | Medium | Medium | Medium | Global |
| Yamuna Power & Infrastructure | Medium | Medium | Medium | Regional |
| Shenzhen Woer Heat-Shrinkable Material | Medium | High | Medium | Regional/Global |
Source: Future Market Insights competitive analysis, 2026.
Key Developments in the Heat Shrink Kits Market
- In August 2025, TE Connectivity presented power cable accessories at Intersolar South America 2025 in Sao Paulo. TE Connectivity reported on August 26-28, 2025 noting its power cable accessories cover low or medium and high-voltage applications using heat-shrink and casting technologies, strengthening project support across solar grid connections.
- In November 2025, TE Connectivity presented electrical solutions at SPS 2025 in Nuremberg. TE Connectivity reported on November 25-27, 2025 stating heat shrink tubing is available in up to 6 grades and up to 8 colors, improving cable identification and protection options for industrial distributors.
- In February 2026, Sumitomo Electric Lightwave issued its heat-shrinkable cable-entry seals product sheet. Sumitomo Electric Lightwave stated in February 2026 noting its seals use a rubber boot along with O-ring and nylon-nut fitting, supporting sealing demand across tube distribution unit enclosures.
Key Players in the Heat Shrink Kits Market
Global electrical and cable accessory suppliers
- TE Connectivity
- 3M
- HellermannTyton
- Raychem RPG
Cable system and power accessory manufacturers
- Prysmian Group
- Nexans
- Sumitomo Electric Industries
- nVent
Regional heat shrink and utility accessory suppliers
- Yamuna Power & Infrastructure
- Shenzhen Woer Heat-Shrinkable Material
Heat Shrink Kits Market - Report Scope
| Coverage field | Report scope |
|---|---|
| Market breakdown | Heat Shrink Kits Market breakdown by kit type, voltage rating, component, application, end use, sales channel, and region |
| Market Definition | Heat shrink kits are packaged cable accessory assemblies using heat shrink tubes, sealants, stress control tubes, connector or lug accessories, sleeves, and installation components to insulate, seal, and protect cable joints and terminations across utility, industrial, renewable energy, telecom, and rail applications. |
| Regions Covered | North America, Latin America, Western Europe, Eastern Europe, East Asia, South Asia and Pacific, and Middle East and Africa |
| Countries Covered | United States, China, Germany, Japan, India, United Kingdom, Brazil, Canada, Mexico, France, Italy, Spain, ASEAN, Australia and New Zealand, GCC countries, South Africa, and Turkiye |
| Key Companies Profiled | TE Connectivity, 3M, nVent, HellermannTyton, Raychem RPG, Prysmian Group, Nexans, Sumitomo Electric Industries, Yamuna Power & Infrastructure, and Shenzhen Woer Heat-Shrinkable Material |
| Forecast Period | 2026 to 2036 |
| Approach | Hybrid bottom-up and top-down methodology using segment share, country CAGR, utility repair demand, voltage rating mix, cable jointing intensity, distributor participation, and supplier portfolio coverage. |
Source: Future Market Insights analysis, 2026.
Heat Shrink Kits Market - Research Methodology
| Method | Approach |
|---|---|
| Primary Research | Primary interviews covered utilities, electrical distributors, EPC contractors, industrial maintenance teams, cable accessory installers, and renewable energy project buyers. Discussions focused on sleeve recovery, voltage rating, kit completeness, sealant performance, installation support, warranty handling, and repeat-order readiness. |
| Desk Research | Desk research reviewed official grid statistics, renewable power updates, company product literature, cable accessory catalogues, standards references, and distributor channel information. |
| Market Sizing and Forecasting | Market sizing used a hybrid model across segment mix, country CAGR, cable jointing demand, underground repair exposure, renewable cabling activity, utility maintenance cycles, and supplier coverage across heat shrink kits. |
| Data Validation | Data validation compares interview findings from electrical contractors, industrial maintenance crews, utility linemen, and specialized distributors against regional electrification programs and channel availability. Analysts test country-level growth against segment shares, country CAGRs, company alignment, and official source signals to avoid unsupported claims and unrelated cable accessory leakage. The forecast is then triangulated across new wiring installations, electrical panel retrofits, and routine field repair cycles that influence repeat heat shrink kit demand. |
Source: Future Market Insights analysis, 2026.
Heat Shrink Kits Market by Segments
Heat Shrink Kits Market segmented by Kit Type:
- Cable jointing kits
- Cable termination kits
- Repair sleeves
- Busbar insulation kits
- Low voltage splice kits
- Medium voltage kits
Heat Shrink Kits Market segmented by Voltage Rating:
- Low voltage
- Medium voltage
- High voltage
Heat Shrink Kits Market segmented by Component:
- Heat shrink tubes
- Mastic or sealants
- Stress control tubes
- Connector or lug accessories
- Cleaning and installation accessories
Heat Shrink Kits Market segmented by Application:
- Underground cable joints
- Overhead line termination
- Industrial power distribution
- Utilities and grid repair
- Renewable energy cabling
Heat Shrink Kits Market segmented by End Use:
- Utilities
- Industrial facilities
- EPC or contractors
- Renewable energy
- Telecom or rail
Heat Shrink Kits Market segmented by Sales Channel:
- Electrical distributors
- Direct OEM
- EPC or project supply
- Utility framework contracts
Heat Shrink Kits Market by Region:
- North America
- United States
- Canada
- Latin America
- Brazil
- Mexico
- Argentina
- Western Europe
- Germany
- United Kingdom
- France
- Italy
- Spain
- Eastern Europe
- Poland
- Russia
- Turkiye
- East Asia
- China
- Japan
- South Korea
- South Asia and Pacific
- India
- Thailand
- Indonesia
- Australia
- New Zealand
- Middle East and Africa
- GCC countries
- South Africa
Research Sources and Bibliography
- Bundesnetzagentur. (2026, January 8). Growth in renewable energy in 2025.
- Department for Energy Security and Net Zero. (2026, June 30). Energy trends June 2026.
- Empresa de Pesquisa Energética. (2025). Brazilian energy balance 2025 summary report.
- HellermannTyton. (2025). Heat shrink tubing product solutions and application tips.
- International Energy Agency. (2025). Renewables 2025.
- International Energy Agency. (2025, February 25). Building the Future Transmission Grid.
- International Energy Agency. (2025, December 15). Renewable Energy Progress Tracker.
- International Renewable Energy Agency. (2026, March). Renewable capacity statistics 2026.
- Ministry of Economy, Trade and Industry. (2025). Energy White Paper 2025: Summary.
- Ministry of Power, Government of India. (2026, January 16). Year End Review of Ministry of Power - 2025.
- National Energy Administration. (2025, January 28). Renewable energy accounts for 56 percent of China total installed capacity.
- Occupational Safety and Health Administration. (2026, April 15). Top 10 most frequently cited standards for fiscal year 2025.
- Office for National Statistics. (2025, March 28). Annual changes in gross domestic product by industry.
- Raychem RPG. (2025). Heat shrink medium voltage joints for power systems.
- 3M. (2025). Support for medium and high voltage cable accessories.
- 3M. (2025). MV heat shrink cable jointing kits.
- Sumitomo Electric Lightwave. (2026, February). Heat-shrinkable cable-entry seals.
- TE Connectivity. (2025, August 26-28). Intersolar South America 2025.
- TE Connectivity. (2025, November 25-27). SPS 2025.
- USA Energy Information Administration. (2026, February 20). New USA electric generating capacity expected to reach a record high in 2026.
- Yamuna Power & Infrastructure. (2025). Heat shrinkable power cable jointing kits.
This bibliography is offered for reader reference and is not exhaustive. Full report material contains the complete reference list and detailed citations.
This Report Answers
- What segments shape demand across kit type, voltage rating, component, application, end use, and sales channel?
- How do installers evaluate heat shrink kits before replacing approved kit families?
- How do country CAGRs differ across profiled markets?
- What companies compete through cable accessory depth and application service?
- How does FMI validate forecasts using a hybrid bottom-up and top-down approach?
- What factors do account teams address before larger account expansion?
- How do sleeve recovery records and sealing evidence affect supplier selection?
- What limits return on investment for account teams adding heat shrink kits to cable programs?
- How do installation files and field response records influence account approval?
- What supplier capabilities improve long-term account confidence?
Frequently Asked Questions
What is supporting demand in the heat shrink kits market?
Demand is likely to be supported by utilities and contractors needing cable accessories for terminations and repair sleeves. Accounts are expected to prefer suppliers combining kit completeness and installer support.
Who are the key players in the heat shrink kits market?
Key companies are anticipated to include TE Connectivity, 3M, nVent, HellermannTyton, Raychem RPG, Prysmian Group, Nexans, Sumitomo Electric Industries, Yamuna Power & Infrastructure, and Shenzhen Woer Heat-Shrinkable Material. Competition is likely to be based on cable accessory depth and regional service coverage.
What is a restraint in the heat shrink kits market?
Installation proof burden acts as a practical restraint since buyers need preparation guidance and supplier response before approved use. Accounts slow adoption if kits lack sizing records or training support needed for field approval
Why do executives need to track the heat shrink kits market?
Executives are expected to track heat shrink kits as cable accessory decisions affect utility uptime and field repair timing. Factors such as qualification delay and repeat purchase confidence shape buyer reviews.
What business problem does the heat shrink kits market address?
Market demand addresses cable programs needing sealed joints and documented installation support across field networks. Utilities and contractors need kit formats protecting cable connections and supporting installation documentation.
What do account teams evaluate before selecting suppliers?
Account teams are likely to evaluate voltage rating and repeat-order reliability before supplier approval. Sleeve recovery evidence and service response are expected to guide final supplier review.
What limits return on investment for purchasing teams?
Return on investment weakens if kit performance or account acceptance is not proven before field rollout. Qualification delays and rework reduce expected margin gains.
How do suppliers build long-term account confidence?
Suppliers build account confidence by providing consistent tube quality and application evidence specific to heat shrink kits. Test records and responsive field support are expected to influence repeat-order trust.
Preview the report firsthand - request a free sample
Get SampleGet the brochure for pricing and purchase details.
Get PDFTable of Content
- Key Takeaways
- Market Size and CAGR
- Top Growth Driver
- Fastest Growing Segment
- Leading Region
- Key Companies
- Emerging Opportunities
- Executive Summary
- Global Market Outlook
- Demand-side Trends
- Supply-side Trends
- Technology Roadmap Analysis
- Analysis and Recommendations
- Analyst Perspective (What is happening? Why now? What should investors know?)
- Key Questions Answered
- How large is the market?
- What is the CAGR?
- What are key trends?
- Which region dominates?
- Who are the leaders?
- Market Overview
- Market Coverage / Taxonomy
- Market Definition / Scope / Limitations
- Research Methodology
- Chapter Orientation
- Analytical Lens and Working Hypotheses
- Market Structure, Signals, and Trend Drivers
- Benchmarking and Cross-market Comparability
- Market Sizing, Forecasting, and Opportunity Mapping
- Research Design and Evidence Framework
- Desk Research Programme (Secondary Evidence)
- Expert Input and Fieldwork (Primary Evidence)
- Tooling, Models, and Reference Databases
- Data Engineering and Model Build
- Quality Assurance and Audit Trail
- Market Background
- Market Dynamics (Drivers, Restraints, Opportunity, Trends)
- Scenario Forecast (Optimistic, Likely, Conservative)
- Impact Analysis
- AI Impact
- Sustainability Impact
- Regulatory Impact
- Technology Impact
- Consumer / Buyer Analysis
- Purchase Drivers
- Adoption Barriers
- Buyer Journey
- Opportunity Map Analysis
- Product Life Cycle Analysis
- Supply Chain Analysis
- Investment Feasibility Matrix
- Value Chain Analysis
- PESTLE and Porter's Analysis
- Regulatory Landscape
- Regional Parent Market Outlook
- Production and Consumption Statistics
- Import and Export Statistics
- Global Market Analysis and Forecast, 2021 to 2036
- Historical Market Size Value (USD Million) & Volume (Unit) Analysis, 2021 to 2025
- Current and Future Market Size Value (USD Million) & Volume (Unit) Projections, 2026 to 2036
- Y-o-Y Growth Trend Analysis
- Absolute $ Opportunity Analysis
- Global Market Pricing Analysis, 2021 to 2036
- Global Market Analysis and Forecast, By Kit Type, 2021 to 2036
- Introduction / Key Findings
- Historical Market Size Value (USD Million) & Volume (Unit) Analysis By Kit Type, 2021 to 2025
- Current and Future Market Size Value (USD Million) & Volume (Unit) Analysis and Forecast By Kit Type, 2026 to 2036
- Cable Jointing Kits
- Cable Termination Kits
- Repair Sleeves
- Busbar Insulation Kits
- Low Voltage Splice Kits
- Medium Voltage Kits
- Cable Jointing Kits
- Y-o-Y Growth Trend Analysis By Kit Type, 2021 to 2025
- Absolute $ Opportunity Analysis By Kit Type, 2026 to 2036
- Global Market Analysis and Forecast, By Voltage Rating, 2021 to 2036
- Introduction / Key Findings
- Historical Market Size Value (USD Million) & Volume (Unit) Analysis By Voltage Rating, 2021 to 2025
- Current and Future Market Size Value (USD Million) & Volume (Unit) Analysis and Forecast By Voltage Rating, 2026 to 2036
- Medium Voltage
- Low Voltage
- High Voltage
- Medium Voltage
- Y-o-Y Growth Trend Analysis By Voltage Rating, 2021 to 2025
- Absolute $ Opportunity Analysis By Voltage Rating, 2026 to 2036
- Global Market Analysis and Forecast, By Component, 2021 to 2036
- Introduction / Key Findings
- Historical Market Size Value (USD Million) & Volume (Unit) Analysis By Component, 2021 to 2025
- Current and Future Market Size Value (USD Million) & Volume (Unit) Analysis and Forecast By Component, 2026 to 2036
- Heat Shrink Tubes
- Mastic / Sealants
- Stress Control Tubes
- Connector / Lug Accessories
- Cleaning & Installation Accessories
- Heat Shrink Tubes
- Y-o-Y Growth Trend Analysis By Component, 2021 to 2025
- Absolute $ Opportunity Analysis By Component, 2026 to 2036
- Global Market Analysis and Forecast, By Application, 2021 to 2036
- Introduction / Key Findings
- Historical Market Size Value (USD Million) & Volume (Unit) Analysis By Application, 2021 to 2025
- Current and Future Market Size Value (USD Million) & Volume (Unit) Analysis and Forecast By Application, 2026 to 2036
- Underground Cable Joints
- Overhead Line Termination
- Industrial Power Distribution
- Utilities & Grid Repair
- Renewable Energy Cabling
- Underground Cable Joints
- Y-o-Y Growth Trend Analysis By Application, 2021 to 2025
- Absolute $ Opportunity Analysis By Application, 2026 to 2036
- Global Market Analysis and Forecast, By End Use, 2021 to 2036
- Introduction / Key Findings
- Historical Market Size Value (USD Million) & Volume (Unit) Analysis By End Use, 2021 to 2025
- Current and Future Market Size Value (USD Million) & Volume (Unit) Analysis and Forecast By End Use, 2026 to 2036
- Utilities
- Industrial Facilities
- EPC / Contractors
- Renewable Energy
- Telecom / Rail
- Utilities
- Y-o-Y Growth Trend Analysis By End Use, 2021 to 2025
- Absolute $ Opportunity Analysis By End Use, 2026 to 2036
- Global Market Analysis and Forecast, By Sales Channel
- Introduction / Key Findings
- Historical Market Size Value (USD Million) & Volume (Unit) Analysis By Sales Channel, 2021 to 2025
- Current and Future Market Size Value (USD Million) & Volume (Unit) Analysis and Forecast By Sales Channel, 2026 to 2036
- Electrical Distributors
- Direct OEM
- EPC / Project Supply
- Utility Framework Contracts
- Electrical Distributors
- Y-o-Y Growth Trend Analysis By Sales Channel, 2021 to 2025
- Absolute $ Opportunity Analysis By Sales Channel, 2026 to 2036
- Global Market Analysis and Forecast, By Region, 2021 to 2036
- Introduction
- Historical Market Size Value (USD Million) & Volume (Unit) Analysis By Region, 2021 to 2025
- Current Market Size Value (USD Million) & Volume (Unit) Analysis and Forecast By Region, 2026 to 2036
- North America
- Latin America
- Western Europe
- Eastern Europe
- East Asia
- South Asia and Pacific
- Middle East & Africa
- Market Attractiveness Analysis By Region
- North America Market Analysis and Forecast, By Country, 2021 to 2036
- Historical Market Size Value (USD Million) & Volume (Unit) Trend Analysis By Market Taxonomy, 2021 to 2025
- Market Size Value (USD Million) & Volume (Unit) Forecast By Market Taxonomy, 2026 to 2036
- By Country
- USA
- Canada
- By Kit Type
- By Voltage Rating
- By Component
- By Application
- By End Use
- By Sales Channel
- By Country
- Market Attractiveness Analysis
- By Country
- By Kit Type
- By Voltage Rating
- By Component
- By Application
- By End Use
- By Sales Channel
- Key Takeaways
- Latin America Market Analysis and Forecast, By Country
- Historical Market Size Value (USD Million) & Volume (Unit) Trend Analysis By Market Taxonomy, 2021 to 2025
- Market Size Value (USD Million) & Volume (Unit) Forecast By Market Taxonomy, 2026 to 2036
- By Country
- Brazil
- Mexico
- Chile
- Rest of Latin America
- By Kit Type
- By Voltage Rating
- By Component
- By Application
- By End Use
- By Sales Channel
- By Country
- Market Attractiveness Analysis
- By Country
- By Kit Type
- By Voltage Rating
- By Component
- By Application
- By End Use
- By Sales Channel
- Key Takeaways
- Western Europe Market Analysis and Forecast, By Country
- Historical Market Size Value (USD Million) & Volume (Unit) Trend Analysis By Market Taxonomy, 2021 to 2025
- Market Size Value (USD Million) & Volume (Unit) Forecast By Market Taxonomy, 2026 to 2036
- By Country
- Germany
- UK
- Italy
- Spain
- France
- Nordic
- BENELUX
- Rest of Western Europe
- By Kit Type
- By Voltage Rating
- By Component
- By Application
- By End Use
- By Sales Channel
- By Country
- Market Attractiveness Analysis
- By Country
- By Kit Type
- By Voltage Rating
- By Component
- By Application
- By End Use
- By Sales Channel
- Key Takeaways
- Eastern Europe Market Analysis and Forecast, By Country
- Historical Market Size Value (USD Million) & Volume (Unit) Trend Analysis By Market Taxonomy, 2021 to 2025
- Market Size Value (USD Million) & Volume (Unit) Forecast By Market Taxonomy, 2026 to 2036
- By Country
- Russia
- Poland
- Hungary
- Balkan & Baltic
- Rest of Eastern Europe
- By Kit Type
- By Voltage Rating
- By Component
- By Application
- By End Use
- By Sales Channel
- By Country
- Market Attractiveness Analysis
- By Country
- By Kit Type
- By Voltage Rating
- By Component
- By Application
- By End Use
- By Sales Channel
- Key Takeaways
- East Asia Market Analysis and Forecast, By Country
- Historical Market Size Value (USD Million) & Volume (Unit) Trend Analysis By Market Taxonomy, 2021 to 2025
- Market Size Value (USD Million) & Volume (Unit) Forecast By Market Taxonomy, 2026 to 2036
- By Country
- China
- Japan
- South Korea
- By Kit Type
- By Voltage Rating
- By Component
- By Application
- By End Use
- By Sales Channel
- By Country
- Market Attractiveness Analysis
- By Country
- By Kit Type
- By Voltage Rating
- By Component
- By Application
- By End Use
- By Sales Channel
- Key Takeaways
- South Asia and Pacific Market Analysis and Forecast, By Country
- Historical Market Size Value (USD Million) & Volume (Unit) Trend Analysis By Market Taxonomy, 2021 to 2025
- Market Size Value (USD Million) & Volume (Unit) Forecast By Market Taxonomy, 2026 to 2036
- By Country
- India
- ASEAN
- Australia & New Zealand
- Rest of South Asia and Pacific
- By Kit Type
- By Voltage Rating
- By Component
- By Application
- By End Use
- By Sales Channel
- By Country
- Market Attractiveness Analysis
- By Country
- By Kit Type
- By Voltage Rating
- By Component
- By Application
- By End Use
- By Sales Channel
- Key Takeaways
- Middle East & Africa Market Analysis and Forecast, By Country
- Historical Market Size Value (USD Million) & Volume (Unit) Trend Analysis By Market Taxonomy, 2021 to 2025
- Market Size Value (USD Million) & Volume (Unit) Forecast By Market Taxonomy, 2026 to 2036
- By Country
- Kingdom of Saudi Arabia
- Other GCC Countries
- Türkiye
- South Africa
- Other African Union
- Rest of Middle East & Africa
- By Kit Type
- By Voltage Rating
- By Component
- By Application
- By End Use
- By Sales Channel
- By Country
- Market Attractiveness Analysis
- By Country
- By Kit Type
- By Voltage Rating
- By Component
- By Application
- By End Use
- By Sales Channel
- Key Takeaways
- Key Countries Market Analysis
- USA
- Pricing Analysis
- Market Share Analysis, 2025
- By Kit Type
- By Voltage Rating
- By Component
- By Application
- By End Use
- By Sales Channel
- Canada
- Pricing Analysis
- Market Share Analysis, 2025
- By Kit Type
- By Voltage Rating
- By Component
- By Application
- By End Use
- By Sales Channel
- Mexico
- Pricing Analysis
- Market Share Analysis, 2025
- By Kit Type
- By Voltage Rating
- By Component
- By Application
- By End Use
- By Sales Channel
- Brazil
- Pricing Analysis
- Market Share Analysis, 2025
- By Kit Type
- By Voltage Rating
- By Component
- By Application
- By End Use
- By Sales Channel
- Chile
- Pricing Analysis
- Market Share Analysis, 2025
- By Kit Type
- By Voltage Rating
- By Component
- By Application
- By End Use
- By Sales Channel
- Germany
- Pricing Analysis
- Market Share Analysis, 2025
- By Kit Type
- By Voltage Rating
- By Component
- By Application
- By End Use
- By Sales Channel
- UK
- Pricing Analysis
- Market Share Analysis, 2025
- By Kit Type
- By Voltage Rating
- By Component
- By Application
- By End Use
- By Sales Channel
- Italy
- Pricing Analysis
- Market Share Analysis, 2025
- By Kit Type
- By Voltage Rating
- By Component
- By Application
- By End Use
- By Sales Channel
- Spain
- Pricing Analysis
- Market Share Analysis, 2025
- By Kit Type
- By Voltage Rating
- By Component
- By Application
- By End Use
- By Sales Channel
- France
- Pricing Analysis
- Market Share Analysis, 2025
- By Kit Type
- By Voltage Rating
- By Component
- By Application
- By End Use
- By Sales Channel
- India
- Pricing Analysis
- Market Share Analysis, 2025
- By Kit Type
- By Voltage Rating
- By Component
- By Application
- By End Use
- By Sales Channel
- ASEAN
- Pricing Analysis
- Market Share Analysis, 2025
- By Kit Type
- By Voltage Rating
- By Component
- By Application
- By End Use
- By Sales Channel
- Australia & New Zealand
- Pricing Analysis
- Market Share Analysis, 2025
- By Kit Type
- By Voltage Rating
- By Component
- By Application
- By End Use
- By Sales Channel
- China
- Pricing Analysis
- Market Share Analysis, 2025
- By Kit Type
- By Voltage Rating
- By Component
- By Application
- By End Use
- By Sales Channel
- Japan
- Pricing Analysis
- Market Share Analysis, 2025
- By Kit Type
- By Voltage Rating
- By Component
- By Application
- By End Use
- By Sales Channel
- South Korea
- Pricing Analysis
- Market Share Analysis, 2025
- By Kit Type
- By Voltage Rating
- By Component
- By Application
- By End Use
- By Sales Channel
- Russia
- Pricing Analysis
- Market Share Analysis, 2025
- By Kit Type
- By Voltage Rating
- By Component
- By Application
- By End Use
- By Sales Channel
- Poland
- Pricing Analysis
- Market Share Analysis, 2025
- By Kit Type
- By Voltage Rating
- By Component
- By Application
- By End Use
- By Sales Channel
- Hungary
- Pricing Analysis
- Market Share Analysis, 2025
- By Kit Type
- By Voltage Rating
- By Component
- By Application
- By End Use
- By Sales Channel
- Kingdom of Saudi Arabia
- Pricing Analysis
- Market Share Analysis, 2025
- By Kit Type
- By Voltage Rating
- By Component
- By Application
- By End Use
- By Sales Channel
- Türkiye
- Pricing Analysis
- Market Share Analysis, 2025
- By Kit Type
- By Voltage Rating
- By Component
- By Application
- By End Use
- By Sales Channel
- South Africa
- Pricing Analysis
- Market Share Analysis, 2025
- By Kit Type
- By Voltage Rating
- By Component
- By Application
- By End Use
- By Sales Channel
- USA
- Market Structure Analysis
- Competition Dashboard
- Competition Benchmarking
- Market Share Analysis of Top Players
- By Regional
- By Kit Type
- By Voltage Rating
- By Component
- By Application
- By End Use
- By Sales Channel
- Emerging Startups
- Innovation Benchmarking
- Competition Analysis
- Competition Deep Dive
- TE Connectivity
- Overview
- Product Portfolio
- Profitability by Market Segments
- Sales Footprint
- Strategy Overview
- Marketing Strategy
- Product Strategy
- Channel Strategy
- 3M
- nVent
- HellermannTyton
- Raychem RPG
- Prysmian Group
- Nexans
- Sumitomo Electric
- Yamuna Power
- Woer
- TE Connectivity
- Case Studies
- Success Stories
- Recent Developments
- Competition Deep Dive
- Assumptions & Acronyms Used


