Reports

- Global Locations -

Headquarters

Future Market Insights, Inc.

Christiana Corporate, 200
Continental Drive, Suite 401,
Newark, Delaware - 19713,
United States

T: +1-845-579-5705

Americas

Future Market Insights, Inc.

616 Corporate Way, Suite 2-9018,
Valley Cottage, NY 10989, United States

T: +1-347-918-3531

MEA

Future Market Insights

1602-6 Jumeirah Bay X2 Tower, Plot No: JLT-PH2-X2A,
Jumeirah Lakes Towers, Dubai,
United Arab Emirates

Europe

Future Market Insights

3rd Floor, 207 Regent Street,
W1B 3HH London
United Kingdom

T: + 44 (0) 20 8123 9659
D: +44 (0) 20 3287 4268

Asia Pacific

Future Market Insights

IndiaLand Global Tech Park, Unit UG-1, Behind Grand HighStreet, Phase 1, Hinjawadi, MH, Pune – 411057, India

Hermetic Packaging Market Outlook 2023 to 2033

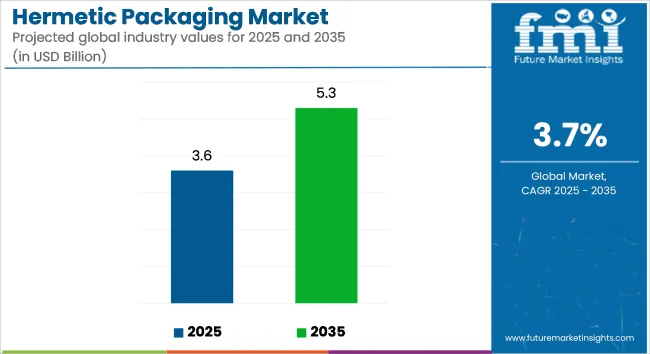
The hermetic packaging market is poised to increase at a 4.2% CAGR from 2023 to 2033, acquiring a market value of US$ 5.2 billion by the end of 2033, up from US$ 3.4 billion in 2023.

Emerging hermetic packaging demand is associated with heightened research and development efforts in the defense and aerospace sectors. Electronic systems in hermetic electronic packaging are protected from external factors such as changes in atmospheric pressure and moisture, which can harm sensitive electronic components or electrical connections.

Many medical and electronic devices enjoy hermetic packaging's safe and dependable performance by prolonging the service life of electrical components, consequently making the market strong.

Electronic device demand is set to rise due to the growing disposable income and increased internet usage among consumers. Governments around the world are promoting digitalization, pushing customers to adopt various electronic devices and which in turn strengthens the hermetic electronic packaging market growth.

Don't pay for what you don't need

Customize your report by selecting specific countries or regions and save 30%!

How the Market Evolves Till June 2023?

Future Market Insights anticipates a comparison and review analysis of the market dynamics, which are influenced by a variety of industry factors, as well as a few definite influences about the availability of substitute technology and stringent leak rate requirements, which stymie hermetic food packaging market growth.

One of the recent commercial advancements is the usage of laser hermetic sealing technology. AMETEK Engineered Connectivity and Packaging increased its hermetic seals and sealtron brands in July 2022.

The primary cause behind the market growth is that it inhibits internal components from reacting with oxygen or moisture in the environment. Despite the risks, hermetic packaging is chosen by different end-use sectors because it can withstand high-temperature conditions.

Hermetic Packaging Demand: 2017 to 2022 Study vs. Market Prospects from 2023 to 2030

A more advanced packaging method, hermetic packaging, is used in the electronics and semiconductor industries and for active and passive electronic devices. The hermetic food packaging protects highly sensitive electronics such as laser diodes, sensors, and optoelectronic components from moisture and rust.

Hermetic packaging protects against external influences such as air pressure fluctuations, moisture, dirt, and other hazards that could damage electrical contacts or important electronic components. To ensure the reliable and safe operation of various medical and electronic devices, it is important to extend the service life of electronic systems. Historically, this method has been used to protect MEMS equipment from moisture or gas in industries such as defense, healthcare, aerospace, and automotive. As a result of technological advances, many hermetic packaging manufacturers are launching a range of products that protect extremely sensitive electronic components and electronically implanted medical devices.

Electrical or electronic components can be hermetically sealed to protect them from water vapor and foreign objects to maintain their functionality and reliability. In landscape and outdoor construction projects, hermetic packaging is also used to protect general utilities and electrical connections/splice points for landscape lighting.

From 2017 to 2022, the hermetic packaging market expanded at a CAGR of 3.7%. The global hermetic packaging market has grown significantly due to the increasing hermetic packaging demand for the protection of highly sensitive electronic elements, and rising hermetic packaging demand in end-use industries.

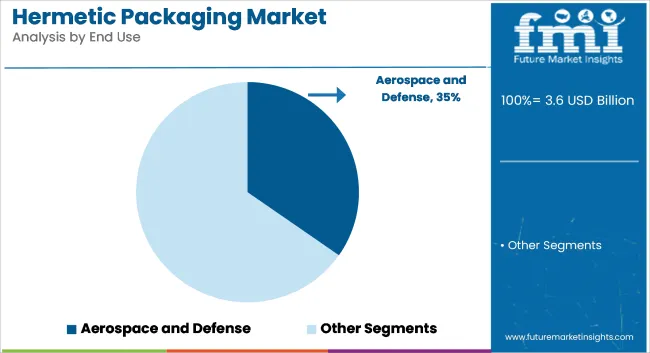
The hermetic electronic packaging demand is high worldwide due to its widespread use in defense, aerospace, military, and commercial applications. Low-cost air travel combined with low fuel prices has attracted new travelers from around the world, resulting in increased flight frequency.

The hermetic electronic packaging demand is to secure a CAGR of 4.2% from 2023 to 2033, with the global market expected to reach US$ 5.2 billion by 2033.

Attributes Details
Hermetic Packaging Market CAGR (From 2023 to 2033) 4.2%
Hermetic Packaging Market HCAGR (From 2017 to 2022) 3.7%
Hermetic Packaging Market Size (2023) US$ 3.4 billion
Hermetic Packaging Market Size (2033) US$ 5.2 billion
Ismail Sutaria
Ismail Sutaria

Principal Consultant

Talk to Analyst

Find your sweet spots for generating winning opportunities in this market.

What Trends Affecting Demand for Hermetic Packaging?

Hermetic Packaging is Preferred Because it can Withstand a Variety of Environmental Conditions.

Hermetic products protect sensitive electronics and electrical connections from the elements such as dirt, moisture, atmospheric pressure, and other natural threats. Applications for hermetic food packaging are essential since their functionality may be impacted by extreme environmental conditions. In light of this, there is a record-high hermetic packaging demand to safeguard exceedingly delicate electrical components, and this demand is to rise during the projection period. This is one of the things contributing to hermetic food packaging demand.

Overwhelming Digital Industry Stimulates Hermetic Packaging Sales

Two reasons driving the market growth are increasing demand for consumer electronics, and widespread use in packaging operations in new sectors.

Changing lifestyle preferences and increasing inclination towards the use of smart electronic devices are among the key drivers for the global consumer electronics industry expansion.

Over the forecast period, rising consumer disposable income coupled with the need for internet connectivity may boost demand for electronic gadgets. Governments around the world are focusing on digitization to encourage citizens to use a variety of electronic devices. On a global scale, this is likely to lead to a rise in the consumer electronics industry and an increase in hermetic electronic packaging demand.

Get the data you need at a Fraction of the cost

Personalize your report by choosing insights you need
and save 40%!

Increasing Interest in Hermetic Packaging Solutions due to their Effectiveness

Another key factor driving the growth of the hermetic packaging industry is the widespread use of hermetic food packaging in the packaging activities of booming sectors. Food, pharmaceutical, and some chemical packaging must have a seal against gas diffusion.

Hermetic packaging, such as barrier and vacuum packaging for food, plays a crucial role in preserving the product.

In addition to the food and beverage industry, hermetic food packaging is also used in construction and infrastructure development. In buildings designed with innovative and ecological concepts, airtight technologies are used to save energy.

Boosting Hermetic Packaging Demand in the Defence Sector

The need for collective defense cannot be overstated in today's increasingly complex geopolitical environment. This includes weapons, guidance and navigation tools, countermeasures, armed vehicles, and their energy sources.
Military and defense forces are critical to a country's security and defense against foreign threats. To maintain a strong military system, surveillance, and arming must function efficiently and effectively. To achieve this, they must be securely packaged and transported. Hermetic packaging is suitable for this purpose.

The use of hermetic food packaging in the defense industry is increasing. Therefore, hermetic packaging market participants may continue to benefit from the hermetic food packaging industry during the forecast period.

What are the Future Prospects for Hermetic Packaging Manufacturers?

Growing Hermetic Packaging Demand in the Medical Sector to Protect Implantable Medical Devices

Modern microtechnology has made it possible to significantly reduce the size of smart devices despite increasing complexity and integration. As a result, reliable and compact microelectronics packaging is becoming increasingly important.

Packaging should provide a high-quality hermetic seal to protect vital electronics, such as implantable medical devices, from the human body. The downsizing of the next generation of implantable medical devices is expected to create more opportunities for the development of new packaging solutions.

Which Substitute has a Negative Impact on Hermetic Packaging Sales Growth?

Alternative Packaging Technologies may Slow Hermetic Packaging Sales Growth

The availability of alternative packaging methods is expected to restrain the growth of the hermetic packaging industry. Despite their improvement, there is a risk that hermetic packaging may be overtaken by alternative equivalents that are considered protective and trustworthy. Plastic packaging is one of these options.

Microelectronic components used in military, aerospace, and medical systems must adhere to the most stringent hermetic packaging regulations due to their harsh environments and important applications. As old equipment does not have the sensitivity to meet the new requirements, companies may be forced to purchase new leak-testing equipment as regulations become stringent.

Hermetic packaging manufacturers must comply with these standards to increase market share at the expense of escalating costs. These stringent specifications for hermetic electronic packaging are expected to hinder the industry's expansion. Plastic packaging is becoming a viable alternative as it can withstand external influences.

Comparative View of the Adjacent Hermetic Packaging Market

Hermetic Packaging Market:

Attributes Hermetic Packaging Market
CAGR (2023 to 2033) 4.2%
Market Value (2023) US$ 3.4 billion
Growth Factor The secure and dependable performance of hermetic packaging benefits a variety of medical and electronic products by increasing the service life of the market-moving electrical components.
Opportunity Governments are promoting digitization hugely, which ultimately encourages customers to adopt different electronic devices and boosts market growth.
Key Trends The expansion of research and development activities in the aerospace and defense industries, which has led to a rise in the adoption of hermetic packaging, is blamed for the market growth.

Smart Packaging Market:

Attributes Smart Packaging Market
CAGR (2023 to 2033) 8.91
Market Value (2023) US$ 13.16 billion
Growth Factor The adoption of smart packaging is having a favorable effect on the expansion of the food business by extending the shelf life and enhancing product traceability.
Opportunity The adoption of smart packaging in the healthcare and pharmaceutical sectors is driving market expansion.
Key Trends Rising research and development spending to cut carbon emissions is likely to support growth.

Nano-enabled Packaging Market:

Attributes Nano-enabled Packaging Market
CAGR (2023 to 2033) 13.2%
Market Value (2023) US$ 60.28 billion
Growth Factor The main driver of the steady expansion is the rising demand for efficient packaging solutions, particularly in the food & beverage and pharmaceutical industries.
Opportunity Due to the adoption of packaging regulations and standards from various responsible authorities, the industry is expanding significantly.
Key Trends Government-introduced food safety standards are promoting market expansion.

Segmentation Outlook

Which Packaging Configuration is in Strong Demand?

Transponder Glass Packaging May Continue to be a Prominent Hermetic Packaging Configuration

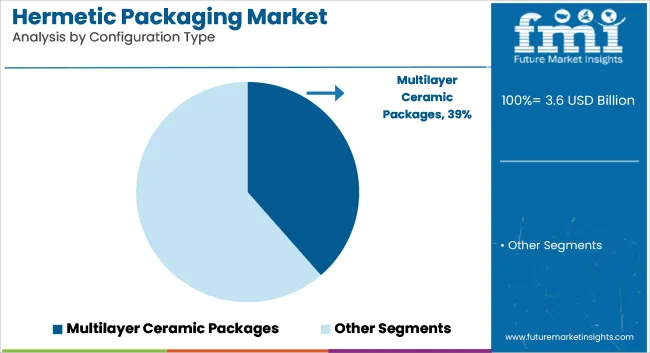
Glass transponder hermetic packaging is becoming extremely prevalent, especially for RFID-enabled transponders. These glass transponders, like those used in car manufacturing, are particularly effective in protecting RFID chips from oil and chemicals. These chips are also used in livestock production to provide information about the meat's quality. Simultaneously, due to the rising demand for complex electronic circuits such as microelectromechanical systems, multilayer ceramic hermetic packaging is gaining traction (MEMS). Ceramic packing offers superior hermetic protection when compared to other materials.

Regional Outlook

In Which Regional Markets do Hermetic Packaging Manufacturers See Progress?

Region Market Share
East Asia, South Asia, and Oceania 38%
North America 24.7%
Europe 29.6%
Latin America 4.7%
The Middle East and Africa 3.1%

Asia Pacific is among the Emerging Countries with the Swift Hermetic Packaging Technology Market

This hermetic packaging study covers North America, Latin America, Europe, East Asia, South Asia & Pacific, and the Middle East and Africa (MEA).

The hermetic packaging market is now expanding rapidly in the Asia Pacific. A few driving forces for the rise of the hermetic electronic packaging market in the region are increased defense spending, expanding economies, and rising energy demand. East Asia, South Asia, and Oceania together are expected to account for 38% of the global market in 2023.

Strong GDP growth rates and rising energy hermetic packaging demand in developing countries such as China and India are creating new opportunities for hermetic packaging technology manufacturers in the Asia Pacific.

North America is expected to account for 24.7% of the global market due to high sales volumes in key regional end-use industries. One of the leading applications for hermetic packaging in this country is aerospace. The aerospace sector is expected to offer tremendous opportunities for hermetic electronic packaging market expansion owing to the presence of numerous aerospace companies.

Europe is expected to hold a 29.6% share of the global market by 2023. The hermetic packaging business in Europe is expanding as the continent's economy grows.

Regional markets in Latin America and the Middle East and Africa are developing at a slow pace than other regions, but this is to change over the forecast period. Latin America and the Middle East and Africa are to hold a 4.7% and 3.1% share of the global market, respectively, in 2023.

Country Outlook

What is Accelerating Hermetic Packaging Sales in the United States?

Escalating Defense and Automotive Spending Advance Hermetic Packaging Sales

Increasing United States defense spending may boost the adoption of hermetic packaging in the military and defense industries. The existence of the world's leading aircraft manufacturers, together with the high standards of the national medical industry, may boost the hermetic packaging market revenue in the approaching years.

More government spending on aerospace and defense is predicted to boost the hermetic packaging market throughout the forecast period. The aviation sector stimulates hermetic packaging demand technology due to its reliance on new aircraft, supporting the hermetic electronic packaging market.

Aside from that, the United States is home to several world's leading automotive businesses, which are investing in electric vehicles and self-driving automobiles, both of which necessitate high-performance integrated circuits. In the automotive sector, hermetic seals maintain sensor functionality in rollover devices and airbag equipment. If the use of airbags increases, the market may require hermetic packaging.

How is China Hermetic Packaging Industry Growing?

Evolving Electronic sector is Positively Influencing Hermetic Packaging Consumption.

China has the potential to make a substantial contribution to the uptick in hermetic packaging sales. The country's booming semiconductor industry is fuelling hermetic food packaging market expansion as it is an electronics manufacturing center.

The country's growing consumer electronics sector, together with great government spending for China's aerospace and defense sectors, is expected to accelerate hermetic electronic packaging market expansion.

The Economic Scenario of the Hermetic Packaging Industry

The leading hermetic packaging manufacturers like AMETEK Inc., Amkor Technology Inc., Egide SA, Kyocera Corporation, Legacy Technologies Inc., Materion Corporation, Micross Components, and others are investing in the creation of a strong distribution network in order to remain competitive in the hermetic packaging industry.

Leading participants continue to pay close attention to business strategies like research and development, new product launches, product approvals, patent rights and events, strategic partnerships, product launches, contractual agreements, collaborations, digital marketing, acquisitions, mergers, and so on, to establish themselves as a recognizable and successful business firm.

Latest Advancements

Strategy Partnership
Company Micross Components
Details To serve the Philadelphia area, Micross Components partnered with Strategic Sales Inc.
Strategy Expansion
Company Schott AG
Details In 2020, Schott AG expanded its product line by launching a variety of hermetic goods and introducing its ground-breaking HEATAN technology.

Key Players

  • SCHOTT AG
  • AMETEK Inc.
  • Materion Corporation
  • Willow Technologies
  • Teledyne e2v (UK) Limited.
  • Sinclair Manufacturing Company
  • Texas Instruments Incorporated
  • Amkor Technology
  • Micross Components Inc.
  • Egide Group
  • SGA Technologies
  • SAES Group.
  • Integrated Device Technology Inc.
  • Televec
  • Mackin Technologies
  • Special Hermetic Products Inc.
  • Emerson Electric Co.
  • SRI Hermetics Inc.
  • KYOCERA International Inc.

Key Segments

By Hermetic Seal:

  • Epoxy Hermetic Seals
  • Glass-to-Metal (GTM) Hermetic Seals
  • Ceramic-to-Metal (CTM) Hermetic Seals
  • Glassware Sealings
  • PTFE Sealing Rings
  • O-Rings
  • PTFE Sleeves

By Configuration:

  • Multilayer Ceramic Packages
  • Metal Can Packages
  • Pressed Ceramic Packages

By Application:

  • Semiconductor Electronics
  • Thermostats
  • Optical devices
  • Switches
  • Microelectromechanical Systems (MEMS)
  • Electrical or Electronic Parts
  • Batteries

By Region:

  • North America
  • Latin America
  • Europe
  • East Asia
  • South Asia & Pacific
  • The Middle East & Africa (MEA)

Frequently Asked Questions

Which Countries Dominate the Global Hermetic Packaging Market?

The United States, Japan, and China dominate the global hermetic packaging market.

What is the Growth Forecast for the Hermetic Packaging Market?

The market is forecast to register a CAGR of 4.2% through 2033.

What is the Historical Performance of the Hermetic Packaging Market?

During 2018 to 2022, the market recorded a growth of 2%.

Which is the Top Trend in the Hermetic Packaging Market?

Innovation in packaging is the current market trends.

What is the Projected Size of the Market by 2033?

The global market size to reach US$ 5.2 billion by 2033.

Table of Content

1. Executive Summary | Hermetic Packaging Market

    1.1. Global Market Outlook

    1.2. Demand-side Trends

    1.3. Supply-side Trends

    1.4. Technology Roadmap Analysis

    1.5. Analysis and Recommendations

2. Market Overview

    2.1. Market Coverage / Taxonomy

    2.2. Market Definition / Scope / Limitations

3. Market Background

    3.1. Market Dynamics

        3.1.1. Drivers

        3.1.2. Restraints

        3.1.3. Opportunity

        3.1.4. Trends

    3.2. Scenario Forecast

        3.2.1. Demand in Optimistic Scenario

        3.2.2. Demand in Likely Scenario

        3.2.3. Demand in Conservative Scenario

    3.3. Opportunity Map Analysis

    3.4. Product Life Cycle Analysis

    3.5. Supply Chain Analysis

        3.5.1. Supply Side Participants and their Roles

            3.5.1.1. Producers

            3.5.1.2. Mid-Level Participants (Traders/ Agents/ Brokers)

            3.5.1.3. Wholesalers and Distributors

        3.5.2. Value Added and Value Created at Node in the Supply Chain

        3.5.3. List of Raw Material Suppliers

        3.5.4. List of Existing and Potential Buyer’s

    3.6. Investment Feasibility Matrix

    3.7. Value Chain Analysis

        3.7.1. Profit Margin Analysis

        3.7.2. Wholesalers and Distributors

        3.7.3. Retailers

    3.8. PESTLE and Porter’s Analysis

    3.9. Regulatory Landscape

        3.9.1. By Key Regions

        3.9.2. By Key Countries

    3.10. Regional Parent Market Outlook

    3.11. Production and Consumption Statistics

    3.12. Import and Export Statistics

4. Global Market Analysis 2018 to 2022 and Forecast, 2023 to 033

    4.1. Historical Market Size Value (US$ Million) & Volume (Units) Analysis, 2018 to 2022

    4.2. Current and Future Market Size Value (US$ Million) & Volume (Units) Projections, 2023 to 033

        4.2.1. Y-o-Y Growth Trend Analysis

        4.2.2. Absolute $ Opportunity Analysis

5. Global Market Analysis 2018 to 2022 and Forecast 2023 to 033, By Hermetic Seal

    5.1. Introduction / Key Findings

    5.2. Historical Market Size Value (US$ Million) & Volume (Units) Analysis By Hermetic Seal, 2018 to 2022

    5.3. Current and Future Market Size Value (US$ Million) & Volume (Units) Analysis and Forecast By Hermetic Seal, 2023 to 033

        5.3.1. Epoxy Hermetic Seals

        5.3.2. Glass-to-Metal (GTM) Hermetic Seals

        5.3.3. Ceramic-to-Metal (CTM) Hermetic Seals

        5.3.4. Glassware Sealing

        5.3.5. PTFE Sealing Rings

        5.3.6. O-Rings

        5.3.7. PTFE Sleeves

    5.4. Y-o-Y Growth Trend Analysis By Hermetic Seal, 2018 to 2022

    5.5. Absolute $ Opportunity Analysis By Hermetic Seal, 2023 to 033

6. Global Market Analysis 2018 to 2022 and Forecast 2023 to 033, By Configuration

    6.1. Introduction / Key Findings

    6.2. Historical Market Size Value (US$ Million) & Volume (Units) Analysis By Configuration, 2018 to 2022

    6.3. Current and Future Market Size Value (US$ Million) & Volume (Units) Analysis and Forecast By Configuration, 2023 to 033

        6.3.1. Multilayer Ceramic Packages

        6.3.2. Metal Can Packages

        6.3.3. Pressed Ceramic Packages

    6.4. Y-o-Y Growth Trend Analysis By Configuration, 2018 to 2022

    6.5. Absolute $ Opportunity Analysis By Configuration, 2023 to 033

7. Global Market Analysis 2018 to 2022 and Forecast 2023 to 033, By Application

    7.1. Introduction / Key Findings

    7.2. Historical Market Size Value (US$ Million) & Volume (Units) Analysis By Application, 2018 to 2022

    7.3. Current and Future Market Size Value (US$ Million) & Volume (Units) Analysis and Forecast By Application, 2023 to 033

        7.3.1. Semiconductor Electronics

        7.3.2. Thermostats

        7.3.3. Optical devices

        7.3.4. Switches

        7.3.5. Microelectromechanical Systems

        7.3.6. Electrical or Electronic Parts

        7.3.7. Batteries

    7.4. Y-o-Y Growth Trend Analysis By Application, 2018 to 2022

    7.5. Absolute $ Opportunity Analysis By Application, 2023 to 033

8. Global Market Analysis 2018 to 2022 and Forecast 2023 to 033, By Region

    8.1. Introduction

    8.2. Historical Market Size Value (US$ Million) & Volume (Units) Analysis By Region, 2018 to 2022

    8.3. Current Market Size Value (US$ Million) & Volume (Units) Analysis and Forecast By Region, 2023 to 033

        8.3.1. North America

        8.3.2. Latin America

        8.3.3. Europe

        8.3.4. Asia Pacific

        8.3.5. MEA

    8.4. Market Attractiveness Analysis By Region

9. North America Market Analysis 2018 to 2022 and Forecast 2023 to 033, By Country

    9.1. Historical Market Size Value (US$ Million) & Volume (Units) Trend Analysis By Market Taxonomy, 2018 to 2022

    9.2. Market Size Value (US$ Million) & Volume (Units) Forecast By Market Taxonomy, 2023 to 033

        9.2.1. By Country

            9.2.1.1. USA

            9.2.1.2. Canada

        9.2.2. By Hermetic Seal

        9.2.3. By Configuration

        9.2.4. By Application

    9.3. Market Attractiveness Analysis

        9.3.1. By Country

        9.3.2. By Hermetic Seal

        9.3.3. By Configuration

        9.3.4. By Application

    9.4. Key Takeaways

10. Latin America Market Analysis 2018 to 2022 and Forecast 2023 to 033, By Country

    10.1. Historical Market Size Value (US$ Million) & Volume (Units) Trend Analysis By Market Taxonomy, 2018 to 2022

    10.2. Market Size Value (US$ Million) & Volume (Units) Forecast By Market Taxonomy, 2023 to 033

        10.2.1. By Country

            10.2.1.1. Brazil

            10.2.1.2. Mexico

            10.2.1.3. Rest of Latin America

        10.2.2. By Hermetic Seal

        10.2.3. By Configuration

        10.2.4. By Application

    10.3. Market Attractiveness Analysis

        10.3.1. By Country

        10.3.2. By Hermetic Seal

        10.3.3. By Configuration

        10.3.4. By Application

    10.4. Key Takeaways

11. Europe Market Analysis 2018 to 2022 and Forecast 2023 to 033, By Country

    11.1. Historical Market Size Value (US$ Million) & Volume (Units) Trend Analysis By Market Taxonomy, 2018 to 2022

    11.2. Market Size Value (US$ Million) & Volume (Units) Forecast By Market Taxonomy, 2023 to 033

        11.2.1. By Country

            11.2.1.1. Germany

            11.2.1.2. United kingdom

            11.2.1.3. France

            11.2.1.4. Spain

            11.2.1.5. Italy

            11.2.1.6. Rest of Europe

        11.2.2. By Hermetic Seal

        11.2.3. By Configuration

        11.2.4. By Application

    11.3. Market Attractiveness Analysis

        11.3.1. By Country

        11.3.2. By Hermetic Seal

        11.3.3. By Configuration

        11.3.4. By Application

    11.4. Key Takeaways

12. Asia Pacific Market Analysis 2018 to 2022 and Forecast 2023 to 033, By Country

    12.1. Historical Market Size Value (US$ Million) & Volume (Units) Trend Analysis By Market Taxonomy, 2018 to 2022

    12.2. Market Size Value (US$ Million) & Volume (Units) Forecast By Market Taxonomy, 2023 to 033

        12.2.1. By Country

            12.2.1.1. China

            12.2.1.2. Japan

            12.2.1.3. South Korea

            12.2.1.4. Singapore

            12.2.1.5. Thailand

            12.2.1.6. Indonesia

            12.2.1.7. Australia

            12.2.1.8. New Zealand

            12.2.1.9. Rest of Asia Pacific

        12.2.2. By Hermetic Seal

        12.2.3. By Configuration

        12.2.4. By Application

    12.3. Market Attractiveness Analysis

        12.3.1. By Country

        12.3.2. By Hermetic Seal

        12.3.3. By Configuration

        12.3.4. By Application

    12.4. Key Takeaways

13. MEA Market Analysis 2018 to 2022 and Forecast 2023 to 033, By Country

    13.1. Historical Market Size Value (US$ Million) & Volume (Units) Trend Analysis By Market Taxonomy, 2018 to 2022

    13.2. Market Size Value (US$ Million) & Volume (Units) Forecast By Market Taxonomy, 2023 to 033

        13.2.1. By Country

            13.2.1.1. GCC Countries

            13.2.1.2. South Africa

            13.2.1.3. Israel

            13.2.1.4. Rest of MEA

        13.2.2. By Hermetic Seal

        13.2.3. By Configuration

        13.2.4. By Application

    13.3. Market Attractiveness Analysis

        13.3.1. By Country

        13.3.2. By Hermetic Seal

        13.3.3. By Configuration

        13.3.4. By Application

    13.4. Key Takeaways

14. Key Countries Market Analysis

    14.1. USA

        14.1.1. Pricing Analysis

        14.1.2. Market Share Analysis, 2022

            14.1.2.1. By Hermetic Seal

            14.1.2.2. By Configuration

            14.1.2.3. By Application

    14.2. Canada

        14.2.1. Pricing Analysis

        14.2.2. Market Share Analysis, 2022

            14.2.2.1. By Hermetic Seal

            14.2.2.2. By Configuration

            14.2.2.3. By Application

    14.3. Brazil

        14.3.1. Pricing Analysis

        14.3.2. Market Share Analysis, 2022

            14.3.2.1. By Hermetic Seal

            14.3.2.2. By Configuration

            14.3.2.3. By Application

    14.4. Mexico

        14.4.1. Pricing Analysis

        14.4.2. Market Share Analysis, 2022

            14.4.2.1. By Hermetic Seal

            14.4.2.2. By Configuration

            14.4.2.3. By Application

    14.5. Germany

        14.5.1. Pricing Analysis

        14.5.2. Market Share Analysis, 2022

            14.5.2.1. By Hermetic Seal

            14.5.2.2. By Configuration

            14.5.2.3. By Application

    14.6. United kingdom

        14.6.1. Pricing Analysis

        14.6.2. Market Share Analysis, 2022

            14.6.2.1. By Hermetic Seal

            14.6.2.2. By Configuration

            14.6.2.3. By Application

    14.7. France

        14.7.1. Pricing Analysis

        14.7.2. Market Share Analysis, 2022

            14.7.2.1. By Hermetic Seal

            14.7.2.2. By Configuration

            14.7.2.3. By Application

    14.8. Spain

        14.8.1. Pricing Analysis

        14.8.2. Market Share Analysis, 2022

            14.8.2.1. By Hermetic Seal

            14.8.2.2. By Configuration

            14.8.2.3. By Application

    14.9. Italy

        14.9.1. Pricing Analysis

        14.9.2. Market Share Analysis, 2022

            14.9.2.1. By Hermetic Seal

            14.9.2.2. By Configuration

            14.9.2.3. By Application

    14.10. China

        14.10.1. Pricing Analysis

        14.10.2. Market Share Analysis, 2022

            14.10.2.1. By Hermetic Seal

            14.10.2.2. By Configuration

            14.10.2.3. By Application

    14.11. Japan

        14.11.1. Pricing Analysis

        14.11.2. Market Share Analysis, 2022

            14.11.2.1. By Hermetic Seal

            14.11.2.2. By Configuration

            14.11.2.3. By Application

    14.12. South Korea

        14.12.1. Pricing Analysis

        14.12.2. Market Share Analysis, 2022

            14.12.2.1. By Hermetic Seal

            14.12.2.2. By Configuration

            14.12.2.3. By Application

    14.13. Singapore

        14.13.1. Pricing Analysis

        14.13.2. Market Share Analysis, 2022

            14.13.2.1. By Hermetic Seal

            14.13.2.2. By Configuration

            14.13.2.3. By Application

    14.14. Thailand

        14.14.1. Pricing Analysis

        14.14.2. Market Share Analysis, 2022

            14.14.2.1. By Hermetic Seal

            14.14.2.2. By Configuration

            14.14.2.3. By Application

    14.15. Indonesia

        14.15.1. Pricing Analysis

        14.15.2. Market Share Analysis, 2022

            14.15.2.1. By Hermetic Seal

            14.15.2.2. By Configuration

            14.15.2.3. By Application

    14.16. Australia

        14.16.1. Pricing Analysis

        14.16.2. Market Share Analysis, 2022

            14.16.2.1. By Hermetic Seal

            14.16.2.2. By Configuration

            14.16.2.3. By Application

    14.17. New Zealand

        14.17.1. Pricing Analysis

        14.17.2. Market Share Analysis, 2022

            14.17.2.1. By Hermetic Seal

            14.17.2.2. By Configuration

            14.17.2.3. By Application

    14.18. GCC Countries

        14.18.1. Pricing Analysis

        14.18.2. Market Share Analysis, 2022

            14.18.2.1. By Hermetic Seal

            14.18.2.2. By Configuration

            14.18.2.3. By Application

    14.19. South Africa

        14.19.1. Pricing Analysis

        14.19.2. Market Share Analysis, 2022

            14.19.2.1. By Hermetic Seal

            14.19.2.2. By Configuration

            14.19.2.3. By Application

    14.20. Israel

        14.20.1. Pricing Analysis

        14.20.2. Market Share Analysis, 2022

            14.20.2.1. By Hermetic Seal

            14.20.2.2. By Configuration

            14.20.2.3. By Application

15. Market Structure Analysis

    15.1. Competition Dashboard

    15.2. Competition Benchmarking

    15.3. Market Share Analysis of Top Players

        15.3.1. By Regional

        15.3.2. By Hermetic Seal

        15.3.3. By Configuration

        15.3.4. By Application

16. Competition Analysis

    16.1. Competition Deep Dive

        16.1.1. SCHOTT AG

            16.1.1.1. Overview

            16.1.1.2. Product Portfolio

            16.1.1.3. Profitability by Market Segments

            16.1.1.4. Sales Footprint

            16.1.1.5. Strategy Overview

                16.1.1.5.1. Marketing Strategy

                16.1.1.5.2. Product Strategy

                16.1.1.5.3. Channel Strategy

        16.1.2. AMETEK Inc.

            16.1.2.1. Overview

            16.1.2.2. Product Portfolio

            16.1.2.3. Profitability by Market Segments

            16.1.2.4. Sales Footprint

            16.1.2.5. Strategy Overview

                16.1.2.5.1. Marketing Strategy

                16.1.2.5.2. Product Strategy

                16.1.2.5.3. Channel Strategy

        16.1.3. Materion Corporation

            16.1.3.1. Overview

            16.1.3.2. Product Portfolio

            16.1.3.3. Profitability by Market Segments

            16.1.3.4. Sales Footprint

            16.1.3.5. Strategy Overview

                16.1.3.5.1. Marketing Strategy

                16.1.3.5.2. Product Strategy

                16.1.3.5.3. Channel Strategy

        16.1.4. Willow Technologies

            16.1.4.1. Overview

            16.1.4.2. Product Portfolio

            16.1.4.3. Profitability by Market Segments

            16.1.4.4. Sales Footprint

            16.1.4.5. Strategy Overview

                16.1.4.5.1. Marketing Strategy

                16.1.4.5.2. Product Strategy

                16.1.4.5.3. Channel Strategy

        16.1.5. Teledyne e2v Limited.

            16.1.5.1. Overview

            16.1.5.2. Product Portfolio

            16.1.5.3. Profitability by Market Segments

            16.1.5.4. Sales Footprint

            16.1.5.5. Strategy Overview

                16.1.5.5.1. Marketing Strategy

                16.1.5.5.2. Product Strategy

                16.1.5.5.3. Channel Strategy

        16.1.6. Sinclair Manufacturing Company

            16.1.6.1. Overview

            16.1.6.2. Product Portfolio

            16.1.6.3. Profitability by Market Segments

            16.1.6.4. Sales Footprint

            16.1.6.5. Strategy Overview

                16.1.6.5.1. Marketing Strategy

                16.1.6.5.2. Product Strategy

                16.1.6.5.3. Channel Strategy

        16.1.7. Texas Instruments Incorporated

            16.1.7.1. Overview

            16.1.7.2. Product Portfolio

            16.1.7.3. Profitability by Market Segments

            16.1.7.4. Sales Footprint

            16.1.7.5. Strategy Overview

                16.1.7.5.1. Marketing Strategy

                16.1.7.5.2. Product Strategy

                16.1.7.5.3. Channel Strategy

        16.1.8. Amkor Technology

            16.1.8.1. Overview

            16.1.8.2. Product Portfolio

            16.1.8.3. Profitability by Market Segments

            16.1.8.4. Sales Footprint

            16.1.8.5. Strategy Overview

                16.1.8.5.1. Marketing Strategy

                16.1.8.5.2. Product Strategy

                16.1.8.5.3. Channel Strategy

        16.1.9. Micross Components Inc.

            16.1.9.1. Overview

            16.1.9.2. Product Portfolio

            16.1.9.3. Profitability by Market Segments

            16.1.9.4. Sales Footprint

            16.1.9.5. Strategy Overview

                16.1.9.5.1. Marketing Strategy

                16.1.9.5.2. Product Strategy

                16.1.9.5.3. Channel Strategy

        16.1.10. Egide Group

            16.1.10.1. Overview

            16.1.10.2. Product Portfolio

            16.1.10.3. Profitability by Market Segments

            16.1.10.4. Sales Footprint

            16.1.10.5. Strategy Overview

                16.1.10.5.1. Marketing Strategy

                16.1.10.5.2. Product Strategy

                16.1.10.5.3. Channel Strategy

        16.1.11. SGA Technologies

            16.1.11.1. Overview

            16.1.11.2. Product Portfolio

            16.1.11.3. Profitability by Market Segments

            16.1.11.4. Sales Footprint

            16.1.11.5. Strategy Overview

                16.1.11.5.1. Marketing Strategy

                16.1.11.5.2. Product Strategy

                16.1.11.5.3. Channel Strategy

        16.1.12. SAES Group.

            16.1.12.1. Overview

            16.1.12.2. Product Portfolio

            16.1.12.3. Profitability by Market Segments

            16.1.12.4. Sales Footprint

            16.1.12.5. Strategy Overview

                16.1.12.5.1. Marketing Strategy

                16.1.12.5.2. Product Strategy

                16.1.12.5.3. Channel Strategy

        16.1.13. Integrated Device Technology Inc.

            16.1.13.1. Overview

            16.1.13.2. Product Portfolio

            16.1.13.3. Profitability by Market Segments

            16.1.13.4. Sales Footprint

            16.1.13.5. Strategy Overview

                16.1.13.5.1. Marketing Strategy

                16.1.13.5.2. Product Strategy

                16.1.13.5.3. Channel Strategy

        16.1.14. Televec

            16.1.14.1. Overview

            16.1.14.2. Product Portfolio

            16.1.14.3. Profitability by Market Segments

            16.1.14.4. Sales Footprint

            16.1.14.5. Strategy Overview

                16.1.14.5.1. Marketing Strategy

                16.1.14.5.2. Product Strategy

                16.1.14.5.3. Channel Strategy

        16.1.15. Mackin Technologies

            16.1.15.1. Overview

            16.1.15.2. Product Portfolio

            16.1.15.3. Profitability by Market Segments

            16.1.15.4. Sales Footprint

            16.1.15.5. Strategy Overview

                16.1.15.5.1. Marketing Strategy

                16.1.15.5.2. Product Strategy

                16.1.15.5.3. Channel Strategy

        16.1.16. Special Hermetic Products Inc.

            16.1.16.1. Overview

            16.1.16.2. Product Portfolio

            16.1.16.3. Profitability by Market Segments

            16.1.16.4. Sales Footprint

            16.1.16.5. Strategy Overview

                16.1.16.5.1. Marketing Strategy

                16.1.16.5.2. Product Strategy

                16.1.16.5.3. Channel Strategy

17. Assumptions & Acronyms Used

18. Research Methodology

Don't pay for what you don't need

Customize your report by selecting specific countries or regions and save 30%!

List of Tables

Table 1: Global Market Value (US$ Million) Forecast by Region, 2018 to 2033

Table 2: Global Market Volume (Units) Forecast by Region, 2018 to 2033

Table 3: Global Market Value (US$ Million) Forecast by Hermetic Seal, 2018 to 2033

Table 4: Global Market Volume (Units) Forecast by Hermetic Seal, 2018 to 2033

Table 5: Global Market Value (US$ Million) Forecast by Configuration, 2018 to 2033

Table 6: Global Market Volume (Units) Forecast by Configuration, 2018 to 2033

Table 7: Global Market Value (US$ Million) Forecast by Application, 2018 to 2033

Table 8: Global Market Volume (Units) Forecast by Application, 2018 to 2033

Table 9: North America Market Value (US$ Million) Forecast by Country, 2018 to 2033

Table 10: North America Market Volume (Units) Forecast by Country, 2018 to 2033

Table 11: North America Market Value (US$ Million) Forecast by Hermetic Seal, 2018 to 2033

Table 12: North America Market Volume (Units) Forecast by Hermetic Seal, 2018 to 2033

Table 13: North America Market Value (US$ Million) Forecast by Configuration, 2018 to 2033

Table 14: North America Market Volume (Units) Forecast by Configuration, 2018 to 2033

Table 15: North America Market Value (US$ Million) Forecast by Application, 2018 to 2033

Table 16: North America Market Volume (Units) Forecast by Application, 2018 to 2033

Table 17: Latin America Market Value (US$ Million) Forecast by Country, 2018 to 2033

Table 18: Latin America Market Volume (Units) Forecast by Country, 2018 to 2033

Table 19: Latin America Market Value (US$ Million) Forecast by Hermetic Seal, 2018 to 2033

Table 20: Latin America Market Volume (Units) Forecast by Hermetic Seal, 2018 to 2033

Table 21: Latin America Market Value (US$ Million) Forecast by Configuration, 2018 to 2033

Table 22: Latin America Market Volume (Units) Forecast by Configuration, 2018 to 2033

Table 23: Latin America Market Value (US$ Million) Forecast by Application, 2018 to 2033

Table 24: Latin America Market Volume (Units) Forecast by Application, 2018 to 2033

Table 25: Europe Market Value (US$ Million) Forecast by Country, 2018 to 2033

Table 26: Europe Market Volume (Units) Forecast by Country, 2018 to 2033

Table 27: Europe Market Value (US$ Million) Forecast by Hermetic Seal, 2018 to 2033

Table 28: Europe Market Volume (Units) Forecast by Hermetic Seal, 2018 to 2033

Table 29: Europe Market Value (US$ Million) Forecast by Configuration, 2018 to 2033

Table 30: Europe Market Volume (Units) Forecast by Configuration, 2018 to 2033

Table 31: Europe Market Value (US$ Million) Forecast by Application, 2018 to 2033

Table 32: Europe Market Volume (Units) Forecast by Application, 2018 to 2033

Table 33: Asia Pacific Market Value (US$ Million) Forecast by Country, 2018 to 2033

Table 34: Asia Pacific Market Volume (Units) Forecast by Country, 2018 to 2033

Table 35: Asia Pacific Market Value (US$ Million) Forecast by Hermetic Seal, 2018 to 2033

Table 36: Asia Pacific Market Volume (Units) Forecast by Hermetic Seal, 2018 to 2033

Table 37: Asia Pacific Market Value (US$ Million) Forecast by Configuration, 2018 to 2033

Table 38: Asia Pacific Market Volume (Units) Forecast by Configuration, 2018 to 2033

Table 39: Asia Pacific Market Value (US$ Million) Forecast by Application, 2018 to 2033

Table 40: Asia Pacific Market Volume (Units) Forecast by Application, 2018 to 2033

Table 41: MEA Market Value (US$ Million) Forecast by Country, 2018 to 2033

Table 42: MEA Market Volume (Units) Forecast by Country, 2018 to 2033

Table 43: MEA Market Value (US$ Million) Forecast by Hermetic Seal, 2018 to 2033

Table 44: MEA Market Volume (Units) Forecast by Hermetic Seal, 2018 to 2033

Table 45: MEA Market Value (US$ Million) Forecast by Configuration, 2018 to 2033

Table 46: MEA Market Volume (Units) Forecast by Configuration, 2018 to 2033

Table 47: MEA Market Value (US$ Million) Forecast by Application, 2018 to 2033

Table 48: MEA Market Volume (Units) Forecast by Application, 2018 to 2033
Ismail Sutaria
Ismail Sutaria

Principal Consultant

Talk to Analyst

Find your sweet spots for generating winning opportunities in this market.

List of Charts

Figure 1: Global Market Value (US$ Million) by Hermetic Seal, 2023 to 033

Figure 2: Global Market Value (US$ Million) by Configuration, 2023 to 033

Figure 3: Global Market Value (US$ Million) by Application, 2023 to 033

Figure 4: Global Market Value (US$ Million) by Region, 2023 to 033

Figure 5: Global Market Value (US$ Million) Analysis by Region, 2018 to 2033

Figure 6: Global Market Volume (Units) Analysis by Region, 2018 to 2033

Figure 7: Global Market Value Share (%) and BPS Analysis by Region, 2023 to 033

Figure 8: Global Market Y-o-Y Growth (%) Projections by Region, 2023 to 033

Figure 9: Global Market Value (US$ Million) Analysis by Hermetic Seal, 2018 to 2033

Figure 10: Global Market Volume (Units) Analysis by Hermetic Seal, 2018 to 2033

Figure 11: Global Market Value Share (%) and BPS Analysis by Hermetic Seal, 2023 to 033

Figure 12: Global Market Y-o-Y Growth (%) Projections by Hermetic Seal, 2023 to 033

Figure 13: Global Market Value (US$ Million) Analysis by Configuration, 2018 to 2033

Figure 14: Global Market Volume (Units) Analysis by Configuration, 2018 to 2033

Figure 15: Global Market Value Share (%) and BPS Analysis by Configuration, 2023 to 033

Figure 16: Global Market Y-o-Y Growth (%) Projections by Configuration, 2023 to 033

Figure 17: Global Market Value (US$ Million) Analysis by Application, 2018 to 2033

Figure 18: Global Market Volume (Units) Analysis by Application, 2018 to 2033

Figure 19: Global Market Value Share (%) and BPS Analysis by Application, 2023 to 033

Figure 20: Global Market Y-o-Y Growth (%) Projections by Application, 2023 to 033

Figure 21: Global Market Attractiveness by Hermetic Seal, 2023 to 033

Figure 22: Global Market Attractiveness by Configuration, 2023 to 033

Figure 23: Global Market Attractiveness by Application, 2023 to 033

Figure 24: Global Market Attractiveness by Region, 2023 to 033

Figure 25: North America Market Value (US$ Million) by Hermetic Seal, 2023 to 033

Figure 26: North America Market Value (US$ Million) by Configuration, 2023 to 033

Figure 27: North America Market Value (US$ Million) by Application, 2023 to 033

Figure 28: North America Market Value (US$ Million) by Country, 2023 to 033

Figure 29: North America Market Value (US$ Million) Analysis by Country, 2018 to 2033

Figure 30: North America Market Volume (Units) Analysis by Country, 2018 to 2033

Figure 31: North America Market Value Share (%) and BPS Analysis by Country, 2023 to 033

Figure 32: North America Market Y-o-Y Growth (%) Projections by Country, 2023 to 033

Figure 33: North America Market Value (US$ Million) Analysis by Hermetic Seal, 2018 to 2033

Figure 34: North America Market Volume (Units) Analysis by Hermetic Seal, 2018 to 2033

Figure 35: North America Market Value Share (%) and BPS Analysis by Hermetic Seal, 2023 to 033

Figure 36: North America Market Y-o-Y Growth (%) Projections by Hermetic Seal, 2023 to 033

Figure 37: North America Market Value (US$ Million) Analysis by Configuration, 2018 to 2033

Figure 38: North America Market Volume (Units) Analysis by Configuration, 2018 to 2033

Figure 39: North America Market Value Share (%) and BPS Analysis by Configuration, 2023 to 033

Figure 40: North America Market Y-o-Y Growth (%) Projections by Configuration, 2023 to 033

Figure 41: North America Market Value (US$ Million) Analysis by Application, 2018 to 2033

Figure 42: North America Market Volume (Units) Analysis by Application, 2018 to 2033

Figure 43: North America Market Value Share (%) and BPS Analysis by Application, 2023 to 033

Figure 44: North America Market Y-o-Y Growth (%) Projections by Application, 2023 to 033

Figure 45: North America Market Attractiveness by Hermetic Seal, 2023 to 033

Figure 46: North America Market Attractiveness by Configuration, 2023 to 033

Figure 47: North America Market Attractiveness by Application, 2023 to 033

Figure 48: North America Market Attractiveness by Country, 2023 to 033

Figure 49: Latin America Market Value (US$ Million) by Hermetic Seal, 2023 to 033

Figure 50: Latin America Market Value (US$ Million) by Configuration, 2023 to 033

Figure 51: Latin America Market Value (US$ Million) by Application, 2023 to 033

Figure 52: Latin America Market Value (US$ Million) by Country, 2023 to 033

Figure 53: Latin America Market Value (US$ Million) Analysis by Country, 2018 to 2033

Figure 54: Latin America Market Volume (Units) Analysis by Country, 2018 to 2033

Figure 55: Latin America Market Value Share (%) and BPS Analysis by Country, 2023 to 033

Figure 56: Latin America Market Y-o-Y Growth (%) Projections by Country, 2023 to 033

Figure 57: Latin America Market Value (US$ Million) Analysis by Hermetic Seal, 2018 to 2033

Figure 58: Latin America Market Volume (Units) Analysis by Hermetic Seal, 2018 to 2033

Figure 59: Latin America Market Value Share (%) and BPS Analysis by Hermetic Seal, 2023 to 033

Figure 60: Latin America Market Y-o-Y Growth (%) Projections by Hermetic Seal, 2023 to 033

Figure 61: Latin America Market Value (US$ Million) Analysis by Configuration, 2018 to 2033

Figure 62: Latin America Market Volume (Units) Analysis by Configuration, 2018 to 2033

Figure 63: Latin America Market Value Share (%) and BPS Analysis by Configuration, 2023 to 033

Figure 64: Latin America Market Y-o-Y Growth (%) Projections by Configuration, 2023 to 033

Figure 65: Latin America Market Value (US$ Million) Analysis by Application, 2018 to 2033

Figure 66: Latin America Market Volume (Units) Analysis by Application, 2018 to 2033

Figure 67: Latin America Market Value Share (%) and BPS Analysis by Application, 2023 to 033

Figure 68: Latin America Market Y-o-Y Growth (%) Projections by Application, 2023 to 033

Figure 69: Latin America Market Attractiveness by Hermetic Seal, 2023 to 033

Figure 70: Latin America Market Attractiveness by Configuration, 2023 to 033

Figure 71: Latin America Market Attractiveness by Application, 2023 to 033

Figure 72: Latin America Market Attractiveness by Country, 2023 to 033

Figure 73: Europe Market Value (US$ Million) by Hermetic Seal, 2023 to 033

Figure 74: Europe Market Value (US$ Million) by Configuration, 2023 to 033

Figure 75: Europe Market Value (US$ Million) by Application, 2023 to 033

Figure 76: Europe Market Value (US$ Million) by Country, 2023 to 033

Figure 77: Europe Market Value (US$ Million) Analysis by Country, 2018 to 2033

Figure 78: Europe Market Volume (Units) Analysis by Country, 2018 to 2033

Figure 79: Europe Market Value Share (%) and BPS Analysis by Country, 2023 to 033

Figure 80: Europe Market Y-o-Y Growth (%) Projections by Country, 2023 to 033

Figure 81: Europe Market Value (US$ Million) Analysis by Hermetic Seal, 2018 to 2033

Figure 82: Europe Market Volume (Units) Analysis by Hermetic Seal, 2018 to 2033

Figure 83: Europe Market Value Share (%) and BPS Analysis by Hermetic Seal, 2023 to 033

Figure 84: Europe Market Y-o-Y Growth (%) Projections by Hermetic Seal, 2023 to 033

Figure 85: Europe Market Value (US$ Million) Analysis by Configuration, 2018 to 2033

Figure 86: Europe Market Volume (Units) Analysis by Configuration, 2018 to 2033

Figure 87: Europe Market Value Share (%) and BPS Analysis by Configuration, 2023 to 033

Figure 88: Europe Market Y-o-Y Growth (%) Projections by Configuration, 2023 to 033

Figure 89: Europe Market Value (US$ Million) Analysis by Application, 2018 to 2033

Figure 90: Europe Market Volume (Units) Analysis by Application, 2018 to 2033

Figure 91: Europe Market Value Share (%) and BPS Analysis by Application, 2023 to 033

Figure 92: Europe Market Y-o-Y Growth (%) Projections by Application, 2023 to 033

Figure 93: Europe Market Attractiveness by Hermetic Seal, 2023 to 033

Figure 94: Europe Market Attractiveness by Configuration, 2023 to 033

Figure 95: Europe Market Attractiveness by Application, 2023 to 033

Figure 96: Europe Market Attractiveness by Country, 2023 to 033

Figure 97: Asia Pacific Market Value (US$ Million) by Hermetic Seal, 2023 to 033

Figure 98: Asia Pacific Market Value (US$ Million) by Configuration, 2023 to 033

Figure 99: Asia Pacific Market Value (US$ Million) by Application, 2023 to 033

Figure 100: Asia Pacific Market Value (US$ Million) by Country, 2023 to 033

Figure 101: Asia Pacific Market Value (US$ Million) Analysis by Country, 2018 to 2033

Figure 102: Asia Pacific Market Volume (Units) Analysis by Country, 2018 to 2033

Figure 103: Asia Pacific Market Value Share (%) and BPS Analysis by Country, 2023 to 033

Figure 104: Asia Pacific Market Y-o-Y Growth (%) Projections by Country, 2023 to 033

Figure 105: Asia Pacific Market Value (US$ Million) Analysis by Hermetic Seal, 2018 to 2033

Figure 106: Asia Pacific Market Volume (Units) Analysis by Hermetic Seal, 2018 to 2033

Figure 107: Asia Pacific Market Value Share (%) and BPS Analysis by Hermetic Seal, 2023 to 033

Figure 108: Asia Pacific Market Y-o-Y Growth (%) Projections by Hermetic Seal, 2023 to 033

Figure 109: Asia Pacific Market Value (US$ Million) Analysis by Configuration, 2018 to 2033

Figure 110: Asia Pacific Market Volume (Units) Analysis by Configuration, 2018 to 2033

Figure 111: Asia Pacific Market Value Share (%) and BPS Analysis by Configuration, 2023 to 033

Figure 112: Asia Pacific Market Y-o-Y Growth (%) Projections by Configuration, 2023 to 033

Figure 113: Asia Pacific Market Value (US$ Million) Analysis by Application, 2018 to 2033

Figure 114: Asia Pacific Market Volume (Units) Analysis by Application, 2018 to 2033

Figure 115: Asia Pacific Market Value Share (%) and BPS Analysis by Application, 2023 to 033

Figure 116: Asia Pacific Market Y-o-Y Growth (%) Projections by Application, 2023 to 033

Figure 117: Asia Pacific Market Attractiveness by Hermetic Seal, 2023 to 033

Figure 118: Asia Pacific Market Attractiveness by Configuration, 2023 to 033

Figure 119: Asia Pacific Market Attractiveness by Application, 2023 to 033

Figure 120: Asia Pacific Market Attractiveness by Country, 2023 to 033

Figure 121: MEA Market Value (US$ Million) by Hermetic Seal, 2023 to 033

Figure 122: MEA Market Value (US$ Million) by Configuration, 2023 to 033

Figure 123: MEA Market Value (US$ Million) by Application, 2023 to 033

Figure 124: MEA Market Value (US$ Million) by Country, 2023 to 033

Figure 125: MEA Market Value (US$ Million) Analysis by Country, 2018 to 2033

Figure 126: MEA Market Volume (Units) Analysis by Country, 2018 to 2033

Figure 127: MEA Market Value Share (%) and BPS Analysis by Country, 2023 to 033

Figure 128: MEA Market Y-o-Y Growth (%) Projections by Country, 2023 to 033

Figure 129: MEA Market Value (US$ Million) Analysis by Hermetic Seal, 2018 to 2033

Figure 130: MEA Market Volume (Units) Analysis by Hermetic Seal, 2018 to 2033

Figure 131: MEA Market Value Share (%) and BPS Analysis by Hermetic Seal, 2023 to 033

Figure 132: MEA Market Y-o-Y Growth (%) Projections by Hermetic Seal, 2023 to 033

Figure 133: MEA Market Value (US$ Million) Analysis by Configuration, 2018 to 2033

Figure 134: MEA Market Volume (Units) Analysis by Configuration, 2018 to 2033

Figure 135: MEA Market Value Share (%) and BPS Analysis by Configuration, 2023 to 033

Figure 136: MEA Market Y-o-Y Growth (%) Projections by Configuration, 2023 to 033

Figure 137: MEA Market Value (US$ Million) Analysis by Application, 2018 to 2033

Figure 138: MEA Market Volume (Units) Analysis by Application, 2018 to 2033

Figure 139: MEA Market Value Share (%) and BPS Analysis by Application, 2023 to 033

Figure 140: MEA Market Y-o-Y Growth (%) Projections by Application, 2023 to 033

Figure 141: MEA Market Attractiveness by Hermetic Seal, 2023 to 033

Figure 142: MEA Market Attractiveness by Configuration, 2023 to 033

Figure 143: MEA Market Attractiveness by Application, 2023 to 033

Figure 144: MEA Market Attractiveness by Country, 2023 to 033

Recommendations

Packaging

Beverage Packaging Market

Published : October 2023

Packaging

FMCG Packaging Market

Published : May 2023

Explore Packaging Insights

View Reports

Hermetic Packaging Market