This site uses cookies, including third-party cookies, that help us to provide and improve our services.

Privacy Policy
- Global Locations -
Headquarters
Future Market Insights, Inc.
Christiana Corporate, 200 Continental Drive, Suite 401, Newark, Delaware - 19713, United States
T: +1-845-579-5705
MEA
Market Access DMCC

1602-6 Jumeirah Bay X2 Tower, Plot No: JLT-PH2-X2A,

Jumeirah Lakes Towers, Dubai,

United Arab Emirates

Americas
Future Market Insights
616 Corporate Way, Suite 2-9018,
Valley Cottage, NY 10989,
United States
T: +1-347-918-3531
Europe
Future Market Insights
3rd Floor, 207 Regent Street,
London W1B 3HH
United Kingdom
T: + 44 (0) 20 8123 9659
D: +44 (0) 20 3287 4268
APAC
Future Market Insights
Office No. 401-A, 4th Floor,
VANTAGE 9, S.No. 36/1/1,
Baner, Pune 411045 India

High Voltage Direct Current (HVDC) Transmission System Market

Why is High Voltage Direct Current (HVDC) Transmission System Gaining Prominence in the Electricity Industry? Read in FMI’s Survey!

High Voltage Direct Current (HVDC) Transmission System Market by Component, Technology, Application, Deployment, Power Rating & Region | Forecast 2022 to 2032

High Voltage Direct Current (HVDC) Transmission System Market Outlook (2022 to 2032)

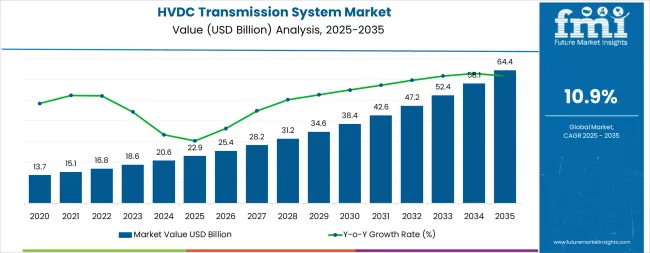
[250 Pages Report] The global high voltage direct current (HVDC) transmission system market revenue totaled ~US$ 9,484.0 million in 2021. The high voltage direct current (HVDC) transmission system market is expected to reach ~US$ 28,508.2 million by 2032, growing at a CAGR of 10.6% in the forthcoming years (2022 to 2032).

Attributes

Key Insights

Global High Voltage Direct Current (HVDC) Transmission System Market Estimated Size (2022E)

US$ 10,380.2 million

Projected Market Valuation (2032F)

US$ 28,508.2 million

Value-based CAGR (2022 to 2032)

10.6%

Collective Value Share: Top 5 Vendor Market Share

Around 45%

High voltage direct current transmission system helps with the transmission of power over a long distance. HVDC systems use direct current (DC) for power transmission. The system can also interconnect networks that verify frequencies and features. HVDC systems are considered to have more features than AC lines. The global HVDC transmission system market holds nearly 15% of the share in the power transmission and distribution market.

The high voltage direct current (HVDC) transmission system market in East Asia is expected to grow at the fastest rate. During the forecast period, the region is anticipated to exhibit growth at 12.8% CAGR. The presence of various key players such as Toshiba Corporation, Hitachi Ltd., NR Electric Co. Ltd, LS Industrial Systems Co., Ltd., and Mitsubishi Electric Corporation, is also expected to contribute to growth in the HVDC transmission system market in the region.

Customize this Report

Let us know your requirement to get
100% FREE customization

2017-2021 Global High Voltage Direct Current (HVDC) Transmission System Demand Outlook Compared to 2022-2032 Forecast

The global high voltage direct current (HVDC) transmission system market is estimated to grow at 10.6% CAGR between 2022 and 2032, as compared to the 8.8% CAGR witnessed during the historical period of 2017 to 2021. The HVDC transmission system uses two technologies, namely, voltage source converter (VSC) and line commutated converter (LCC).

Growing demand for VSC-based high voltage direct current (VSC-HVDC) transmission systems that offer total flow control in both directions, stop fault propagation, and lower network losses are anticipated to push the market. When it comes to boosting the use of renewable energy globally and enhancing grid stability, VSC-HVDC transmission systems play a significant role, which is further expected to propel the market.

Additionally, VSC-HVDC transmission systems have experienced a sharp increase in terms of utilization in recent years as it helps to stabilize current AC grids. VSC technology also has several advantages, including voltage stabilization, stable transients, and black start capabilities. Hence, demand for VSC-HVDC transmission systems would grow at a fast pace, thereby driving the global high voltage direct current (HVDC) transmission system market.

High Voltage Direct Current (HVDC) Transmission System Market Download Report Brochure

Country-wise Insights

Why is the Adoption of High Voltage Direct Current (HVDC) Transmission Systems Increasing in China?

Electricity Generation Projects in China to Require Ultra-High Voltage DC Power Transmission

The high voltage direct current (HVDC) transmission system market in China accounted for nearly 43.9% of the share in East Asia in 2021, says FMI. Rising electricity consumption due to the growing population and rapid industrialization is likely to push growth in the market. In recent years, the country experienced the highest power consumption in the residential, commercial, and industrial sectors.

For instance, in July 2022, a major component of China's West-to-East power transmission project went live. The country’s West-to-East power transmission initiative aims to balance China’s electricity supply and demand in multiple areas. It transfers surplus electricity from Western areas, which are rich in power-generating resources to Eastern areas that require a large amount of electricity to boost economic activity.

Why Are Sales of High Voltage Direct Current (HVDC) Transmission Systems Growing Rapidly in India?

Rising Demand for Electricity in India to Drive Sales of High Voltage Capacitors

India is expected to account for the largest share of nearly 36.2% in 2022 in the high voltage direct current (HVDC) transmission system market in South Asia & Pacific. Ongoing development of HVDC transmission system infrastructure and rising demand for electricity transformation in the commercial, residential, and industrial sectors are helping to boost the market in India.

To fulfill the requirement of electricity transformation to support economic growth, investments in high-voltage direct current transmission systems have increased in India. For instance, Tamil Nadu Electricity Regulatory Commission approved the development of the Raigarh-Pugalur HVDC line project in 2017 and the project was completed in 2020. More than 80 million people's electricity needs can be satisfied by this 800 kV transmission link.

How Will the High Voltage Direct Current (HVDC) Transmission System Industry Grow in Canada?

High Demand for Voltage-sourced Converters in Canada to Drive Sales of High Voltage DC Current

Canada offers one of the cleanest electricity networks in the world. The country’s electricity sector is a significant capital investment in an effort to improve its infrastructure. Growing industrialization and rising demand for voltage-sourced converters, a shift towards renewable energy sources, and a growing number of factory units for making effective solutions to transmit electricity over long distances would help boost the market.

Also, more than 35 electrical transmission interconnections connect the Canadian and American electricity networks, providing a fully interconnected infrastructure. The country's plan to implement 30 GW of offshore wind energy projects by 2030 is predicted to offer several opportunities for high-voltage direct current (HVDC) transmission systems. The rapid expansion of Canada's transmission electricity network is expected to boost the country's high voltage direct current (HVDC) transmission systems market throughout the forecast period.

Sudip Saha
Sudip Saha
Principal Consultant
LinkedIn
Talk to Analyst

Find your sweet spots for generating winning opportunities in this market.

Talk to Analyst

Category-wise Insights

Which is the Highly Preferred Technology?

Line Commutated Converter (LCC) Technology to Be Used in High Voltage DC Current

Based on technology, the line commutated converter (LCC) segment is expected to account for the largest share of 31.6% in 2022 in the high voltage direct current (HVDC) transmission system market. A line commutated converter (LCC) is a low-cost device that uses thermistor power semiconductors to operate. These semiconductors allow for the bulk transmission of electricity with very low losses.

The technology also incorporates built-in DC fault prevention. The voltage source converter is extensively used in HVDC transmission systems. It is built by using power transistors. This method is commonly used in land cable connections/submarines, with renewables, offshore, and urban applications all incorporated. Due to the aforementioned factors, demand for LCC technology is projected to increase during the forecast period in the high voltage direct current (HVDC) transmission system market.

Which is the Dominant Application of HVDC Transmission Systems?

DC Current Long Distance Transmission Lines to Gain Impetus in Renewable Energy Industry

The development and implementation of a new energy system based on renewable sources are being built atop the foundation of HVDC transmission lines. Solar and wind power systems are a part of renewable energy sources that are extremely unstable and situated in remote locations. Long-haul transmission lines can transfer power with the highest efficiency and few losses, which is helping the ever-evolving HVDC technology to advance in the new energy economy.

Development of new solar power stations, interconnection of existing power plants, and integration of offshore wind energy projects are three ways by which HVDC lines are expected to advance the development of renewable energy generation systems in the future. Among the essential elements of HVDC technology, which adds distinctive features to the contemporary direct current (DC) transmission system, are power semiconductors, high-voltage cables, and converters.

It is widely known that the electricity sector is changing as a result of the rising integration of renewable energy and the pressing need to cut carbon emissions. Consequently, it is anticipated that rising energy demand and the ongoing development of the renewable energy industry would present the high voltage direct current (HVDC) transmission system market with sizable potential prospects.

Which is the Most Preferred Mode of Deployment?

High Voltage DC Current Systems to Be Extensively Installed under the Sea

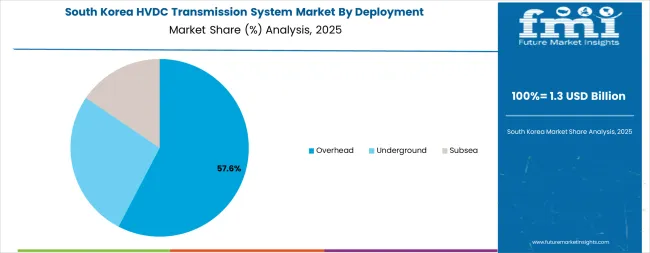
HVDC subsea transmission technology is mainly used in single point-to-point connections. The system provides a high grade of effectiveness. The current maximum HVDC power under consideration is up to +/- 600 kV and 2.200 MW per bipole as a system. HVDC subsea cable systems can interconnect ocean substations on platforms to a mainland system in addition to serving as an interconnector.

Offshore platforms can perform two major functions, namely, they can transport electricity generated by one or more offshore wind turbines to shore or they can act as a power distribution center for offshore oil and gas operations. With very low transmission losses, the cost of operation of the HVDC subsea cable system is negligible.

Subsea HVDC cables require practically no maintenance. Due to the above-mentioned factors, the installation and use of subsea transmission technology have increased at a rapid pace. Thus, the subsea segment under technology is projected to dominate the global high voltage direct current (HVDC) transmission system market.

Competitive Landscape

Key players in the high voltage direct current (HVDC) transmission system market are concentrating on various tactics to increase their research & development spending in order to update their technologies to meet the changing consumer demand. In order to meet the rising client demand, numerous organizations are also acquiring and forming partnerships with other businesses to establish their own high voltage direct current (HVDC) transmission system solutions.

For instance:

  • In October 2021, Hitachi ABB signed a contract to build an interconnection that allows Saudi Arabia and Egypt to interchange up to 3000 MW of power. With the help of this project, the 1350-kilometer-long connecting line will transfer electricity through overhead power lines and a subsea cable across the Red Sea.
  • In June 2021, for an underground transmission project in the USA, Prysmian Group was hired to provide high-voltage DC cable systems. The SOO Green HVDC Link, which is a 2100 MW interregional transmission project connecting two of the biggest energy markets in the USA, was a component of this deal.
MarketNage
Become a MarketNgage Insider

A unified Market Research Subscription Platform, built for today's disparate research needs.

Siemens and Toshiba Aim to Bag New HVDC Transmission System Development Projects to Remain at the Forefront

High voltage direct current (HVDC) transmission system manufacturers are focusing on various business strategies to boost their profits. From mergers and acquisitions to joint ventures and strategic agreements, HVDC manufacturers are taking numerous steps to consolidate their positions. For instance, Siemens, a leading manufacturer of HVDC transmission systems announced in 2021 that it is building the first high-voltage direct current (HVDC) link using voltage-sourced converter (VSC) technology in India.

Siemens is conducting this project in collaboration with Power Grid Corporation of India Ltd. (PGCIL). The 320 kilovolts (kV) HVDC system has been developed by Siemens Limited in collaboration with a group that included Sumitomo Electric Industries Ltd., Japan, and Siemens Energy (Germany). It features the integration of high voltage direct current XLPE cable with overhead lines for the first time in India.

Further, for New York's first utility-scale offshore wind project, Sunrise Wind, Siemens Energy has partnered with Aker Solutions to gain a contract to provide a high-voltage direct current (HVDC) transmission system. This joint venture has a capacity of about 924MW, and it will help achieve its goal of 100% clean electricity in New York by 2040.

Siemens also announced in 2021 that it is working on a project to connect the electricity grids of the United Kingdom and Ireland. The 190km Greenlink electrical interconnector will use high-voltage direct current (HVDC) cable, which Siemens Energy will develop in collaboration with Sumitomo Electric. For this 500MW HVDC link project, the company will design and construct two converter stations.

Siemens is also focusing on consolidating its position in the European market, as the region is lucrative for HVDC transmission system manufacturers. For instance, it is developing an HVDC link that will connect Crete, Greece's largest and most populous island, with the country's mainland. In order to increase power supply stability and make it easier to integrate renewable energy sources into the power grid, the project will allow for the interchange of up to 1,000 megawatts (MW) of electricity. The interconnector will be put into service sometime in the middle of 2023.

Toshiba, another leading manufacturer of HVDC transmission systems is also focusing on boosting its position through restructuring and spin-offs. In 2021, the company announced a major restructuring that resulted in the creation of two distinct businesses with unique business traits, each of which will be a leader in its industry in terms of achieving carbon neutrality and infrastructure resilience (Infrastructure Service Co.), as well as advancing social and IT infrastructure (Device Co.). Each organization can dramatically narrow its emphasis, thanks to the separation, which also enables more swift decision-making and more efficient cost structures.

Further, Toshiba is concentrating on accelerating its perception as a renowned provider of HVDC transmission systems through conferences and events. In 2021, the company revealed the first commercial quantum-secured metro network in London. The network will be able to connect a large number of users in London, enabling them to use quantum key distribution to encrypt the transmission of important data and information across various physical locations by using conventional fiber optic cables (QKD). The London network is an important step in realizing the United Kingdom government's plan to transform the nation's economy into a quantum-enabled one.

Scope of the Report

Attribute

Details

Estimated Market Size (2022)

US$ 10,380.2 million

Projected Market Valuation (2032)

US$ 28,508.2 million

Value-based CAGR (2022 to 2032)

10.6%

Forecast Period

2022 to 2032

Historical Data Available for

2017 to 2021

Market Analysis

Value (US$ million)

Key Regions Covered

North America, Latin America, Europe, East Asia, South Asia & Pacific, and the Middle East & Africa

Key Countries Covered

USA, Canada, Germany, United Kingdom, France, Italy, Spain, Russia, China, Japan, South Korea, India, Malaysia, Indonesia, Singapore, Australia & New Zealand, GCC Countries, Turkey, North Africa, and South Africa

Key Segments Covered

Component, Technology, Application, Deployment, Power Rating, and Region

Key Companies Profiled

  • ABB
  • Siemens AG
  • Toshiba Corporation
  • General Electric
  • Mitsubishi Electric Corporation
  • Prysmian SpA
  • TransGrid Solutions Inc.
  • Abengoa S.A.
  • ATCO Ltd.
  • LS Industrial Systems Co., Ltd.
  • Nexans
  • Hitachi Energy Ltd.
  • NKT (Nordiske Kabel og Traadfabriker)
  • NR Electric Co., Ltd.

Report Coverage

Market Forecast, Company Share Analysis, Competition Intelligence, DROT Analysis, Market Dynamics and Challenges, and Strategic Growth Initiatives

High Voltage Direct Current (HVDC) Transmission System Market Outlook by Category

By Component:

  • Products
    • AC & DC Harmonic Filters
    • Converters
    • DC Lines
    • Circuit Breakers
    • Others
  • Services
    • Repairs & Maintenance
    • Engineering & Consulting

By Technology:

  • Line Commutated Converters (LCC)
  • Voltage Source Converters (VSC)
  • Others

By Application:

  • Energy Transmission & Distribution
  • Distributed Energy Resources (DER)
  • Renewable Energy

By Deployment:

  • Overhead
  • Underground
  • Subsea
  • Combination

By Power Rating:

  • Below 1000 MW
  • 1001 - 2000 MW
  • Above 2000 MW

By Region:

  • North America
  • Latin America
  • Europe
  • East Asia
  • South Asia & Pacific
  • The Middle East and Africa (MEA)

Frequently Asked Questions

East Asia is projected to exhibit a CAGR of nearly 12.8% during the forecast period with a high voltage direct current (HVDC) transmission system market share of around 13.8% in 2022.

The high voltage direct current transmission system market was valued at ~US$ 9,484.0 million in 2021 and is estimated to grow at a CAGR of 10.6% in the next decade.

The high voltage direct current (HVDC) transmission system market is expected to reach ~US$ 10,380.2 million by the end of 2022 and is likely to be valued at ~US$ 28,508.2 million by 2032.

The high voltage direct current (HVDC) transmission system market grew at a CAGR of 8.8% in the historical period (2017 to 2021).

Rising demand for electricity transformation in the commercial, residential, and industrial sectors is driving the high voltage direct current (HVDC) transmission system market.

The top 5 countries driving the high voltage direct current (HVDC) transmission system market are China, Canada, India, Germany, and Japan.

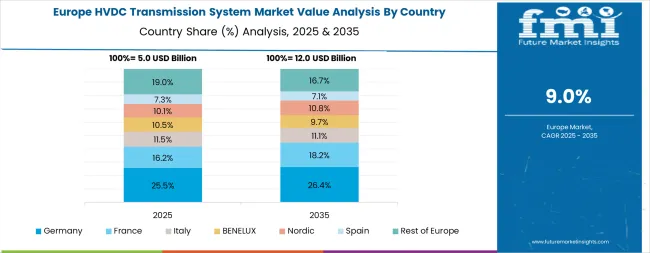
In Europe, the United Kingdom is expected to account for nearly 28.6% of the high voltage direct current (HVDC) transmission system market share through 2032.

The high voltage direct current (HVDC) transmission system market in Japan and South Korea was valued at ~US$ 404.6 million and ~US$ 313.7 million in 2021, respectively, and is projected to register CAGRs of around 14.6% and 12.2%, respectively, between 2022 and 2032.

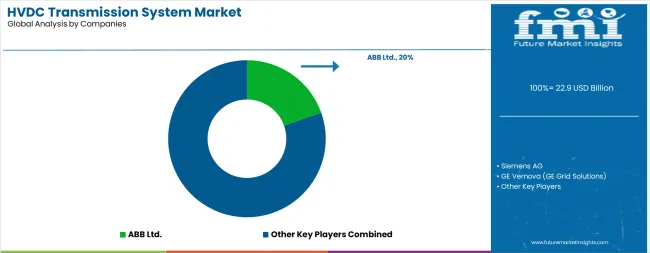
ABB, Siemens AG, Toshiba Corporation, General Electric, and Mitsubishi Electric Corporation are some of the leading vendors in the high voltage direct current (HVDC) transmission system market.

Table of Content

1. Executive Summary | High Voltage Direct Current Transmission System Market

    1.1. Global Market Outlook

    1.2. Demand Side Trends

    1.3. Supply Side Trends

    1.4. Analysis and Recommendations

2. Market Overview

    2.1. Market Coverage / Taxonomy

    2.2. Market Definition / Scope / Limitations

3. Key Market Trends

    3.1. Key Trends Impacting the Market

        3.1.1. Global Energy Expenditure

        3.1.2. Current and Future Projects for Power Transmission

    3.2. Governments’ Energy Department Budgets

    3.3. High Voltage Direct Current (HVDC) Transmission System Innovation / Development Trends

4. Pricing Analysis

    4.1. Pricing analysis, By Product Type

    4.2. Global Average Pricing Analysis Benchmark

5. Global High Voltage Direct Current (HVDC) Transmission System Demand (in Value in US$ million) Analysis 2017 to 2021 and Forecast, 2022 to 2032

    5.1. Historical Market Value (US$ million) Analysis, 2017 to 2021

    5.2. Current and Future Market Value (US$ million) Projections, 2022 to 2032

        5.2.1. Y-o-Y Growth Trend Analysis

        5.2.2. Absolute $ Opportunity Analysis

6. Market Background

    6.1. Macro-Economic Factors

    6.2. Forecast Factors - Relevance & Impact

    6.3. Value Chain

    6.4. COVID-19 Impact Analysis

        6.4.1. Pre-COVID-19 Market Growth (2017 to 2019)

        6.4.2. Expected Recovery Scenario (Short Term/Mid Term/Long Term)

    6.5. Market Dynamics

        6.5.1. Drivers

        6.5.2. Restraints

        6.5.3. Opportunities

7. Global High Voltage Direct Current (HVDC) Transmission System Analysis 2017 to 2021 and Forecast 2022 to 2032, by Component

    7.1. Introduction / Key Findings

    7.2. Historical Market Size (US$ million) Analysis By Component, 2017 to 2021

    7.3. Current and Future Market Size (US$ million) Analysis and Forecast By Component, 2022 to 2032

        7.3.1. Product

            7.3.1.1. AC & DC Harmonic Filters

            7.3.1.2. Converters

            7.3.1.3. DC Lines

            7.3.1.4. Circuit Breakers

            7.3.1.5. Others

        7.3.2. Services

            7.3.2.1. Repairs & Maintenance

            7.3.2.2. Engineering & Consulting

    7.4. Market Attractiveness Analysis By Component

8. Global High Voltage Direct Current (HVDC) Transmission System Analysis 2017 to 2021 and Forecast 2022 to 2032, by Technology

    8.1. Introduction / Key Findings

    8.2. Historical Market Size (US$ million) Analysis By Technology, 2017 to 2021

    8.3. Current and Future Market Size (US$ million) Analysis and Forecast By Technology, 2022 to 2032

        8.3.1. LCC (Line Commutated Converters)

        8.3.2. VSC (Voltage Source Converters)

        8.3.3. Others

    8.4. Market Attractiveness Analysis By Technology

9. Global High Voltage Direct Current (HVDC) Transmission System Analysis 2017 to 2021 and Forecast 2022 to 2032, by Application

    9.1. Introduction / Key Findings

    9.2. Historical Market Size (US$ million) Analysis By Application, 2017 to 2021

    9.3. Current and Future Market Size (US$ million) Analysis and Forecast By Application, 2022 to 2032

        9.3.1. Energy Transmission & Distribution

        9.3.2. Distributed Energy Resources (DER)

        9.3.3. Renewable Energy

    9.4. Market Attractiveness Analysis By Application

10. Global High Voltage Direct Current (HVDC) Transmission System Analysis 2017 to 2021 and Forecast 2022 to 2032, by Deployment

    10.1. Introduction / Key Findings

    10.2. Historical Market Size (US$ million) Analysis By Deployment, 2017 to 2021

    10.3. Current and Future Market Size (US$ million) Analysis and Forecast By Deployment, 2022 to 2032

        10.3.1. Overhead

        10.3.2. Underground

        10.3.3. Subsea

        10.3.4. Combination

    10.4. Market Attractiveness Analysis By Deployment

11. Global High Voltage Direct Current (HVDC) Transmission System Analysis 2017 to 2021 and Forecast 2022 to 2032, by Power Rating

    11.1. Introduction / Key Findings

    11.2. Historical Market Size (US$ million) Analysis By Power Rating, 2017 to 2021

    11.3. Current and Future Market Size (US$ million) Analysis and Forecast By Power Rating, 2022 to 2032

        11.3.1. Below 1000 MW

        11.3.2. 1001 - 2000 MW

        11.3.3. Above 2000 MW

    11.4. Market Attractiveness Analysis By Power Rating

12. Global High Voltage Direct Current (HVDC) Transmission System Analysis 2017 to 2021 and Forecast 2022 to 2032, by Region

    12.1. Introduction / Key Findings

    12.2. Historical Market Size (US$ million) Analysis By Region, 2017 to 2021

    12.3. Current and Future Market Size (US$ million) Analysis and Forecast By Region, 2022 to 2032

        12.3.1. North America

        12.3.2. Latin America

        12.3.3. Europe

        12.3.4. East Asia

        12.3.5. South Asia & Pacific

        12.3.6. Middle East & Africa

    12.4. Market Attractiveness Analysis By Region

13. North America High Voltage Direct Current (HVDC) Transmission System Analysis 2017 to 2021 and Forecast 2022 to 2032

    13.1. Introduction

    13.2. Historical Market Size (US$ million) Trend Analysis By Market Taxonomy, 2017 to 2021

    13.3. Current and Future Market Size (US$ million) Forecast By Market Taxonomy, 2022 to 2032

        13.3.1. By Component

        13.3.2. By Technology

        13.3.3. By Application

        13.3.4. By Deployment

        13.3.5. By Power Rating

        13.3.6. By Country

            13.3.6.1. The USA

            13.3.6.2. Canada

    13.4. Market Attractiveness Analysis

        13.4.1. By Component

        13.4.2. By Technology

        13.4.3. By Application

        13.4.4. By Deployment

        13.4.5. By Power Rating

        13.4.6. By Country

    13.5. Market Trends

    13.6. Key Market Participants - Intensity Mapping

14. Latin America High Voltage Direct Current (HVDC) Transmission System Analysis 2017 to 2021 and Forecast 2022 to 2032

    14.1. Introduction

    14.2. Historical Market Size (US$ million) Trend Analysis By Market Taxonomy, 2017 to 2021

    14.3. Current and Future Market Size (US$ million) Forecast By Market Taxonomy, 2022 to 2032

        14.3.1. By Component

        14.3.2. By Technology

        14.3.3. By Application

        14.3.4. By Deployment

        14.3.5. By Power Rating

        14.3.6. By Country

            14.3.6.1. Brazil

            14.3.6.2. Mexico

            14.3.6.3. Rest of Latin America

    14.4. Market Attractiveness Analysis

        14.4.1. By Component

        14.4.2. By Technology

        14.4.3. By Application

        14.4.4. By Deployment

        14.4.5. By Power Rating

        14.4.6. By Country

    14.5. Market Trends

    14.6. Key Market Participants - Intensity Mapping

15. Europe High Voltage Direct Current (HVDC) Transmission System Analysis 2017 to 2021 and Forecast 2022 to 2032

    15.1. Introduction

    15.2. Historical Market Size (US$ million) Trend Analysis By Market Taxonomy, 2017 to 2021

    15.3. Current and Future Market Size (US$ million) Forecast By Market Taxonomy, 2022 to 2032

        15.3.1. By Component

        15.3.2. By Technology

        15.3.3. By Application

        15.3.4. By Deployment

        15.3.5. By Power Rating

        15.3.6. By Country

            15.3.6.1. Germany

            15.3.6.2. Italy

            15.3.6.3. France

            15.3.6.4. The United Kingdom

            15.3.6.5. Spain

            15.3.6.6. BENELUX

            15.3.6.7. Russia

            15.3.6.8. Rest of Europe

    15.4. Market Attractiveness Analysis

        15.4.1. By Component

        15.4.2. By Technology

        15.4.3. By Application

        15.4.4. By Deployment

        15.4.5. By Power Rating

        15.4.6. By Country

    15.5. Market Trends

    15.6. Key Market Participants - Intensity Mapping

16. South Asia & Pacific High Voltage Direct Current (HVDC) Transmission System Analysis 2017 to 2021 and Forecast 2022 to 2032

    16.1. Introduction

    16.2. Historical Market Size (US$ million) Trend Analysis By Market Taxonomy, 2017 to 2021

    16.3. Current and Future Market Size (US$ million) Forecast By Market Taxonomy, 2022 to 2032

        16.3.1. By Component

        16.3.2. By Technology

        16.3.3. By Application

        16.3.4. By Deployment

        16.3.5. By Power Rating

        16.3.6. By Country

            16.3.6.1. India

            16.3.6.2. Thailand

            16.3.6.3. Indonesia

            16.3.6.4. Malaysia

            16.3.6.5. Australia & New Zealand

            16.3.6.6. Rest of South Asia

    16.4. Market Attractiveness Analysis

        16.4.1. By Component

        16.4.2. By Technology

        16.4.3. By Application

        16.4.4. By Deployment

        16.4.5. By Power Rating

        16.4.6. By Country

    16.5. Market Trends

    16.6. Key Market Participants - Intensity Mapping

17. East Asia High Voltage Direct Current (HVDC) Transmission System Analysis 2017 to 2021 and Forecast 2022 to 2032

    17.1. Introduction

    17.2. Historical Market Size (US$ million) Trend Analysis By Market Taxonomy, 2017 to 2021

    17.3. Current and Future Market Size (US$ million) Forecast By Market Taxonomy, 2022 to 2032

        17.3.1. By Component

        17.3.2. By Technology

        17.3.3. By Application

        17.3.4. By Deployment

        17.3.5. By Power Rating

        17.3.6. By Country

            17.3.6.1. China

            17.3.6.2. Japan

            17.3.6.3. South Korea

    17.4. Market Attractiveness Analysis

        17.4.1. By Component

        17.4.2. By Technology

        17.4.3. By Application

        17.4.4. By Deployment

        17.4.5. By Power Rating

        17.4.6. By Country

    17.5. Market Trends

    17.6. Key Market Participants - Intensity Mapping

18. Middle East and Africa High Voltage Direct Current (HVDC) Transmission System Analysis 2017 to 2021 and Forecast 2022 to 2032

    18.1. Introduction

    18.2. Historical Market Size (US$ million) Trend Analysis By Market Taxonomy, 2017 to 2021

    18.3. Current and Future Market Size (US$ million) Forecast By Market Taxonomy, 2022 to 2032

        18.3.1. By Component

        18.3.2. By Technology

        18.3.3. By Application

        18.3.4. By Deployment

        18.3.5. By Power Rating

        18.3.6. By Country

            18.3.6.1. GCC Countries

            18.3.6.2. Turkey

            18.3.6.3. Northern Africa

            18.3.6.4. South Africa

            18.3.6.5. Rest of Middle East and Africa

    18.4. Market Attractiveness Analysis

        18.4.1. By Component

        18.4.2. By Technology

        18.4.3. By Application

        18.4.4. By Deployment

        18.4.5. By Power Rating

        18.4.6. By Country

    18.5. Market Trends

    18.6. Key Market Participants - Intensity Mapping

19. Key Countries Analysis- High Voltage Direct Current (HVDC) Transmission System

    19.1. The USA

        19.1.1. By Component

        19.1.2. By Technology

        19.1.3. By Application

        19.1.4. By Deployment

        19.1.5. By Power Rating

    19.2. Canada

        19.2.1. By Component

        19.2.2. By Technology

        19.2.3. By Application

        19.2.4. By Deployment

        19.2.5. By Power Rating

    19.3. Mexico

        19.3.1. By Component

        19.3.2. By Technology

        19.3.3. By Application

        19.3.4. By Deployment

        19.3.5. By Power Rating

    19.4. Brazil

        19.4.1. By Component

        19.4.2. By Technology

        19.4.3. By Application

        19.4.4. By Deployment

        19.4.5. By Power Rating

    19.5. Germany

        19.5.1. By Component

        19.5.2. By Technology

        19.5.3. By Application

        19.5.4. By Deployment

        19.5.5. By Power Rating

    19.6. Italy

        19.6.1. By Component

        19.6.2. By Technology

        19.6.3. By Application

        19.6.4. By Deployment

        19.6.5. By Power Rating

    19.7. France

        19.7.1. By Component

        19.7.2. By Technology

        19.7.3. By Application

        19.7.4. By Deployment

        19.7.5. By Power Rating

    19.8. The United Kingdom

        19.8.1. By Component

        19.8.2. By Technology

        19.8.3. By Application

        19.8.4. By Deployment

        19.8.5. By Power Rating

    19.9. Spain

        19.9.1. By Component

        19.9.2. By Technology

        19.9.3. By Application

        19.9.4. By Deployment

        19.9.5. By Power Rating

    19.10. BENELUX

        19.10.1. By Component

        19.10.2. By Technology

        19.10.3. By Application

        19.10.4. By Deployment

        19.10.5. By Power Rating

    19.11. Russia

        19.11.1. By Component

        19.11.2. By Technology

        19.11.3. By Application

        19.11.4. By Deployment

        19.11.5. By Power Rating

    19.12. China

        19.12.1. By Component

        19.12.2. By Technology

        19.12.3. By Application

        19.12.4. By Deployment

        19.12.5. By Power Rating

    19.13. Japan

        19.13.1. By Component

        19.13.2. By Technology

        19.13.3. By Application

        19.13.4. By Deployment

        19.13.5. By Power Rating

    19.14. South Korea

        19.14.1. By Component

        19.14.2. By Technology

        19.14.3. By Application

        19.14.4. By Deployment

        19.14.5. By Power Rating

    19.15. India

        19.15.1. By Component

        19.15.2. By Technology

        19.15.3. By Application

        19.15.4. By Deployment

        19.15.5. By Power Rating

    19.16. ASEAN

        19.16.1. By Component

        19.16.2. By Technology

        19.16.3. By Application

        19.16.4. By Deployment

        19.16.5. By Power Rating

    19.17. Australia and New Zealand

        19.17.1. By Component

        19.17.2. By Technology

        19.17.3. By Application

        19.17.4. By Deployment

        19.17.5. By Power Rating

    19.18. GCC Countries

        19.18.1. By Component

        19.18.2. By Technology

        19.18.3. By Application

        19.18.4. By Deployment

        19.18.5. By Power Rating

    19.19. Turkey

        19.19.1. By Component

        19.19.2. By Technology

        19.19.3. By Application

        19.19.4. By Deployment

        19.19.5. By Power Rating

    19.20. South Africa

        19.20.1. By Component

        19.20.2. By Technology

        19.20.3. By Application

        19.20.4. By Deployment

        19.20.5. By Power Rating

20. Market Structure Analysis

    20.1. Market Analysis by Tier of Companies

    20.2. Market Concentration

    20.3. Market Share Analysis of Top Players

    20.4. Market Presence Analysis

21. Competition Analysis

    21.1. Competition Dashboard

    21.2. Key Strategies, By Competitors

    21.3. Competition Deep Dive

        21.3.1. ccABB

            21.3.1.1. Business Overview

            21.3.1.2. Product & Services Portfolio

            21.3.1.3. Profitability by Market Segments (Business Segments/Region)

            21.3.1.4. Sales Footprint

            21.3.1.5. Strategy Overview

        21.3.2. Siemens AG

            21.3.2.1. Business Overview

            21.3.2.2. Product & Services Portfolio

            21.3.2.3. Profitability by Market Segments (Business Segments/Region)

            21.3.2.4. Sales Footprint

            21.3.2.5. Strategy Overview

        21.3.3. Toshiba Corporation

            21.3.3.1. Business Overview

            21.3.3.2. Product & Services Portfolio

            21.3.3.3. Profitability by Market Segments (Business Segments/Region)

            21.3.3.4. Sales Footprint

            21.3.3.5. Strategy Overview

        21.3.4. General Electric

            21.3.4.1. Business Overview

            21.3.4.2. Product & Services Portfolio

            21.3.4.3. Profitability by Market Segments (Business Segments/Region)

            21.3.4.4. Sales Footprint

            21.3.4.5. Strategy Overview

        21.3.5. Mitsubishi Electric Corporation

            21.3.5.1. Business Overview

            21.3.5.2. Product & Services Portfolio

            21.3.5.3. Profitability by Market Segments (Business Segments/Region)

            21.3.5.4. Sales Footprint

            21.3.5.5. Strategy Overview

        21.3.6. Prysmian SpA

            21.3.6.1. Business Overview

            21.3.6.2. Product & Services Portfolio

            21.3.6.3. Profitability by Market Segments (Business Segments/Region)

            21.3.6.4. Sales Footprint

            21.3.6.5. Strategy Overview

        21.3.7. TransGrid Solutions Inc.

            21.3.7.1. Business Overview

            21.3.7.2. Product & Services Portfolio

            21.3.7.3. Profitability by Market Segments (Business Segments/Region)

            21.3.7.4. Sales Footprint

            21.3.7.5. Strategy Overview

        21.3.8. Abengoa S.A.

            21.3.8.1. Business Overview

            21.3.8.2. Product & Services Portfolio

            21.3.8.3. Profitability by Market Segments (Business Segments/Region)

            21.3.8.4. Sales Footprint

            21.3.8.5. Strategy Overview

        21.3.9. ATCO Ltd.

            21.3.9.1. Business Overview

            21.3.9.2. Product & Services Portfolio

            21.3.9.3. Profitability by Market Segments (Business Segments/Region)

            21.3.9.4. Sales Footprint

            21.3.9.5. Strategy Overview

        21.3.10. LS Industrial Systems Co., Ltd.

            21.3.10.1. Business Overview

            21.3.10.2. Product & Services Portfolio

            21.3.10.3. Profitability by Market Segments (Business Segments/Region)

            21.3.10.4. Sales Footprint

            21.3.10.5. Strategy Overview

        21.3.11. Nexans

            21.3.11.1. Business Overview

            21.3.11.2. Product & Services Portfolio

            21.3.11.3. Profitability by Market Segments (Business Segments/Region)

            21.3.11.4. Sales Footprint

            21.3.11.5. Strategy Overview

        21.3.12. Hitachi Energy Ltd.

            21.3.12.1. Business Overview

            21.3.12.2. Product & Services Portfolio

            21.3.12.3. Profitability by Market Segments (Business Segments/Region)

            21.3.12.4. Sales Footprint

            21.3.12.5. Strategy Overview

        21.3.13. NKT

            21.3.13.1. Business Overview

            21.3.13.2. Product & Services Portfolio

            21.3.13.3. Profitability by Market Segments (Business Segments/Region)

            21.3.13.4. Sales Footprint

            21.3.13.5. Strategy Overview

        21.3.14. NR Electric Co., Ltd.

            21.3.14.1. Business Overview

            21.3.14.2. Product & Services Portfolio

            21.3.14.3. Profitability by Market Segments (Business Segments/Region)

            21.3.14.4. Sales Footprint

            21.3.14.5. Strategy Overview

      Note: The list of companies is not exhaustive in nature and is subject to further refinement and augmentation during the course of research

22. Assumptions and Acronyms Used

23. Research Methodology
Customize this Report

Let us know your requirement to get
100% FREE customization

List of Tables

Table 01: Global Market Value (US$ million) Analysis (2017 to 2021) by Solution

Table 02: Global Market Value (US$ million) Forecast (2022 to 2032) by Solution

Table 03: Global Market Value (US$ million) Analysis (2017 to 2021) by Technology

Table 04: Global Market Value (US$ million) Forecast (2022 to 2032) by Technology

Table 05: Global Market Value (US$ million) Analysis (2017 to 2021) by Application

Table 06: Global Market Value (US$ million) Forecast (2022 to 2032) by Application

Table 07: Global Market Value (US$ million) Analysis (2017 to 2021) by Deployment

Table 08: Global Market Value (US$ million) Forecast (2022 to 2032) by Deployment

Table 09: Global Market Value (US$ million) Analysis (2017 to 2021) by Power Rating

Table 10: Global Market Value (US$ million) Forecast (2022 to 2032) by Power Rating

Table 11: Global Market Value (US$ million) Analysis (2017 to 2021) by Region

Table 12: Global Market Value (US$ million) Forecast (2022 to 2032) by Region

Table 13: North America Market Value (US$ million) Analysis (2017 to 2021) by Solution

Table 14: North America Market Value (US$ million) Forecast (2022 to 2032) by Solution

Table 15: North America Market Value (US$ million) Analysis (2017 to 2021) by Technology

Table 16: North America Market Value (US$ million) Forecast (2022 to 2032) by Technology

Table 17: North America Market Value (US$ million) Analysis (2017 to 2021) by Application

Table 18: North America Market Value (US$ million) Forecast (2022 to 2032) by Application

Table 19: North America Market Value (US$ million) Analysis (2017 to 2021) by Deployment

Table 20: North America Market Value (US$ million) Forecast (2022 to 2032) by Deployment

Table 21: North America Market Value (US$ million) Analysis (2017 to 2021) by Power Rating

Table 22: North America Market Value (US$ million) Forecast (2022 to 2032) by Power Rating

Table 23: North America Market Value (US$ million) Analysis (2017 to 2021) by Country

Table 24: North America Market Value (US$ million) Forecast (2022 to 2032) by Country

Table 25: Latin America Market Value (US$ million) Analysis (2017 to 2021) by Solution

Table 26: Latin America Market Value (US$ million) Forecast (2022 to 2032) by Solution

Table 27: Latin America Market Value (US$ million) Analysis (2017 to 2021) by Technology

Table 28: Latin America Market Value (US$ million) Forecast (2022 to 2032) by Technology

Table 29: Latin America Market Value (US$ million) Analysis (2017 to 2021) by Application

Table 30: Latin America Market Value (US$ million) Forecast (2022 to 2032) by Application

Table 31: Latin America Market Value (US$ million) Analysis (2017 to 2021) by Deployment

Table 32: Latin America Market Value (US$ million) Forecast (2022 to 2032) by Deployment

Table 33: Latin America Market Value (US$ million) Analysis (2017 to 2021) by Power Rating

Table 34: Latin America Market Value (US$ million) Forecast (2022 to 2032) by Power Rating

Table 35: Latin America Market Value (US$ million) Analysis (2017 to 2021) by Country

Table 36: Latin America Market Value (US$ million) Forecast (2022 to 2032) by Country

Table 37: Europe Market Value (US$ million) Analysis (2017 to 2021) by Solution

Table 38: Europe Market Value (US$ million) Forecast (2022 to 2032) by Solution

Table 39: Europe Market Value (US$ million) Analysis (2017 to 2021) by Technology

Table 40: Europe Market Value (US$ million) Forecast (2022 to 2032) by Technology

Table 41: Europe Market Value (US$ million) Analysis (2017 to 2021) by Application

Table 42: Europe Market Value (US$ million) Forecast (2022 to 2032) by Application

Table 43: Europe Market Value (US$ million) Analysis (2017 to 2021) by Deployment

Table 44: Europe Market Value (US$ million) Forecast (2022 to 2032) by Deployment

Table 45: Europe Market Value (US$ million) Analysis (2017 to 2021) by Power Rating

Table 46: Europe Market Value (US$ million) Forecast (2022 to 2032) by Power Rating

Table 47: Europe Market Value (US$ million) Analysis (2017 to 2021) by Country

Table 48: Europe Market Value (US$ million) Forecast (2022 to 2032) by Country

Table 49: East Asia Market Value (US$ million) Analysis (2017 to 2021) by Solution

Table 50: East Asia Market Value (US$ million) Forecast (2022 to 2032) by Solution

Table 51: East Asia Market Value (US$ million) Analysis (2017 to 2021) by Technology

Table 52: East Asia Market Value (US$ million) Forecast (2022 to 2032) by Technology

Table 53: East Asia Market Value (US$ million) Analysis (2017 to 2021) by Application

Table 54: East Asia Market Value (US$ million) Forecast (2022 to 2032) by Application

Table 55: East Asia Market Value (US$ million) Analysis (2017 to 2021) by Deployment

Table 56: East Asia Market Value (US$ million) Forecast (2022 to 2032) by Deployment

Table 57: East Asia Market Value (US$ million) Analysis (2017 to 2021) by Power Rating

Table 58: East Asia Market Value (US$ million) Forecast (2022 to 2032) by Power Rating

Table 59: East Asia Market Value (US$ million) Analysis (2017 to 2021) by Country

Table 60: East Asia Market Value (US$ million) Forecast (2022 to 2032) by Country

Table 61: South Asia & Pacific Market Value (US$ million) Analysis (2017 to 2021) by Solution

Table 62: South Asia & Pacific Market Value (US$ million) Forecast (2022 to 2032) by Solution

Table 63: South Asia & Pacific Market Value (US$ million) Analysis (2017 to 2021) by Technology

Table 64: South Asia & Pacific Market Value (US$ million) Forecast (2022 to 2032) by Technology

Table 65: South Asia & Pacific Market Value (US$ million) Analysis (2017 to 2021) by Application

Table 66: South Asia & Pacific Market Value (US$ million) Forecast (2022 to 2032) by Application

Table 67: South Asia & Pacific Market Value (US$ million) Analysis (2017 to 2021) by Deployment

Table 68: South Asia & Pacific Market Value (US$ million) Forecast (2022 to 2032) by Deployment

Table 69: South Asia & Pacific Market Value (US$ million) Analysis (2017 to 2021) by Power Rating

Table 70: South Asia & Pacific Market Value (US$ million) Forecast (2022 to 2032) by Power Rating

Table 71: South Asia & Pacific Market Value (US$ million) Analysis (2017 to 2021) by Country

Table 72: South Asia & Pacific Market Value (US$ million) Forecast (2022 to 2032) by Country

Table 73: Middle East and Africa Market Value (US$ million) Analysis (2017 to 2021) by Solution

Table 74: Middle East and Africa Market Value (US$ million) Forecast (2022 to 2032) by Solution

Table 75: Middle East and Africa Market Value (US$ million) Analysis (2017 to 2021) by Technology

Table 76: Middle East and Africa Market Value (US$ million) Forecast (2022 to 2032) by Technology

Table 77: Middle East and Africa Market Value (US$ million) Analysis (2017 to 2021) by Application

Table 78: Middle East and Africa Market Value (US$ million) Forecast (2022 to 2032) by Application

Table 79: Middle East and Africa Market Value (US$ million) Analysis (2017 to 2021) by Deployment

Table 80: Middle East and Africa Market Value (US$ million) Forecast (2022 to 2032) by Deployment

Table 81: Middle East and Africa Market Value (US$ million) Analysis (2017 to 2021) by Power Rating

Table 82: Middle East and Africa Market Value (US$ million) Forecast (2022 to 2032) by Power Rating

Table 83: Middle East and Africa Market Value (US$ million) Analysis (2017 to 2021) by Country

Table 84: Middle East and Africa Market Value (US$ million) Forecast (2022 to 2032) by Country

Table 85: The USA Market Value (US$ million) Analysis (2017 to 2021) by Solution

Table 86: The USA Market Value (US$ million) Forecast (2022 to 2032) by Solution

Table 87: The USA Market Value (US$ million) Analysis (2017 to 2021) by Technology

Table 88: The USA Market Value (US$ million) Forecast (2022 to 2032) by Technology

Table 89: The USA Market Value (US$ million) Analysis (2017 to 2021) by Application

Table 90: The USA Market Value (US$ million) Forecast (2022 to 2032) by Application

Table 91: The USA Market Value (US$ million) Analysis (2017 to 2021) by Deployment

Table 92: The USA Market Value (US$ million) Forecast (2022 to 2032) by Deployment

Table 93: The USA Market Value (US$ million) Analysis (2017 to 2021) by Power Rating

Table 94: The USA Market Value (US$ million) Forecast (2022 to 2032) by Power Rating

Table 95: Canada Market Value (US$ million) Analysis (2017 to 2021) by Solution

Table 96: Canada Market Value (US$ million) Forecast (2022 to 2032) by Solution

Table 97: Canada Market Value (US$ million) Analysis (2017 to 2021) by Technology

Table 98: Canada Market Value (US$ million) Forecast (2022 to 2032) by Technology

Table 99: Canada Market Value (US$ million) Analysis (2017 to 2021) by Application

Table 100: Canada Market Value (US$ million) Forecast (2022 to 2032) by Application

Table 101: Canada Market Value (US$ million) Analysis (2017 to 2021) by Deployment

Table 102: Canada Market Value (US$ million) Forecast (2022 to 2032) by Deployment

Table 103: Canada Market Value (US$ million) Analysis (2017 to 2021) by Power Rating

Table 104: Canada Market Value (US$ million) Forecast (2022 to 2032) by Power Rating

Table 105: Brazil Market Value (US$ million) Analysis (2017 to 2021) by Solution

Table 106: Brazil Market Value (US$ million) Forecast (2022 to 2032) by Solution

Table 107: Brazil Market Value (US$ million) Analysis (2017 to 2021) by Technology

Table 108: Brazil Market Value (US$ million) Forecast (2022 to 2032) by Technology

Table 109: Brazil Market Value (US$ million) Analysis (2017 to 2021) by Application

Table 110: Brazil Market Value (US$ million) Forecast (2022 to 2032) by Application

Table 111: Brazil Market Value (US$ million) Analysis (2017 to 2021) by Deployment

Table 112: Brazil Market Value (US$ million) Forecast (2022 to 2032) by Deployment

Table 113: Brazil Market Value (US$ million) Analysis (2017 to 2021) by Power Rating

Table 114: Brazil Market Value (US$ million) Forecast (2022 to 2032) by Power Rating

Table 115: Mexico Market Value (US$ million) Analysis (2017 to 2021) by Solution

Table 116: Mexico Market Value (US$ million) Forecast (2022 to 2032) by Solution

Table 117: Mexico Market Value (US$ million) Analysis (2017 to 2021) by Technology

Table 118: Mexico Market Value (US$ million) Forecast (2022 to 2032) by Technology

Table 119: Mexico Market Value (US$ million) Analysis (2017 to 2021) by Application

Table 120: Mexico Market Value (US$ million) Forecast (2022 to 2032) by Application

Table 121: Mexico Market Value (US$ million) Analysis (2017 to 2021) by Deployment

Table 122: Mexico Market Value (US$ million) Forecast (2022 to 2032) by Deployment

Table 123: Mexico Market Value (US$ million) Analysis (2017 to 2021) by Power Rating

Table 124: Mexico Market Value (US$ million) Forecast (2022 to 2032) by Power Rating

Table 125: Rest of Latin America Market Value (US$ million) Analysis (2017 to 2021) by Solution

Table 126: Rest of Latin America Market Value (US$ million) Forecast (2022 to 2032) by Solution

Table 127: Rest of Latin America Market Value (US$ million) Analysis (2017 to 2021) by Technology

Table 128: Rest of Latin America Market Value (US$ million) Forecast (2022 to 2032) by Technology

Table 129: Rest of Latin America Market Value (US$ million) Analysis (2017 to 2021) by Application

Table 130: Rest of Latin America Market Value (US$ million) Forecast (2022 to 2032) by Application

Table 131: Rest of Latin America Market Value (US$ million) Analysis (2017 to 2021) by Deployment

Table 132: Rest of Latin America Market Value (US$ million) Forecast (2022 to 2032) by Deployment

Table 133: Rest of Latin America Market Value (US$ million) Analysis (2017 to 2021) by Power Rating

Table 134: Rest of Latin America Market Value (US$ million) Forecast (2022 to 2032) by Power Rating

Table 135: The United Kingdom Market Value (US$ million) Analysis (2017 to 2021) by Solution

Table 136: The United Kingdom Market Value (US$ million) Forecast (2022 to 2032) by Solution

Table 137: The United Kingdom Market Value (US$ million) Analysis (2017 to 2021) by Technology

Table 138: The United Kingdom Market Value (US$ million) Forecast (2022 to 2032) by Technology

Table 139: The United Kingdom Market Value (US$ million) Analysis (2017 to 2021) by Application

Table 140: The United Kingdom Market Value (US$ million) Forecast (2022 to 2032) by Application

Table 141: The United Kingdom Market Value (US$ million) Analysis (2017 to 2021) by Deployment

Table 142: The United Kingdom Market Value (US$ million) Forecast (2022 to 2032) by Deployment

Table 143: The United Kingdom Market Value (US$ million) Analysis (2017 to 2021) by Power Rating

Table 144: The United Kingdom Market Value (US$ million) Forecast (2022 to 2032) by Power Rating

Table 145: Germany Market Value (US$ million) Analysis (2017 to 2021) by Solution

Table 146: Germany Market Value (US$ million) Forecast (2022 to 2032) by Solution

Table 147: Germany Market Value (US$ million) Analysis (2017 to 2021) by Technology

Table 148: Germany Market Value (US$ million) Forecast (2022 to 2032) by Technology

Table 149: Germany Market Value (US$ million) Analysis (2017 to 2021) by Application

Table 150: Germany Market Value (US$ million) Forecast (2022 to 2032) by Application

Table 151: Germany Market Value (US$ million) Analysis (2017 to 2021) by Deployment

Table 152: Germany Market Value (US$ million) Forecast (2022 to 2032) by Deployment

Table 153: Germany Market Value (US$ million) Analysis (2017 to 2021) by Power Rating

Table 154: Germany Market Value (US$ million) Forecast (2022 to 2032) by Power Rating

Table 155: France Market Value (US$ million) Analysis (2017 to 2021) by Solution

Table 156: France Market Value (US$ million) Forecast (2022 to 2032) by Solution

Table 157: France Market Value (US$ million) Analysis (2017 to 2021) by Technology

Table 158: France Market Value (US$ million) Forecast (2022 to 2032) by Technology

Table 159: France Market Value (US$ million) Analysis (2017 to 2021) by Application

Table 160: France Market Value (US$ million) Forecast (2022 to 2032) by Application

Table 161: France Market Value (US$ million) Analysis (2017 to 2021) by Deployment

Table 162: France Market Value (US$ million) Forecast (2022 to 2032) by Deployment

Table 163: France Market Value (US$ million) Analysis (2017 to 2021) by Power Rating

Table 164: France Market Value (US$ million) Forecast (2022 to 2032) by Power Rating

Table 165: Italy Market Value (US$ million) Analysis (2017 to 2021) by Solution

Table 166: Italy Market Value (US$ million) Forecast (2022 to 2032) by Solution

Table 167: Italy Market Value (US$ million) Analysis (2017 to 2021) by Technology

Table 168: Italy Market Value (US$ million) Forecast (2022 to 2032) by Technology

Table 169: Italy Market Value (US$ million) Analysis (2017 to 2021) by Application

Table 170: Italy Market Value (US$ million) Forecast (2022 to 2032) by Application

Table 171: Italy Market Value (US$ million) Analysis (2017 to 2021) by Deployment

Table 172: Italy Market Value (US$ million) Forecast (2022 to 2032) by Deployment

Table 173: Italy Market Value (US$ million) Analysis (2017 to 2021) by Power Rating

Table 174: Italy Market Value (US$ million) Forecast (2022 to 2032) by Power Rating

Table 175: Spain Market Value (US$ million) Analysis (2017 to 2021) by Solution

Table 176: Spain Market Value (US$ million) Forecast (2022 to 2032) by Solution

Table 177: Spain Market Value (US$ million) Analysis (2017 to 2021) by Technology

Table 178: Spain Market Value (US$ million) Forecast (2022 to 2032) by Technology

Table 179: Spain Market Value (US$ million) Analysis (2017 to 2021) by Application

Table 180: Spain Market Value (US$ million) Forecast (2022 to 2032) by Application

Table 181: Spain Market Value (US$ million) Analysis (2017 to 2021) by Deployment

Table 182: Spain Market Value (US$ million) Forecast (2022 to 2032) by Deployment

Table 183: Spain Market Value (US$ million) Analysis (2017 to 2021) by Power Rating

Table 184: Spain Market Value (US$ million) Forecast (2022 to 2032) by Power Rating

Table 185: Benelux Market Value (US$ million) Analysis (2017 to 2021) by Solution

Table 186: Benelux Market Value (US$ million) Forecast (2022 to 2032) by Solution

Table 187: Benelux Market Value (US$ million) Analysis (2017 to 2021) by Technology

Table 188: Benelux Market Value (US$ million) Forecast (2022 to 2032) by Technology

Table 189: Benelux Market Value (US$ million) Analysis (2017 to 2021) by Application

Table 190: Benelux Market Value (US$ million) Forecast (2022 to 2032) by Application

Table 191: Benelux Market Value (US$ million) Analysis (2017 to 2021) by Deployment

Table 192: Benelux Market Value (US$ million) Forecast (2022 to 2032) by Deployment

Table 193: Benelux Market Value (US$ million) Analysis (2017 to 2021) by Power Rating

Table 194: Benelux Market Value (US$ million) Forecast (2022 to 2032) by Power Rating

Table 195: Russia Market Value (US$ million) Analysis (2017 to 2021) by Solution

Table 196: Russia Market Value (US$ million) Forecast (2022 to 2032) by Solution

Table 197: Russia Market Value (US$ million) Analysis (2017 to 2021) by Technology

Table 198: Russia Market Value (US$ million) Forecast (2022 to 2032) by Technology

Table 199: Russia Market Value (US$ million) Analysis (2017 to 2021) by Application

Table 200: Russia Market Value (US$ million) Forecast (2022 to 2032) by Application

Table 201: Russia Market Value (US$ million) Analysis (2017 to 2021) by Deployment

Table 202: Russia Market Value (US$ million) Forecast (2022 to 2032) by Deployment

Table 203: Russia Market Value (US$ million) Analysis (2017 to 2021) by Power Rating

Table 204: Russia Market Value (US$ million) Forecast (2022 to 2032) by Power Rating

Table 205: Rest of Europe Market Value (US$ million) Analysis (2017 to 2021) by Solution

Table 206: Rest of Europe Market Value (US$ million) Forecast (2022 to 2032) by Solution

Table 207: Rest of Europe Market Value (US$ million) Analysis (2017 to 2021) by Technology

Table 208: Rest of Europe Market Value (US$ million) Forecast (2022 to 2032) by Technology

Table 209: Rest of Europe Market Value (US$ million) Analysis (2017 to 2021) by Application

Table 210: Rest of Europe Market Value (US$ million) Forecast (2022 to 2032) by Application

Table 211: Rest of Europe Market Value (US$ million) Analysis (2017 to 2021) by Deployment

Table 212: Rest of Europe Market Value (US$ million) Forecast (2022 to 2032) by Deployment

Table 213: Rest of Europe Market Value (US$ million) Analysis (2017 to 2021) by Power Rating

Table 214: Rest of Europe Market Value (US$ million) Forecast (2022 to 2032) by Power Rating

Table 215: China Market Value (US$ million) Analysis (2017 to 2021) by Solution

Table 216: China Market Value (US$ million) Forecast (2022 to 2032) by Solution

Table 217: China Market Value (US$ million) Analysis (2017 to 2021) by Technology

Table 218: China Market Value (US$ million) Forecast (2022 to 2032) by Technology

Table 219: China Market Value (US$ million) Analysis (2017 to 2021) by Application

Table 220: China Market Value (US$ million) Forecast (2022 to 2032) by Application

Table 221: China Market Value (US$ million) Analysis (2017 to 2021) by Deployment

Table 222: China Market Value (US$ million) Forecast (2022 to 2032) by Deployment

Table 223: China Market Value (US$ million) Analysis (2017 to 2021) by Power Rating

Table 224: China Market Value (US$ million) Forecast (2022 to 2032) by Power Rating

Table 225: Japan Market Value (US$ million) Analysis (2017 to 2021) by Solution

Table 226: Japan Market Value (US$ million) Forecast (2022 to 2032) by Solution

Table 227: Japan Market Value (US$ million) Analysis (2017 to 2021) by Technology

Table 228: Japan Market Value (US$ million) Forecast (2022 to 2032) by Technology

Table 229: Japan Market Value (US$ million) Analysis (2017 to 2021) by Application

Table 230: Japan Market Value (US$ million) Forecast (2022 to 2032) by Application

Table 231: Japan Market Value (US$ million) Analysis (2017 to 2021) by Deployment

Table 232: Japan Market Value (US$ million) Forecast (2022 to 2032) by Deployment

Table 233: Japan Market Value (US$ million) Analysis (2017 to 2021) by Power Rating

Table 234: Japan Market Value (US$ million) Forecast (2022 to 2032) by Power Rating

Table 235: South Korea Market Value (US$ million) Analysis (2017 to 2021) by Solution

Table 236: South Korea Market Value (US$ million) Forecast (2022 to 2032) by Solution

Table 237: South Korea Market Value (US$ million) Analysis (2017 to 2021) by Technology

Table 238: South Korea Market Value (US$ million) Forecast (2022 to 2032) by Technology

Table 239: South Korea Market Value (US$ million) Analysis (2017 to 2021) by Application

Table 240: South Korea Market Value (US$ million) Forecast (2022 to 2032) by Application

Table 241: South Korea Market Value (US$ million) Analysis (2017 to 2021) by Deployment

Table 242: South Korea Market Value (US$ million) Forecast (2022 to 2032) by Deployment

Table 243: South Korea Market Value (US$ million) Analysis (2017 to 2021) by Power Rating

Table 244: South Korea Market Value (US$ million) Forecast (2022 to 2032) by Power Rating

Table 245: India Market Value (US$ million) Analysis (2017 to 2021) by Solution

Table 246: India Market Value (US$ million) Forecast (2022 to 2032) by Solution

Table 247: India Market Value (US$ million) Analysis (2017 to 2021) by Technology

Table 248: India Market Value (US$ million) Forecast (2022 to 2032) by Technology

Table 249: India Market Value (US$ million) Analysis (2017 to 2021) by Application

Table 250: India Market Value (US$ million) Forecast (2022 to 2032) by Application

Table 251: India Market Value (US$ million) Analysis (2017 to 2021) by Deployment

Table 252: India Market Value (US$ million) Forecast (2022 to 2032) by Deployment

Table 253: India Market Value (US$ million) Analysis (2017 to 2021) by Power Rating

Table 254: India Market Value (US$ million) Forecast (2022 to 2032) by Power Rating

Table 255: Malaysia Market Value (US$ million) Analysis (2017 to 2021) by Solution

Table 256: Malaysia Market Value (US$ million) Forecast (2022 to 2032) by Solution

Table 257: Malaysia Market Value (US$ million) Analysis (2017 to 2021) by Technology

Table 258: Malaysia Market Value (US$ million) Forecast (2022 to 2032) by Technology

Table 259: Malaysia Market Value (US$ million) Analysis (2017 to 2021) by Application

Table 260: Malaysia Market Value (US$ million) Forecast (2022 to 2032) by Application

Table 261: Malaysia Market Value (US$ million) Analysis (2017 to 2021) by Deployment

Table 262: Malaysia Market Value (US$ million) Forecast (2022 to 2032) by Deployment

Table 263: Malaysia Market Value (US$ million) Analysis (2017 to 2021) by Power Rating

Table 264: Malaysia Market Value (US$ million) Forecast (2022 to 2032) by Power Rating

Table 265: Indonesia Market Value (US$ million) Analysis (2017 to 2021) by Solution

Table 266: Indonesia Market Value (US$ million) Forecast (2022 to 2032) by Solution

Table 267: Indonesia Market Value (US$ million) Analysis (2017 to 2021) by Technology

Table 268: Indonesia Market Value (US$ million) Forecast (2022 to 2032) by Technology

Table 269: Indonesia Market Value (US$ million) Analysis (2017 to 2021) by Application

Table 270: Indonesia Market Value (US$ million) Forecast (2022 to 2032) by Application

Table 271: Indonesia Market Value (US$ million) Analysis (2017 to 2021) by Deployment

Table 272: Indonesia Market Value (US$ million) Forecast (2022 to 2032) by Deployment

Table 273: Indonesia Market Value (US$ million) Analysis (2017 to 2021) by Power Rating

Table 274: Indonesia Market Value (US$ million) Forecast (2022 to 2032) by Power Rating

Table 275: Thailand Market Value (US$ million) Analysis (2017 to 2021) by Solution

Table 276: Thailand Market Value (US$ million) Forecast (2022 to 2032) by Solution

Table 277: Thailand Market Value (US$ million) Analysis (2017 to 2021) by Technology

Table 278: Thailand Market Value (US$ million) Forecast (2022 to 2032) by Technology

Table 279: Thailand Market Value (US$ million) Analysis (2017 to 2021) by Application

Table 280: Thailand Market Value (US$ million) Forecast (2022 to 2032) by Application

Table 281: Thailand Market Value (US$ million) Analysis (2017 to 2021) by Deployment

Table 282: Thailand Market Value (US$ million) Forecast (2022 to 2032) by Deployment

Table 283: Thailand Market Value (US$ million) Analysis (2017 to 2021) by Power Rating

Table 284: Thailand Market Value (US$ million) Forecast (2022 to 2032) by Power Rating

Table 285: Australia & New Zealand Market Value (US$ million) Analysis (2017 to 2021) by Solution

Table 286: Australia & New Zealand Market Value (US$ million) Forecast (2022 to 2032) by Solution

Table 287: Australia & New Zealand Market Value (US$ million) Analysis (2017 to 2021) by Technology

Table 288: Australia & New Zealand Market Value (US$ million) Forecast (2022 to 2032) by Technology

Table 289: Australia & New Zealand Market Value (US$ million) Analysis (2017 to 2021) by Application

Table 290: Australia & New Zealand Market Value (US$ million) Forecast (2022 to 2032) by Application

Table 291: Australia & New Zealand Market Value (US$ million) Analysis (2017 to 2021) by Deployment

Table 292: Australia & New Zealand Market Value (US$ million) Forecast (2022 to 2032) by Deployment

Table 293: Australia & New Zealand Market Value (US$ million) Analysis (2017 to 2021) by Power Rating

Table 294: Australia & New Zealand Market Value (US$ million) Forecast (2022 to 2032) by Power Rating

Table 295: Rest of South Asia & Pacific Market Value (US$ million) Analysis (2017 to 2021) by Solution

Table 296: Rest of South Asia & Pacific Market Value (US$ million) Forecast (2022 to 2032) by Solution

Table 297: Rest of South Asia & Pacific Market Value (US$ million) Analysis (2017 to 2021) by Technology

Table 298: Rest of South Asia & Pacific Market Value (US$ million) Forecast (2022 to 2032) by Technology

Table 299: Rest of South Asia & Pacific Market Value (US$ million) Analysis (2017 to 2021) by Application

Table 300: Rest of South Asia & Pacific Market Value (US$ million) Forecast (2022 to 2032) by Application

Table 301: Rest of South Asia & Pacific Market Value (US$ million) Analysis (2017 to 2021) by Deployment

Table 302: Rest of South Asia & Pacific Market Value (US$ million) Forecast (2022 to 2032) by Deployment

Table 303: Rest of South Asia & Pacific Market Value (US$ million) Analysis (2017 to 2021) by Power Rating

Table 304: Rest of South Asia & Pacific Market Value (US$ million) Forecast (2022 to 2032) by Power Rating

Table 305: GCC Countries Market Value (US$ million) Analysis (2017 to 2021) by Solution

Table 306: GCC Countries Market Value (US$ million) Forecast (2022 to 2032) by Solution

Table 307: GCC Countries Market Value (US$ million) Analysis (2017 to 2021) by Technology

Table 308: GCC Countries Market Value (US$ million) Forecast (2022 to 2032) by Technology

Table 309: GCC Countries Market Value (US$ million) Analysis (2017 to 2021) by Application

Table 310: GCC Countries Market Value (US$ million) Forecast (2022 to 2032) by Application

Table 311: GCC Countries Market Value (US$ million) Analysis (2017 to 2021) by Deployment

Table 312: GCC Countries Market Value (US$ million) Forecast (2022 to 2032) by Deployment

Table 313: GCC Countries Market Value (US$ million) Analysis (2017 to 2021) by Power Rating

Table 314: GCC Countries Market Value (US$ million) Forecast (2022 to 2032) by Power Rating

Table 315: Turkey Market Value (US$ million) Analysis (2017 to 2021) by Solution

Table 316: Turkey Market Value (US$ million) Forecast (2022 to 2032) by Solution

Table 317: Turkey Market Value (US$ million) Analysis (2017 to 2021) by Technology

Table 318: Turkey Market Value (US$ million) Forecast (2022 to 2032) by Technology

Table 319: Turkey Market Value (US$ million) Analysis (2017 to 2021) by Application

Table 320: Turkey Market Value (US$ million) Forecast (2022 to 2032) by Application

Table 321: Turkey Market Value (US$ million) Analysis (2017 to 2021) by Deployment

Table 322: Turkey Market Value (US$ million) Forecast (2022 to 2032) by Deployment

Table 323: Turkey Market Value (US$ million) Analysis (2017 to 2021) by Power Rating

Table 324: Turkey Market Value (US$ million) Forecast (2022 to 2032) by Power Rating

Table 325: South Africa Market Value (US$ million) Analysis (2017 to 2021) by Solution

Table 326: South Africa Market Value (US$ million) Forecast (2022 to 2032) by Solution

Table 327: South Africa Market Value (US$ million) Analysis (2017 to 2021) by Technology

Table 328: South Africa Market Value (US$ million) Forecast (2022 to 2032) by Technology

Table 329: South Africa Market Value (US$ million) Analysis (2017 to 2021) by Application

Table 330: South Africa Market Value (US$ million) Forecast (2022 to 2032) by Application

Table 331: South Africa Market Value (US$ million) Analysis (2017 to 2021) by Deployment

Table 332: South Africa Market Value (US$ million) Forecast (2022 to 2032) by Deployment

Table 333: South Africa Market Value (US$ million) Analysis (2017 to 2021) by Power Rating

Table 334: South Africa Market Value (US$ million) Forecast (2022 to 2032) by Power Rating

Table 335: North Africa Market Value (US$ million) Analysis (2017 to 2021) by Solution

Table 336: North Africa Market Value (US$ million) Forecast (2022 to 2032) by Solution

Table 337: North Africa Market Value (US$ million) Analysis (2017 to 2021) by Technology

Table 338: North Africa Market Value (US$ million) Forecast (2022 to 2032) by Technology

Table 339: North Africa Market Value (US$ million) Analysis (2017 to 2021) by Application

Table 340: North Africa Market Value (US$ million) Forecast (2022 to 2032) by Application

Table 341: North Africa Market Value (US$ million) Analysis (2017 to 2021) by Deployment

Table 342: North Africa Market Value (US$ million) Forecast (2022 to 2032) by Deployment

Table 343: North Africa Market Value (US$ million) Analysis (2017 to 2021) by Power Rating

Table 344: North Africa Market Value (US$ million) Forecast (2022 to 2032) by Power Rating

Table 345: Rest of Middle East & Africa Market Value (US$ million) Forecast (2017 to 2021) by Solution

Table 346: Rest of Middle East & Africa Market Value (US$ million) Forecast (2022 to 2032) by Solution

Table 347: Rest of Middle East & Africa Market Value (US$ million) Forecast (2017 to 2021) by Technology

Table 348: Rest of Middle East & Africa Market Value (US$ million) Forecast (2022 to 2032) by Technology

Table 349: Rest of Middle East & Africa Market Value (US$ million) Forecast (2017 to 2021) by Application

Table 350: Rest of Middle East & Africa Market Value (US$ million) Forecast (2022 to 2032) by Application

Table 351: Rest of Middle East & Africa Market Value (US$ million) Forecast (2017 to 2021) by Deployment

Table 352: Rest of Middle East & Africa Market Value (US$ million) Forecast (2022 to 2032) by Deployment

Table 353: Rest of Middle East & Africa Market Value (US$ million) Forecast (2017 to 2021) by Power Rating

Table 354: Rest of Middle East & Africa Market Value (US$ million) Forecast (2022 to 2032) by Power Rating
Sudip Saha
Principal Consultant
LinkedIn
Talk to Analyst

Find your sweet spots for generating winning opportunities in this market.

Talk to Analyst

List of Charts

Figure 01: Global Market Size (US$ million) and Y-o-Y Growth Rate from 2021 to 2032

Figure 02: Global Market Absolute $ Opportunity from 2022 to 2032

Figure 03: Global Market Value (US$ million), 2017 to 2021

Figure 04: Global Market Value (US$ million), 2022 to 2032

Figure 05: Global Market Value Share Analysis (2022 to 2032) by Solution

Figure 06: Global Market Value Y-o-Y Growth Trend Analysis (2021 to 2032) by Solution

Figure 07: Global Market Attractiveness by Solution

Figure 08: Global Market Value Share Analysis (2022 to 2032) by Technology

Figure 09: Global Market Value Y-o-Y Growth Trend Analysis (2021 to 2032) by Technology

Figure 10: Global Market Attractiveness by Technology

Figure 11: Global Market Value Share Analysis (2022 to 2032) by Application

Figure 12: Global Market Value Y-o-Y Growth Trend Analysis (2021 to 2032) by Application

Figure 13: Global Market Attractiveness by Application

Figure 14: Global Market Value Share Analysis (2022 to 2032) by Deployment

Figure 15: Global Market Value Y-o-Y Growth Trend Analysis (2021 to 2032) by Deployment

Figure 16: Global Market Attractiveness by Deployment

Figure 17: Global Market Value Share Analysis (2022 to 2032) by Power Rating

Figure 18: Global Market Value Y-o-Y Growth Trend Analysis (2021 to 2032) by Power Rating

Figure 19: Global Market Attractiveness by Power Rating

Figure 20: Global Market Value Share Analysis (2022 to 2032) by Region

Figure 21: Global Market Value Y-o-Y Growth Trend Analysis (2021 to 2032) by Region

Figure 22: North America Market Absolute $ Opportunity (US$ million), 2017 to 2032

Figure 23: Latin America Market Absolute $ Opportunity (US$ million), 2017 to 2032

Figure 24: Europe Market Absolute $ Opportunity (US$ million), 2017 to 2032

Figure 25: East Asia Market Absolute $ Opportunity (US$ million), 2017 to 2032

Figure 26: South Asia and Pacific Market Absolute $ Opportunity (US$ million), 2017 to 2032

Figure 27: Middle East and Africa Market Absolute $ Opportunity (US$ million), 2017 to 2032

Figure 28: Global Market Attractiveness by Region

Figure 29: North America Market Value (US$ million), 2017 to 2021

Figure 30: North America Market Value (US$ million), 2022 to 2032

Figure 31: North America Market Value Share Analysis (2022 to 2032) by Solution

Figure 32: North America Market Value Y-o-Y Growth Trend Analysis (2021 to 2032) by Solution

Figure 33: North America Market Attractiveness by Solution

Figure 34: North America Market Value Share Analysis (2022 to 2032) by Technology

Figure 35: North America Market Value Y-o-Y Growth Trend Analysis (2021 to 2032) by Technology

Figure 36: North America Market Attractiveness by Technology

Figure 37: North America Market Value Share Analysis (2022 to 2032) by Application

Figure 38: North America Market Value Y-o-Y Growth Trend Analysis (2021 to 2032) by Application

Figure 39: North America Market Attractiveness by Application

Figure 40: North America Market Value Share Analysis (2022 to 2032) by Deployment

Figure 41: North America Market Value Y-o-Y Growth Trend Analysis (2021 to 2032) by Deployment

Figure 42: North America Market Attractiveness by Deployment

Figure 43: North America Market Value Share Analysis (2022 to 2032) by Power Rating

Figure 44: North America Market Value Y-o-Y Growth Trend Analysis (2021 to 2032) by Power Rating

Figure 45: North America Market Attractiveness by Power Rating

Figure 46: North America Market Value Share Analysis (2022 to 2032) by Country

Figure 47: North America Market Value Y-o-Y Growth Trend Analysis (2021 to 2032) by Country

Figure 48: The USA Market Absolute $ Opportunity (US$ Million), 2017 to 2032

Figure 49: Canada Market Absolute $ Opportunity (US$ million), 2017 to 2032

Figure 50: North America Market Attractiveness by Country

Figure 51: Latin America Market Value (US$ million), 2017 to 2021

Figure 52: Latin America Market Value (US$ million), 2022 to 2032

Figure 53: Latin America Market Value Share Analysis (2022 to 2032) by Solution

Figure 54: Latin America Market Value Y-o-Y Growth Trend Analysis (2021 to 2032) by Solution

Figure 55: Latin America Market Attractiveness by Solution

Figure 56: Latin America Market Value Share Analysis (2022 to 2032) by Technology

Figure 57: Latin America Market Value Y-o-Y Growth Trend Analysis (2021 to 2032) by Technology

Figure 58: Latin America Market Attractiveness by Technology

Figure 59: Latin America Market Value Share Analysis (2022 to 2032) by Application

Figure 60: Latin America Market Value Y-o-Y Growth Trend Analysis (2021 to 2032) by Application

Figure 61: Latin America Market Attractiveness by Application

Figure 62: Latin America Market Value Share Analysis (2022 to 2032) by Deployment

Figure 63: Latin America Market Value Y-o-Y Growth Trend Analysis (2021 to 2032) by Deployment

Figure 64: Latin America Market Attractiveness by Deployment

Figure 65: Latin America Market Value Share Analysis (2022 to 2032) by Power Rating

Figure 66: Latin America Market Value Y-o-Y Growth Trend Analysis (2021 to 2032) by Power Rating

Figure 67: Latin America Market Attractiveness by Power Rating

Figure 68: Latin America Market Value Share Analysis (2022 to 2032) by Country

Figure 69: Latin America Market Value Y-o-Y Growth Trend Analysis (2021 to 2032) by Country

Figure 70: Brazil Market Absolute $ Opportunity (US$ million), 2017 to 2032

Figure 71: Mexico Market Absolute $ Opportunity (US$ million), 2017 to 2032

Figure 72: Rest of Latin America Market Absolute $ Opportunity (US$ million), 2017 to 2032

Figure 73: Latin America Market Attractiveness by Country

Figure 74: Europe Market Value (US$ million), 2017 to 2021

Figure 75: Europe Market Value (US$ million), 2022 to 2032

Figure 76: Europe Market Value Share Analysis (2022 to 2032) by Solution

Figure 77: Europe Market Value Y-o-Y Growth Trend Analysis (2021 to 2032) by Solution

Figure 78: Europe Market Attractiveness by Solution

Figure 79: Europe Market Value Share Analysis (2022 to 2032) by Technology

Figure 80: Europe Market Value Y-o-Y Growth Trend Analysis (2021 to 2032) by Technology

Figure 81: Europe Market Attractiveness by Technology

Figure 82: Europe Market Value Share Analysis (2022 to 2032) by Application

Figure 83: Europe Market Value Y-o-Y Growth Trend Analysis (2021 to 2032) by Application

Figure 84: Europe Market Attractiveness by Application

Figure 85: Europe Market Value Share Analysis (2022 to 2032) by Deployment

Figure 86: Europe Market Value Y-o-Y Growth Trend Analysis (2021 to 2032) by Deployment

Figure 87: Europe Market Attractiveness by Deployment

Figure 88: Europe Market Value Share Analysis (2022 to 2032) by Power Rating

Figure 89: Europe Market Value Y-o-Y Growth Trend Analysis (2021 to 2032) by Power Rating

Figure 90: Europe Market Attractiveness by Power Rating

Figure 91: Europe Market Value Share Analysis (2022 to 2032) by Country

Figure 92: Europe Market Value Y-o-Y Growth Trend Analysis (2021 to 2032) by Country

Figure 93: The United Kingdom Market Absolute $ Opportunity (US$ million), 2017 to 2032

Figure 94: Germany Market Absolute $ Opportunity (US$ million), 2017 to 2032

Figure 95: France Market Absolute $ Opportunity (US$ million), 2017 to 2032

Figure 96: Italy Market Absolute $ Opportunity (US$ million), 2017 to 2032

Figure 97: Spain Market Absolute $ Opportunity (US$ million), 2017 to 2032

Figure 98:Benelux Market Absolute $ Opportunity (US$ million), 2017 to 2032

Figure 99: Russia Market Absolute $ Opportunity (US$ million), 2017 to 2032

Figure 100:Rest of Europe Market Absolute $ Opportunity (US$ million), 2017 to 2032

Figure 101: Europe Market Attractiveness by Country

Figure 102: East Asia Market Value (US$ million), 2017 to 2021

Figure 103: East Asia Market Value (US$ million), 2022 to 2032

Figure 104: East Asia Market Value Share Analysis (2022 to 2032) by Solution

Figure 105: East Asia Market Value Y-o-Y Growth Trend Analysis (2021 to 2032) by Solution

Figure 106: East Asia Market Attractiveness by Solution

Figure 107: East Asia Market Value Share Analysis (2022 to 2032) by Technology

Figure 108: East Asia Market Value Y-o-Y Growth Trend Analysis (2021 to 2032) by Technology

Figure 109: East Asia Market Attractiveness by Technology

Figure 110: East Asia Market Value Share Analysis (2022 to 2032) by Application

Figure 111: East Asia Market Value Y-o-Y Growth Trend Analysis (2021 to 2032) by Application

Figure 112: East Asia Market Attractiveness by Application

Figure 113: East Asia Market Value Share Analysis (2022 to 2032) by Deployment

Figure 114: East Asia Market Value Y-o-Y Growth Trend Analysis (2021 to 2032) by Deployment

Figure 115: East Asia Market Attractiveness by Deployment

Figure 116: East Asia Market Value Share Analysis (2022 to 2032) by Power Rating

Figure 117: East Asia Market Value Y-o-Y Growth Trend Analysis (2021 to 2032) by Power Rating

Figure 118: East Asia Market Attractiveness by Power Rating

Figure 119: East Asia Market Value Share Analysis (2022 to 2032) by Country

Figure 120: East Asia Market Value Y-o-Y Growth Trend Analysis (2021 to 2032) by Country

Figure 121: China Market Absolute $ Opportunity (US$ million), 2017 to 2032

Figure 122: Japan Market Absolute $ Opportunity (US$ million), 2017 to 2032

Figure 123: South Korea Market Absolute $ Opportunity (US$ million), 2017 to 2032

Figure 124: East Asia Market Attractiveness by Country

Figure 125: South Asia & Pacific Market Value (US$ million), 2017 to 2021

Figure 126: South Asia & Pacific Market Value (US$ million), 2022 to 2032

Figure 127: South Asia & Pacific Market Value Share Analysis (2022 to 2032) by Solution

Figure 128: South Asia & Pacific Market Value Y-o-Y Growth Trend Analysis (2021 to 2032) by Solution

Figure 129: South Asia & Pacific Market Attractiveness by Solution

Figure 130: South Asia & Pacific Market Value Share Analysis (2022 to 2032) by Technology

Figure 131: South Asia & Pacific Market Value Y-o-Y Growth Trend Analysis (2021 to 2032) by Technology

Figure 132: South Asia & Pacific Market Attractiveness by Technology

Figure 133: South Asia & Pacific Market Value Share Analysis (2022 to 2032) by Application

Figure 134: South Asia & Pacific Market Value Y-o-Y Growth Trend Analysis (2021 to 2032) by Application

Figure 135: South Asia & Pacific Market Attractiveness by Application

Figure 136: South Asia & Pacific Market Value Share Analysis (2022 to 2032) by Deployment

Figure 137: South Asia & Pacific Market Value Y-o-Y Growth Trend Analysis (2021 to 2032) by Deployment

Figure 138: South Asia & Pacific Market Attractiveness by Deployment

Figure 139: South Asia & Pacific Market Value Share Analysis (2022 to 2032) by Power Rating

Figure 140: South Asia & Pacific Market Value Y-o-Y Growth Trend Analysis (2021 to 2032) by Power Rating

Figure 141: South Asia & Pacific Market Attractiveness by Power Rating

Figure 142: South Asia & Pacific Market Value Share Analysis (2022 to 2032) by Country

Figure 143: South Asia & Pacific Market Value Y-o-Y Growth Trend Analysis (2021 to 2032) by Country

Figure 144: India Market Absolute $ Opportunity (US$ million), 2017 to 2032

Figure 145: Thailand Market Absolute $ Opportunity (US$ million), 2017 to 2032

Figure 146: Indonesia Market Absolute $ Opportunity (US$ million), 2017 to 2032

Figure 147: Malaysia Market Absolute $ Opportunity (US$ million), 2017 to 2032

Figure 148: Australia & New Zealand Market Absolute $ Opportunity (US$ million), 2017 to 2032

Figure 149: Rest of South Asia & Pacific Market Absolute $ Opportunity (US$ million), 2017 to 2032

Figure 150: South Asia & Pacific Market Attractiveness by Country

Figure 151: Middle East and Africa Market Value (US$ million), 2017 to 2021

Figure 152: Middle East and Africa Market Value (US$ million), 2022 to 2032

Figure 153: Middle East and Africa Market Value Share Analysis (2022 to 2032) by Solution

Figure 154: Middle East and Africa Market Value Y-o-Y Growth Trend Analysis (2021 to 2032) by Solution

Figure 155: Middle East and Africa Market Attractiveness by Solution

Figure 156: Middle East and Africa Market Value Share Analysis (2022 to 2032) by Technology

Figure 157: Middle East and Africa Market Value Y-o-Y Growth Trend Analysis (2021 to 2032) by Technology

Figure 158: Middle East and Africa Market Attractiveness by Technology

Figure 159: Middle East and Africa Market Value Share Analysis (2022 to 2032) by Application

Figure 160: Middle East and Africa Market Value Y-o-Y Growth Trend Analysis (2021 to 2032) by Application

Figure 161: Middle East and Africa Market Attractiveness by Application

Figure 162: Middle East and Africa Market Value Share Analysis (2022 to 2032) by Deployment

Figure 163: Middle East and Africa Market Value Y-o-Y Growth Trend Analysis (2021 to 2032) by Deployment

Figure 164: Middle East and Africa Market Attractiveness by Deployment

Figure 165: Middle East and Africa Market Value Share Analysis (2022 to 2032) by Power Rating

Figure 166: Middle East and Africa Market Value Y-o-Y Growth Trend Analysis (2021 to 2032) by Power Rating

Figure 167: Middle East and Africa Market Attractiveness by Power Rating

Figure 168: Middle East and Africa Market Value Share Analysis (2022 to 2032) by Country

Figure 169: Middle East and Africa Market Value Y-o-Y Growth Trend Analysis (2021 to 2032) by Country

Figure 170: GCC Countries Market Absolute $ Opportunity (US$ million), 2017 to 2032

Figure 171: Northern Africa Market Absolute $ Opportunity (US$ million), 2017 to 2032

Figure 172: South Africa Market Absolute $ Opportunity (US$ million), 2017 to 2032

Figure 173: Rest of Middle East & Africa Market Absolute $ Opportunity (US$ million), 2017 to 2032

Figure 174: Middle East and Africa Market Attractiveness by Country

Need specific information?

Request Customization

Explore Technology Insights

View Reports

Recommendations

Oil and Gas

Power Transmission Lines and Towers Market

Published : March 2022

Oil and Gas

Power Management System Market

Published : March 2022

Industrial Automation

Power Transformer Market

Published : August 2021

Industrial Automation

Medium Voltage Transformer Market

Published : March 2022

Google translate

High Voltage Direct Current (HVDC) Transmission System Market