

- Industry Size (2025)
- USD 1.6 Bn
- Forecast (2035)
- USD 3.6 Bn
- CAGR (2025 to 2035)
- 8.2%
Transmission Overload Protectors Market Size and Share Forecast Outlook 2025 to 2035
The Transmission Overload Protectors Market is estimated to be valued at USD 1.6 billion in 2025 and is projected to reach USD 3.6 billion by 2035, registering a compound annual growth rate (CAGR) of 8.2% over the forecast period.
Quick Stats for Transmission Overload Protectors Market
- Transmission Overload Protectors Market Value (2025): USD 1.6 billion
- Transmission Overload Protectors Market Forecast Value (2035): USD 3.6 billion
- Transmission Overload Protectors Market Forecast CAGR: 8.2%
- Leading Segment in Transmission Overload Protectors Market in 2025: Linear (30.5%)
- Key Growth Regions in Transmission Overload Protectors Market: North America, Asia-Pacific, Europe
- Top Key Players in Transmission Overload Protectors Market: ABB Ltd., Schneider Electric SE, Siemens AG, Eaton Corporation, General Electric Company, Mitsubishi Electric Corporation, Rockwell Automation, Inc., Littelfuse, Inc., Fuji Electric Co., Ltd., Toshiba Corporation, Legrand SA, Hitachi, Ltd., Honeywell International Inc.
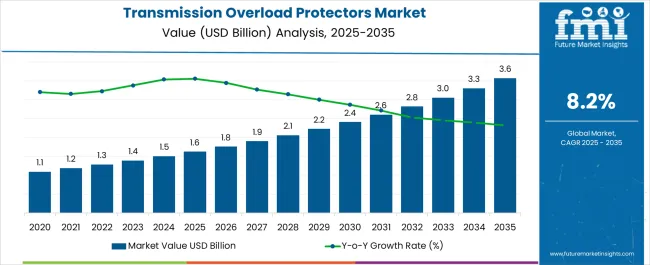
Transmission Overload Protectors Market Key Takeaways
| Metric | Value |
|---|---|
| Transmission Overload Protectors Market Estimated Value in (2025 E) | USD 1.6 billion |
| Transmission Overload Protectors Market Forecast Value in (2035 F) | USD 3.6 billion |
| Forecast CAGR (2025 to 2035) | 8.2% |
Why is the Transmission Overload Protectors Market Growing?
The Transmission Overload Protectors market is witnessing steady growth, driven by the rising demand for reliable electrical protection in industrial and commercial transmission systems. Increasing focus on minimizing downtime, preventing equipment damage, and ensuring operational safety is fueling adoption. Technological advancements in overload protection devices, including enhanced precision, durability, and real-time monitoring capabilities, are further driving market expansion.
The integration of smart monitoring systems, predictive maintenance, and compatibility with modern automation frameworks allows for improved system efficiency and reduced operational costs. Regulatory standards and safety compliance requirements across industries are also reinforcing the need for high-performance overload protectors. Growing industrialization, expansion of manufacturing facilities, and modernization of transmission networks are creating additional demand.
As the adoption of energy-efficient and intelligent electrical systems increases, transmission overload protectors are expected to remain critical for safeguarding assets and maintaining uninterrupted operations The market is positioned for long-term growth, supported by continuous innovation, rising infrastructure investments, and the emphasis on operational reliability across industrial sectors.
Segmental Analysis
The transmission overload protectors market is segmented by transmission type, interface type, application, and geographic regions. By transmission type, transmission overload protectors market is divided into Linear, Torque, Positive Torque, and Friction Torque. In terms of interface type, transmission overload protectors market is classified into Single Position, Multi-Position, and Ball/Detent Interface. Based on application, transmission overload protectors market is segmented into Industrial, Pulp & Paper, Metal Industry, Packaging, Mining, Oil & Gas, Power Generation, Other Manufacturing, Automotive, and Agricultural. Regionally, the transmission overload protectors industry is classified into North America, Latin America, Western Europe, Eastern Europe, Balkan & Baltic Countries, Russia & Belarus, Central Asia, East Asia, South Asia & Pacific, and the Middle East & Africa.
Insights into the Linear Transmission Type Segment
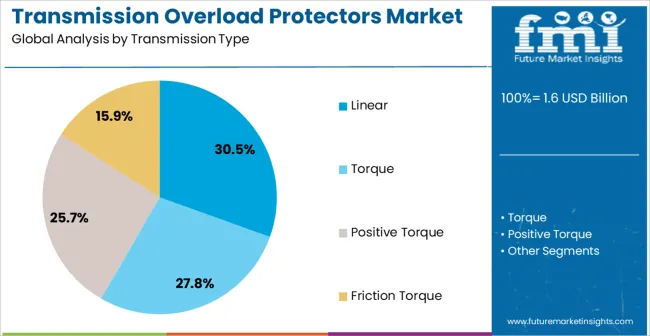
The linear transmission type segment is projected to hold 30.5% of the market revenue in 2025, establishing it as the leading transmission type. Its growth is being driven by the precision, reliability, and simplicity of linear designs, which are suitable for a wide range of overload protection applications. Linear transmission protectors enable consistent performance under varying load conditions, reducing risks of equipment damage and operational disruptions.
The design flexibility and adaptability to different voltage and current ranges allow seamless integration into industrial setups. Continuous improvements in materials, manufacturing techniques, and thermal management have enhanced performance, durability, and lifespan.
Industrial operators prefer linear transmission protectors for their predictable operation, cost efficiency, and ease of installation As demand for precise, reliable, and scalable overload protection solutions rises across manufacturing, energy, and utility sectors, the linear transmission type segment is expected to maintain its leading position, driven by technological innovation and the need for high operational safety.
Insights into the Single Position Interface Type Segment
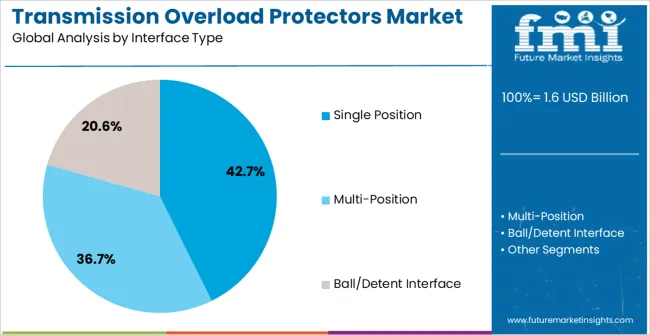
The single position interface type segment is anticipated to account for 42.7% of the market revenue in 2025, making it the leading interface type. Its growth is being driven by the demand for straightforward and reliable interfaces that allow precise control and monitoring of overload protection devices. Single position interfaces provide clear status indication, easy operability, and reduced complexity, which enhances safety and efficiency in industrial and commercial environments.
Compatibility with standard control panels and automation systems further supports widespread adoption. Operators are increasingly leveraging single position interfaces to simplify maintenance, reduce errors, and ensure compliance with safety regulations.
The segment’s dominance is also supported by the preference for robust, easy-to-integrate designs in high-demand applications As industrial facilities adopt more intelligent and automated electrical systems, the single position interface type segment is expected to remain the most adopted, offering a balance of functionality, reliability, and operational convenience.
Insights into the Industrial Application Segment
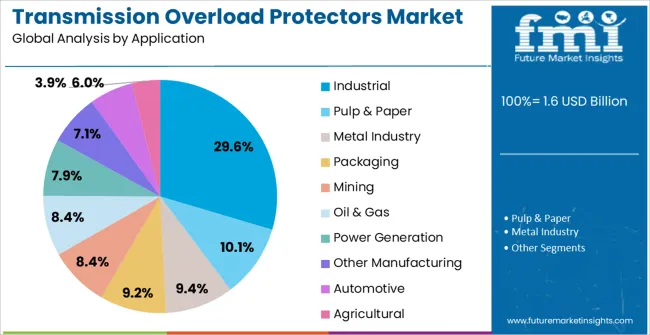
The industrial application segment is projected to hold 29.6% of the market revenue in 2025, establishing it as the leading application category. Its growth is being driven by the increasing adoption of transmission overload protectors in manufacturing, energy, and heavy industry operations where electrical equipment safety and operational continuity are critical. Industrial facilities require robust protection solutions to prevent equipment failures, minimize downtime, and ensure worker safety.
Transmission overload protectors are being integrated into industrial setups to manage variable loads, optimize performance, and comply with stringent safety and regulatory standards. Rising industrial automation, modernization of plants, and expansion of electrical infrastructure are further fueling adoption.
The ability to provide reliable overload protection while supporting predictive maintenance and smart monitoring enhances efficiency and reduces operational costs As industrial operations continue to scale and prioritize safety and energy efficiency, the industrial application segment is expected to maintain its leading market share, supported by the growing emphasis on resilient and intelligent electrical systems.
Market Overview
Transmission Overload Protectors Market: Introduction
Transmission Overload Protectors is mainly used as a protective device which limits the transmission of torque in the drive system in case of an instantaneous increase in torque. The instantaneous increase may occur due to a slow increase in load for instance dirt contamination or damaged bearings.
When the available torque exceeds the required torque, it releases the torque to prevent system damage. It also reconnects the system automatically when the overload torque is passed. In case of dirt contamination or damaged bearings the electronic sensing can be used, as there is time to stop the drive but in case of sudden increase which may be due to mechanical breakage or misfeed mechanical transmission overload protectors can only be effective to protect the drive.
It prevents machine from damage and ensure optimum utilization as well as saves time by eliminating breakdown time. The transmission overload protectors possess minimum maintenance, wide torque adjustment, simple design and easily adjustable, economical, compact and durable.
Analysis of Transmission Overload Protectors Market By Key Countries
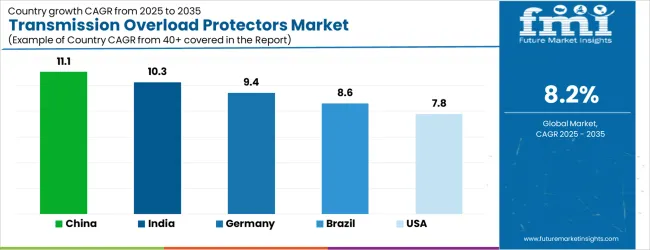
| Country | CAGR |
|---|---|
| China | 11.1% |
| India | 10.3% |
| Germany | 9.4% |
| Brazil | 8.6% |
| USA | 7.8% |
| UK | 7.0% |
| Japan | 6.2% |
Country-wise Analysis
The Transmission Overload Protectors Market is expected to register a CAGR of 8.2% during the forecast period, exhibiting varied country level momentum. China leads with the highest CAGR of 11.1%, followed by India at 10.3%. Developed markets such as Germany, France, and the UK continue to expand steadily, while the USA is likely to grow at consistent rates. Japan posts the lowest CAGR at 6.2%, yet still underscores a broadly positive trajectory for the global Transmission Overload Protectors Market. In 2024, Germany held a dominant revenue in the Western Europe market and is expected to grow with a CAGR of 9.4%. The USA Transmission Overload Protectors Market is estimated to be valued at USD 558.1 million in 2025 and is anticipated to reach a valuation of USD 558.1 million by 2035. Sales are projected to rise at a CAGR of 0.0% over the forecast period between 2025 and 2035. While Japan and South Korea markets are estimated to be valued at USD 86.3 million and USD 44.8 million respectively in 2025.
Key Players in the Transmission Overload Protectors Market
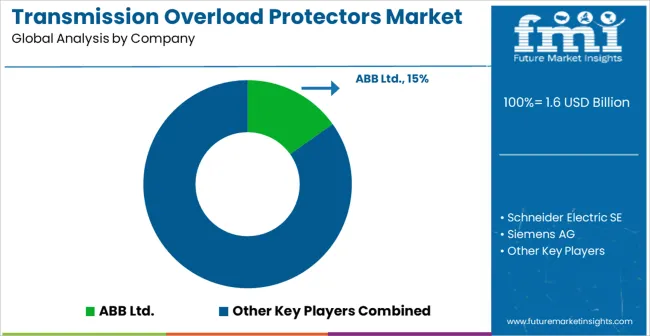
- ABB Ltd.
- Schneider Electric SE
- Siemens AG
- Eaton Corporation
- General Electric Company
- Mitsubishi Electric Corporation
- Rockwell Automation, Inc.
- Littelfuse, Inc.
- Fuji Electric Co., Ltd.
- Toshiba Corporation
- Legrand SA
- Hitachi, Ltd.
- Honeywell International Inc.
Scope of the Report
| Item | Value |
|---|---|
| Quantitative Units | USD 1.6 Billion |
| Transmission Type | Linear, Torque, Positive Torque, and Friction Torque |
| Interface Type | Single Position, Multi-Position, and Ball/Detent Interface |
| Application | Industrial, Pulp & Paper, Metal Industry, Packaging, Mining, Oil & Gas, Power Generation, Other Manufacturing, Automotive, and Agricultural |
| Regions Covered | North America, Europe, Asia-Pacific, Latin America, Middle East & Africa |
| Country Covered | United States, Canada, Germany, France, United Kingdom, China, Japan, India, Brazil, South Africa |
| Key Companies Profiled | ABB Ltd., Schneider Electric SE, Siemens AG, Eaton Corporation, General Electric Company, Mitsubishi Electric Corporation, Rockwell Automation, Inc., Littelfuse, Inc., Fuji Electric Co., Ltd., Toshiba Corporation, Legrand SA, Hitachi, Ltd., and Honeywell International Inc. |
Transmission Overload Protectors Market by Segments
Transmission Type:
- Linear
- Torque
- Positive Torque
- Friction Torque
Interface Type:
- Single Position
- Multi-Position
- Ball/Detent Interface
Application:
- Industrial
- Pulp & Paper
- Metal Industry
- Packaging
- Mining
- Oil & Gas
- Power Generation
- Other Manufacturing
- Automotive
- Agricultural
Region:
- North America
- USA
- Canada
- Mexico
- Latin America
- Brazil
- Chile
- Rest of Latin America
- Western Europe
- Germany
- UK
- Italy
- Spain
- France
- Nordic
- BENELUX
- Rest of Western Europe
- Eastern Europe
- Russia
- Poland
- Hungary
- Balkan & Baltic
- Rest of Eastern Europe
- East Asia
- China
- Japan
- South Korea
- South Asia and Pacific
- India
- ASEAN
- Australia & New Zealand
- Rest of South Asia and Pacific
- Middle East & Africa
- Kingdom of Saudi Arabia
- Other GCC Countries
- Turkiye
- South Africa
- Other African Union
- Rest of Middle East & Africa
Frequently Asked Questions
How big is the transmission overload protectors market in 2025?
The global transmission overload protectors market is estimated to be valued at USD 1.6 billion in 2025.
What will be the size of transmission overload protectors market in 2035?
The market size for the transmission overload protectors market is projected to reach USD 3.6 billion by 2035.
How much will be the transmission overload protectors market growth between 2025 and 2035?
The transmission overload protectors market is expected to grow at a 8.2% CAGR between 2025 and 2035.
What are the key product types in the transmission overload protectors market?
The key product types in transmission overload protectors market are linear, torque, positive torque and friction torque.
Which interface type segment to contribute significant share in the transmission overload protectors market in 2025?
In terms of interface type, single position segment to command 42.7% share in the transmission overload protectors market in 2025.
Preview the report firsthand - request a free sample
Get SampleGet the brochure for pricing and purchase details.
Get PDFTable of Content
- Executive Summary
- Global Market Outlook
- Demand-side Trends
- Supply-side Trends
- Technology Roadmap Analysis
- Analysis and Recommendations
- Market Overview
- Market Coverage / Taxonomy
- Market Definition / Scope / Limitations
- Market Background
- Market Dynamics
- Drivers
- Restraints
- Opportunity
- Trends
- Scenario Forecast
- Demand in Optimistic Scenario
- Demand in Likely Scenario
- Demand in Conservative Scenario
- Opportunity Map Analysis
- Product Life Cycle Analysis
- Supply Chain Analysis
- Investment Feasibility Matrix
- Value Chain Analysis
- PESTLE and Porter’s Analysis
- Regulatory Landscape
- Regional Parent Market Outlook
- Production and Consumption Statistics
- Import and Export Statistics
- Market Dynamics
- Global Market Analysis 2020 to 2024 and Forecast, 2025 to 2035
- Historical Market Size Value (USD Million) Analysis, 2020 to 2024
- Current and Future Market Size Value (USD Million) Projections, 2025 to 2035
- Y-o-Y Growth Trend Analysis
- Absolute $ Opportunity Analysis
- Global Market Pricing Analysis 2020 to 2024 and Forecast 2025 to 2035
- Global Market Analysis 2020 to 2024 and Forecast 2025 to 2035, By Transmission Type
- Introduction / Key Findings
- Historical Market Size Value (USD Million) Analysis By Transmission Type , 2020 to 2024
- Current and Future Market Size Value (USD Million) Analysis and Forecast By Transmission Type , 2025 to 2035
- Linear
- Torque
- Positive Torque
- Friction Torque
- Y-o-Y Growth Trend Analysis By Transmission Type , 2020 to 2024
- Absolute $ Opportunity Analysis By Transmission Type , 2025 to 2035
- Global Market Analysis 2020 to 2024 and Forecast 2025 to 2035, By Interface Type
- Introduction / Key Findings
- Historical Market Size Value (USD Million) Analysis By Interface Type, 2020 to 2024
- Current and Future Market Size Value (USD Million) Analysis and Forecast By Interface Type, 2025 to 2035
- Single Position
- Multi-Position
- Ball/Detent Interface
- Y-o-Y Growth Trend Analysis By Interface Type, 2020 to 2024
- Absolute $ Opportunity Analysis By Interface Type, 2025 to 2035
- Global Market Analysis 2020 to 2024 and Forecast 2025 to 2035, By Application
- Introduction / Key Findings
- Historical Market Size Value (USD Million) Analysis By Application, 2020 to 2024
- Current and Future Market Size Value (USD Million) Analysis and Forecast By Application, 2025 to 2035
- Industrial
- Pulp & Paper
- Metal Industry
- Packaging
- Mining
- Oil & Gas
- Power Generation
- Other Manufacturing
- Automotive
- Agricultural
- Y-o-Y Growth Trend Analysis By Application, 2020 to 2024
- Absolute $ Opportunity Analysis By Application, 2025 to 2035
- Global Market Analysis 2020 to 2024 and Forecast 2025 to 2035, By Region
- Introduction
- Historical Market Size Value (USD Million) Analysis By Region, 2020 to 2024
- Current Market Size Value (USD Million) Analysis and Forecast By Region, 2025 to 2035
- North America
- Latin America
- Western Europe
- Eastern Europe
- East Asia
- South Asia and Pacific
- Middle East & Africa
- Market Attractiveness Analysis By Region
- North America Market Analysis 2020 to 2024 and Forecast 2025 to 2035, By Country
- Historical Market Size Value (USD Million) Trend Analysis By Market Taxonomy, 2020 to 2024
- Market Size Value (USD Million) Forecast By Market Taxonomy, 2025 to 2035
- By Country
- USA
- Canada
- Mexico
- By Transmission Type
- By Interface Type
- By Application
- By Country
- Market Attractiveness Analysis
- By Country
- By Transmission Type
- By Interface Type
- By Application
- Key Takeaways
- Latin America Market Analysis 2020 to 2024 and Forecast 2025 to 2035, By Country
- Historical Market Size Value (USD Million) Trend Analysis By Market Taxonomy, 2020 to 2024
- Market Size Value (USD Million) Forecast By Market Taxonomy, 2025 to 2035
- By Country
- Brazil
- Chile
- Rest of Latin America
- By Transmission Type
- By Interface Type
- By Application
- By Country
- Market Attractiveness Analysis
- By Country
- By Transmission Type
- By Interface Type
- By Application
- Key Takeaways
- Western Europe Market Analysis 2020 to 2024 and Forecast 2025 to 2035, By Country
- Historical Market Size Value (USD Million) Trend Analysis By Market Taxonomy, 2020 to 2024
- Market Size Value (USD Million) Forecast By Market Taxonomy, 2025 to 2035
- By Country
- Germany
- UK
- Italy
- Spain
- France
- Nordic
- BENELUX
- Rest of Western Europe
- By Transmission Type
- By Interface Type
- By Application
- By Country
- Market Attractiveness Analysis
- By Country
- By Transmission Type
- By Interface Type
- By Application
- Key Takeaways
- Eastern Europe Market Analysis 2020 to 2024 and Forecast 2025 to 2035, By Country
- Historical Market Size Value (USD Million) Trend Analysis By Market Taxonomy, 2020 to 2024
- Market Size Value (USD Million) Forecast By Market Taxonomy, 2025 to 2035
- By Country
- Russia
- Poland
- Hungary
- Balkan & Baltic
- Rest of Eastern Europe
- By Transmission Type
- By Interface Type
- By Application
- By Country
- Market Attractiveness Analysis
- By Country
- By Transmission Type
- By Interface Type
- By Application
- Key Takeaways
- East Asia Market Analysis 2020 to 2024 and Forecast 2025 to 2035, By Country
- Historical Market Size Value (USD Million) Trend Analysis By Market Taxonomy, 2020 to 2024
- Market Size Value (USD Million) Forecast By Market Taxonomy, 2025 to 2035
- By Country
- China
- Japan
- South Korea
- By Transmission Type
- By Interface Type
- By Application
- By Country
- Market Attractiveness Analysis
- By Country
- By Transmission Type
- By Interface Type
- By Application
- Key Takeaways
- South Asia and Pacific Market Analysis 2020 to 2024 and Forecast 2025 to 2035, By Country
- Historical Market Size Value (USD Million) Trend Analysis By Market Taxonomy, 2020 to 2024
- Market Size Value (USD Million) Forecast By Market Taxonomy, 2025 to 2035
- By Country
- India
- ASEAN
- Australia & New Zealand
- Rest of South Asia and Pacific
- By Transmission Type
- By Interface Type
- By Application
- By Country
- Market Attractiveness Analysis
- By Country
- By Transmission Type
- By Interface Type
- By Application
- Key Takeaways
- Middle East & Africa Market Analysis 2020 to 2024 and Forecast 2025 to 2035, By Country
- Historical Market Size Value (USD Million) Trend Analysis By Market Taxonomy, 2020 to 2024
- Market Size Value (USD Million) Forecast By Market Taxonomy, 2025 to 2035
- By Country
- Kingdom of Saudi Arabia
- Other GCC Countries
- Turkiye
- South Africa
- Other African Union
- Rest of Middle East & Africa
- By Transmission Type
- By Interface Type
- By Application
- By Country
- Market Attractiveness Analysis
- By Country
- By Transmission Type
- By Interface Type
- By Application
- Key Takeaways
- Key Countries Market Analysis
- USA
- Pricing Analysis
- Market Share Analysis, 2024
- By Transmission Type
- By Interface Type
- By Application
- Canada
- Pricing Analysis
- Market Share Analysis, 2024
- By Transmission Type
- By Interface Type
- By Application
- Mexico
- Pricing Analysis
- Market Share Analysis, 2024
- By Transmission Type
- By Interface Type
- By Application
- Brazil
- Pricing Analysis
- Market Share Analysis, 2024
- By Transmission Type
- By Interface Type
- By Application
- Chile
- Pricing Analysis
- Market Share Analysis, 2024
- By Transmission Type
- By Interface Type
- By Application
- Germany
- Pricing Analysis
- Market Share Analysis, 2024
- By Transmission Type
- By Interface Type
- By Application
- UK
- Pricing Analysis
- Market Share Analysis, 2024
- By Transmission Type
- By Interface Type
- By Application
- Italy
- Pricing Analysis
- Market Share Analysis, 2024
- By Transmission Type
- By Interface Type
- By Application
- Spain
- Pricing Analysis
- Market Share Analysis, 2024
- By Transmission Type
- By Interface Type
- By Application
- France
- Pricing Analysis
- Market Share Analysis, 2024
- By Transmission Type
- By Interface Type
- By Application
- India
- Pricing Analysis
- Market Share Analysis, 2024
- By Transmission Type
- By Interface Type
- By Application
- ASEAN
- Pricing Analysis
- Market Share Analysis, 2024
- By Transmission Type
- By Interface Type
- By Application
- Australia & New Zealand
- Pricing Analysis
- Market Share Analysis, 2024
- By Transmission Type
- By Interface Type
- By Application
- China
- Pricing Analysis
- Market Share Analysis, 2024
- By Transmission Type
- By Interface Type
- By Application
- Japan
- Pricing Analysis
- Market Share Analysis, 2024
- By Transmission Type
- By Interface Type
- By Application
- South Korea
- Pricing Analysis
- Market Share Analysis, 2024
- By Transmission Type
- By Interface Type
- By Application
- Russia
- Pricing Analysis
- Market Share Analysis, 2024
- By Transmission Type
- By Interface Type
- By Application
- Poland
- Pricing Analysis
- Market Share Analysis, 2024
- By Transmission Type
- By Interface Type
- By Application
- Hungary
- Pricing Analysis
- Market Share Analysis, 2024
- By Transmission Type
- By Interface Type
- By Application
- Kingdom of Saudi Arabia
- Pricing Analysis
- Market Share Analysis, 2024
- By Transmission Type
- By Interface Type
- By Application
- Turkiye
- Pricing Analysis
- Market Share Analysis, 2024
- By Transmission Type
- By Interface Type
- By Application
- South Africa
- Pricing Analysis
- Market Share Analysis, 2024
- By Transmission Type
- By Interface Type
- By Application
- USA
- Market Structure Analysis
- Competition Dashboard
- Competition Benchmarking
- Market Share Analysis of Top Players
- By Regional
- By Transmission Type
- By Interface Type
- By Application
- Competition Analysis
- Competition Deep Dive
- ABB Ltd.
- Overview
- Product Portfolio
- Profitability by Market Segments (Product/Age /Sales Channel/Region)
- Sales Footprint
- Strategy Overview
- Marketing Strategy
- Product Strategy
- Channel Strategy
- Schneider Electric SE
- Siemens AG
- Eaton Corporation
- General Electric Company
- Mitsubishi Electric Corporation
- Rockwell Automation, Inc.
- Littelfuse, Inc.
- Fuji Electric Co., Ltd.
- Toshiba Corporation
- Legrand SA
- Hitachi, Ltd.
- Honeywell International Inc.
- ABB Ltd.
- Competition Deep Dive
- Assumptions & Acronyms Used
- Research Methodology


