Reports

- Global Locations -

Headquarters

Future Market Insights, Inc.

Christiana Corporate, 200
Continental Drive, Suite 401,
Newark, Delaware - 19713,
United States

T: +1-845-579-5705

Americas

Future Market Insights, Inc.

616 Corporate Way, Suite 2-9018,
Valley Cottage, NY 10989, United States

T: +1-347-918-3531

MEA

Future Market Insights

1602-6 Jumeirah Bay X2 Tower, Plot No: JLT-PH2-X2A,
Jumeirah Lakes Towers, Dubai,
United Arab Emirates

Europe

Future Market Insights

3rd Floor, 207 Regent Street,
W1B 3HH London
United Kingdom

T: + 44 (0) 20 8123 9659
D: +44 (0) 20 3287 4268

Asia Pacific

Future Market Insights

IndiaLand Global Tech Park, Unit UG-1, Behind Grand HighStreet, Phase 1, Hinjawadi, MH, Pune – 411057, India

Transmission Components Market Outlook (2022 to 2032)

The global transmission components market is set to be valued at US$ 47,966.7 Million in 2022. The market is projected to grow at a CAGR of 5.3% from 2022 to 2032. It is anticipated to reach a valuation of US$ 80,279.2 Million by the end of 2032.

Rapid industrialization, rising energy demand, and improving urban infrastructure are all considered to be major factors contributing to such high growth in the market. Additionally, demand for transmission components is anticipated to increase in the next ten years due to the growing investment in smart cities in developing economies.

According to a recent report by FMI, North America is anticipated to continue to be the most lucrative transmission components market, making up around 1/4th of global sales by 2022. By product type, the junction fuses category is set to experience strong growth between 2022 and 2032 in terms of volume share. The market for transmission components is mainly being driven by increased investment in energy infrastructure, such as distribution and transmission lines for electricity transmission.

The global energy demand is rapidly rising because of the development of megacities and industrialization worldwide. Demand for electrical equipment has increased in recent years due to the rising need for electricity, which is considered to be a prevalent source of energy. As investments are made for developing electrical infrastructures like heavy current overhead power lines, demand for transmission components is anticipated to rise.

Governments of various emerging economies are taking steps to develop measures to ensure a reliable and continuous power supply, thereby reducing the losses that occur during power supply. In the next ten years, these measures are projected to set a trend for the global transmission components market.

Additionally, ongoing investments in grid infrastructure improvement projects are anticipated to boost sales of transmission components. Demand for transmission components is also anticipated to increase in tandem with the development of sustainable electricity networks.

In August 2022, for instance, the USA Department of Energy (DOE) declared that it has issued a new request for information (RFI) seeking input on the Grid Resilience and Innovation Partnership Program worth US$ 10.5 Billion. It is looking forward to improving the reliability and resilience of America’s electric grid.

Similarly, in April 2022, First Trust, a USA-based financial services company, unveiled its Nasdaq Clean Edge Smart Grid Infrastructure fund on Deutsche Börse Xetra and the London Stock Exchange. The company is aiming to help its clients gain exposure to the clean energy segment and directly benefit from future government infrastructure investments.

Attributes Key Statistics
Global Transmission Components Market Estimated Size (2022E) US$ 47,966.7 Million
Projected Market Valuation (2032F) US$ 80,279.2 Million
Value CAGR (2022 to 2032) 5.3%
Collective Value Share: Top 3 Countries (2022) 36.7%

Don't pay for what you don't need

Customize your report by selecting specific countries or regions and save 30%!

2017 to 2021 Transmission Components Market Outlook Compared to 2022 to 2032 Demand Forecast

From 2017 to 2021, the global transmission components market exhibited growth at a 2.4% CAGR and is projected to showcase a CAGR of 5.3% in the forecast period. This increase in YOY growth in 2022 is attributed to rising energy consumption due to factors like increasing population, rapid urbanization, high industrial production, surging mining output, and progressive expansion of access to modern electricity across various geographic locations. In order to develop advanced infrastructure, each of these structures needs reliable power management facilities, which will ultimately increase the demand for transmission components.

The market for transmission components has witnessed a considerable surge in terms of demand as a result of an increasing number of rural electrification initiatives across various parts of the world. As electricity is a basic necessity in many industries, transmission components are widely utilized in electricity distribution, energy & power production, and infrastructure development projects.

Significant growth in terms of demand for electricity from various end users all over the globe, especially in developing nations along with rapid development of electrical infrastructure is expected to benefit the transmission components market in the assessment period. In contrast to the US$ 47,966.7 Million recorded in 2022, the aforementioned factors are anticipated to boost the market to reach US$ 80,279.2 Million by the end of 2032.

Transmission Components Market

Comparative Analysis of Adjacent Transmission Components Market

Transmission Components Market:

Differentiating Aspects Transmission Components Market
CAGR in 2022 to 2032 5.3%
Current Valuation in 2022 US$ 47,966.7 Million
Projected Valuation in 2032 US$ 80,279.2 Million
Demand Drivers
  • The rapid expansion of effective grid infrastructure in line with the rapidly changing climatic condition will push the market during the forecast period.
  • Ongoing refurbishment of damaged power supply equipment and the use of advanced transformers will drive growth.

Compact Power Equipment Rental Market:

Differentiating Aspects Compact Power Equipment Rental Market
CAGR in 2022 to 2032 6.7%
Current Valuation in 2022 US$ 107,234.1 Million
Projected Valuation in 2032 US$ 204,453.2 Million
Demand Drivers
  • Increasing the use of compact power equipment on construction sites for performing tasks like washing, drilling, and cutting will augment sales.
  • A rising need for quick project completion and a surging number of infrastructure development activities are set to bolster the market.

Power Tools Market:

Differentiating Aspects Power Tools Market
CAGR in 2022 to 2032 5.1%
Current Valuation in 2022 US$ 33.36 Billion
Projected Valuation in 2032 US$ 51.2 Billion
Demand Drivers
  • Rapid expansion in end-use industries such as automotive, aerospace, and furniture is projected to fuel the demand for power tools.
  • The development of technologically advanced products like cordless power tools with improved performance and high efficiency is estimated to boost the market in the next ten years.
Nikhil Kaitwade
Nikhil Kaitwade

Principal Consultant

Talk to Analyst

Find your sweet spots for generating winning opportunities in this market.

Top Trends Pushing Sales of Transmission Components Worldwide

  • Demand for Mechanical Power Transmission Components to Surge with Development of New Power Grids

To lower overall energy losses, more innovative products should be developed and installed in transmission lines. One of the key factors influencing the demand for transmission components is the creation of new power infrastructure and the replacement of outdated power infrastructure to ensure uninterrupted and secure energy transmission from power production plants to end users. It is anticipated that there will be a considerable rise in terms of demand for transmission components as they are needed for a secure connection in commercial, residential, and industrial buildings, as well as during the transition to a new electric grid.

The development of intelligent power distribution and control networks will also increase the utilization of transmission components and propel the growth of the local economy. The market is also expected to showcase high growth due to factors like rapid expansion of the power supply networks, high investments in building new power grids, and increased transmission & distribution of power supply.
Country-wise Insights

How are Transmission Components Manufacturers Faring in the USA?

Rising Need for Electrification in the USA to Foster Sales of Transmission Assembly Parts

According to FMI, the USA is expected to hold the largest share of the transmission components market in 2022. The country is anticipated to expand significantly in the next ten years due to a considerable increase in terms of power consumption on the back of rising population and surging industrialization in the USA During the assessment period of 2022 to 2032, the transmission components market is projected to witness tremendous growth in the country due to rising need for electrification across various parts of the USA, as well as increasing concerns regarding the reduction of power losses & electricity cost.

Why is the Demand for Transmission Components Surging in China?

Growing Number of Electrification Projects to Drive the Demand for Transmission Elements in China

China is considered to be one of the most profitable markets for transmission component manufacturers and suppliers. During the forecast period of 2022 to 2032, the country is expected to generate one of the largest absolute incremental opportunities. China's dominance in the global transmission components market is being bolstered by increasing demand for electrification from the industrial, as well as residential sectors.

Rising government initiatives and increasing investments to accelerate electrification projects in an effort to offer power to every resident is a key factors behind the incremental growth rate of the China transmission components market. Installation of transmission components in the industrial and infrastructure sectors in China will provide a plethora of growth potential throughout the span of the assessment period. Urbanization has expanded over time, which has increased the demand for power and fueled the market for transmission components in the country.

Why is Germany Showcasing Lucrative Growth in Terms of Transmission Components Sales?

Replacement of Aging Infrastructure in Germany to Fuel Sales of Transmission Substation Components

According to FMI, Germany is projected to account for nearly 19.7% of the Europe transmission components market share by the end of 2022. Increased research & development spending in the country is anticipated to support market expansion by promoting the development of renewable energy sources and updating aging infrastructure. In order to increase grid stability and resilience, as well as allow smarter power networks, the government of Germany is concentrating on upgrading and replacing conventional infrastructure.

Get the data you need at a Fraction of the cost

Personalize your report by choosing insights you need
and save 40%!

Category-wise Insights

Which is the Highly Preferred Type of Transmission Component Worldwide?

Demand for Anchoring and Foundation Power Transmission Components to Surge by 2032

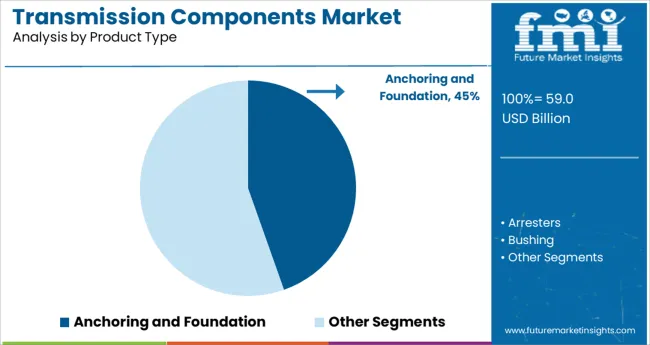
By product type, the anchoring and foundation segment is estimated to dominate the global transmission components market in the evaluation period. The dominance of the segment is expected to continue throughout the forecast period and it is likely to exhibit a CAGR of 6.1% from 2022 to 2032.

Growth of the segment is mainly attributed to increasing power generation from renewable sources, which is further pushing the need for high-tech infrastructure for electricity transmission. As anchoring and foundation components are the backbones of high-tech electricity transmission structures, it is resulting in increasing demand across the globe.

Competitive Landscape

The global transmission components market is projected to gain momentum in the evaluation period with the presence of several big, medium, and small-scale manufacturers and service providers. Established and emerging market participants are striving to generate new sources of revenue by developing long-term relationships with OEMs and small-scale transmission components manufacturers in countries such as India and the USA Leading industry players are also investing in new advanced technologies that will enable the future production of high-quality transmission components.

For instance,

  • In August 2019, Premium Transmission, a renowned producer of fluid coupling, geared motors, and industrial gearboxes, announced the launch of seven clutter-breaking products under the industrial gear segment. Its new products are highly efficient and are mainly developed to cater to the numerous end-use industries such as power, oil & gas, material handling, steel, food & beverage, elevators, textile, and cement.

Scope of the Transmission Components Market Report

Attribute Details
Estimated Market Size (2022) US$ 47,966.7 Million
Projected Market Valuation (2032) US$ 80,279.2 Million
Value-based CAGR (2022 to 2032) 5.3%
Forecast Period 2022 to 2032
Historical Data Available for 2017 to 2021
Market Analysis Value (US$ Million)
Key Market Segments Covered Product Type and Region
Key Regions/Countries Covered
  • North America
  • United States of America
  • Canada
  • Latin America
  • Mexico
  • Brazil
  • Europe
  • Germany
  • France
  • Italy
  • Spain
  • United Kingdom
  • Russia
  • BENELUX
  • East Asia
  • China
  • Japan
  • South Korea
  • South Asia & Pacific
  • India
  • ASEAN
  • Oceania
  • Middle East & Africa
  • Turkey
  • South Africa
  • North Africa
Key Companies Profiled Hitachi ABB Power Grids, Siemens Energy, General Electric (GE), Eaton, Hubbell, TE Connectivity, Toshiba
Report Coverage Market Forecast, brand share analysis, competition intelligence, Drivers, Restraints, Opportunities and Threats analysis, Market Dynamics and Challenges, Strategic Growth Initiatives

Transmission Components Market Outlook by Category

By Product Type:

  • Anchoring and Foundation
  • Arresters
  • Bushing
  • Connectors
  • Insulators
  • Enclosures
  • Utility Measurement Systems
  • Grounding and Bonding
  • Switches
  • Fuses

By Region:

  • North America
  • Latin America
  • Europe
  • East Asia
  • South Asia & Pacific
  • Middle East & Africa

Frequently Asked Questions

What is the projected size of the global transmission components market by 2032?

The global transmission components market is expected to surpass US$ 80.3 Billion by 2032.

What is the estimated growth rate for the transmission components market from 2022 to 2032?

The global transmission components market is slated to increase at a value CAGR of around 5.3% throughout 2032.

What is the historical growth rate for the transmission components market from 2017 to 2021?

The global transmission components market witnessed a CAGR of 2.4% during the historical period of 2017 to 2021.

Which are the most lucrative transmission components market?

China, USA, and Japan are the most lucrative transmission components markets, with Europe and South East Asia projected to hold the highest share of more than 35% by 2032.

Who are the top transmission components manufacturers?

Tier-1 firms such as Siemens Energy, General Electric, Eaton, Hubble, and Schneider Electric are estimated to be the key participants in the global transmission components market.

How is the transmission components market shaping up in North America?

The transmission components market is expected to increase at 5.1% CAGR through 2032 in North America.

At what rate is the transmission components market set to register growth in Germany?

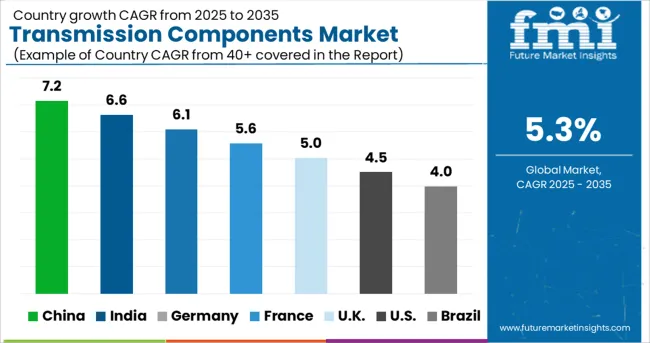
Germany is projected to register growth at a rate of 6.6% in the transmission components market between 2022 and 2032

Table of Content

1. Executive Summary | Transmission Components Market

    1.1. Global Market Outlook

    1.2. Demand Side Trends

    1.3. Supply Side Trends

    1.4. Technology Roadmap

    1.5. Analysis and Recommendations

2. Market Overview

    2.1. Market Coverage / Taxonomy

    2.2. Market Definition / Scope / Limitations

3. Key Market Trends

    3.1. Key Trends Impacting the Market

    3.2. Product Innovation / Development Trends

4. Key Success Factors

    4.1. Product Adoption / Usage Analysis

    4.2. Product USPs / Features

    4.3. Strategic Promotional Strategies

5. Global Market Demand Analysis 2017 to 2021 and Forecast, 2022 to 2032

    5.1. Historical Market Volume (‘000 Units) Analysis, 2017 to 2021

    5.2. Current and Future Market Volume (‘000 Units) Projections, 2022 to 2032

    5.3. Y-o-Y Growth Trend Analysis

6. Global Market - Pricing Analysis

    6.1. Regional Pricing Analysis

    6.2. Global Average Pricing Analysis Benchmark

7. Global Market Demand (in Value or Category-B in (US$ Million) Analysis 2017 to 2021 and Forecast, 2022 to 2032

    7.1. Historical Market Value (US$ Million) Analysis, 2017 to 2021

    7.2. Current and Future Market Value (US$ Million) Projections, 2022 to 2032

        7.2.1. Y-o-Y Growth Trend Analysis

        7.2.2. Absolute $ Opportunity Analysis

8. Market Background

    8.1. Macro-Economic Factors

        8.1.1. Global GDP Growth Outlook

        8.1.2. Global Industrial Automation Overview

        8.1.3. Manufacturing Value Addition

        8.1.4. Global Power Generation Overview

        8.1.5. Global Electricity Distribution Overview

        8.1.6. Parent Market Overview

        8.1.7. Other macro-economic factors

    8.2. Forecast Factors - Relevance & Impact

        8.2.1. Top Companies Historical Growth

        8.2.2. GDP Growth forecast

        8.2.3. Increasing Oil prices

        8.2.4. Global GDP Growth Outlook

        8.2.5. Global Urbanization Growth Outlook

        8.2.6. Other Key Forecast factors

    8.3. Value Chain

        8.3.1. Raw Material Suppliers

        8.3.2. Product Manufacturers

        8.3.3. End Users

    8.4. COVID-19 Crisis - Impact Assessment

        8.4.1. Current Statistics

        8.4.2. Short-Mid-Long Term Outlook

        8.4.3. Likely Rebound

    8.5. Market Dynamics

        8.5.1. Drivers

        8.5.2. Restraints

        8.5.3. Opportunity Analysis

9. Global Market Analysis 2017 to 2021 and Forecast 2021 to 2032, by Product Type

    9.1. Introduction / Key Findings

    9.2. Historical Market Category-B (US$ Million) and Volume Analysis By Product Type, 2017 to 2021

    9.3. Current and Future Market Category-B (US$ Million) and Volume Analysis and Forecast By Product Type, 2022 to 2032

        9.3.1. Anchoring and Foundation

        9.3.2. Arresters

        9.3.3. Bushing

        9.3.4. Connectors

        9.3.5. Insulators

        9.3.6. Enclosures

        9.3.7. Utility Measurement Systems

        9.3.8. Grounding and Bonding

        9.3.9. Switches

        9.3.10. Fuses

    9.4. Market Attractiveness Analysis By Product Type

10. Global Market Analysis 2017 to 2021 and Forecast 2022 to 2032, by Region

    10.1. Introduction

    10.2. Historical Market Category-B (US$ Million) and Volume Analysis By Region, 2017 to 2021

    10.3. Current Market Category-B (US$ Million) and Volume Analysis and Forecast By Region, 2022 to 2032

        10.3.1. North America

        10.3.2. Latin America

        10.3.3. Europe

        10.3.4. South Asia Pacific

        10.3.5. East Asia

        10.3.6. Middle East & Africa

    10.4. Market Attractiveness Analysis By Region

11. North America Market Analysis 2017 to 2021 and Forecast 2022 to 2032

    11.1. Introduction

    11.2. Pricing Analysis

    11.3. Historical Market Category-B (US$ Million) and Volume Trend Analysis By Market Taxonomy, 2017 to 2021

    11.4. Market Category-B (US$ Million) and Volume Forecast By Market Taxonomy, 2022 to 2032

        11.4.1. By Country

            11.4.1.1. United States of America

            11.4.1.2. Canada

        11.4.2. By Product Type

    11.5. Market Attractiveness Analysis

        11.5.1. By Country

        11.5.2. By Product Type

    11.6. Market Trends

    11.7. Key Market Participants - Intensity Mapping

    11.8. Drivers and Restraints - Impact Analysis

12. Latin America Market Analysis 2017 to 2021 and Forecast 2021 to 2032

    12.1. Introduction

    12.2. Pricing Analysis

    12.3. Historical Market Category-B (US$ Million) and Volume Trend Analysis By Market Taxonomy, 2017 to 2021

    12.4. Market Category-B (US$ Million) and Volume Forecast By Market Taxonomy, 2022 to 2032

        12.4.1. By Country

            12.4.1.1. Brazil

            12.4.1.2. Mexico

            12.4.1.3. Rest of Latin America

        12.4.2. By Product Type

    12.5. Market Attractiveness Analysis

        12.5.1. By Country

        12.5.2. By Product Type

    12.6. Market Trends

    12.7. Key Market Participants - Intensity Mapping

    12.8. Drivers and Restraints - Impact Analysis

13. Europe Market Analysis 2017 to 2021 and Forecast 2022 to 2032

    13.1. Introduction

    13.2. Pricing Analysis

    13.3. Historical Market Category-B (US$ Million) and Volume Trend Analysis By Market Taxonomy, 2017 to 2021

    13.4. Market Category-B (US$ Million) and Volume Forecast By Market Taxonomy, 2022 to 2032

        13.4.1. By Country

            13.4.1.1. Germany

            13.4.1.2. Italy

            13.4.1.3. France

            13.4.1.4. United Kingdom

            13.4.1.5. Spain

            13.4.1.6. BENELUX

            13.4.1.7. Russia

            13.4.1.8. Rest of Europe

        13.4.2. By Product Type

    13.5. Market Attractiveness Analysis

        13.5.1. By Country

        13.5.2. By Product Type

    13.6. Market Trends

    13.7. Key Market Participants - Intensity Mapping

    13.8. Drivers and Restraints - Impact Analysis

14. South Asia and Pacific Market Analysis 2017 to 2021 and Forecast 2022 to 2032

    14.1. Introduction

    14.2. Pricing Analysis

    14.3. Historical Market Category-B (US$ Million) and Volume Trend Analysis By Market Taxonomy, 2017 to 2021

    14.4. Market Category-B (US$ Million) and Volume Forecast By Market Taxonomy, 2022 to 2032

        14.4.1. By Country

            14.4.1.1. India

            14.4.1.2. ASEAN

            14.4.1.3. Oceania

            14.4.1.4. Rest of South Asia & Pacific

        14.4.2. By Product Type

    14.5. Market Attractiveness Analysis

        14.5.1. By Country

        14.5.2. By Product Type

    14.6. Market Trends

    14.7. Key Market Participants - Intensity Mapping

    14.8. Drivers and Restraints - Impact Analysis

15. East Asia Market Analysis 2017 to 2021 and Forecast 2022 to 2032

    15.1. Introduction

    15.2. Pricing Analysis

    15.3. Historical Market Category-B (US$ Million) and Volume Trend Analysis By Market Taxonomy, 2017 to 2021

    15.4. Market Category-B (US$ Million) and Volume Forecast By Market Taxonomy, 2022 to 2032

        15.4.1. By Country

            15.4.1.1. China

            15.4.1.2. Japan

            15.4.1.3. South Korea

        15.4.2. By Product Type

    15.5. Market Attractiveness Analysis

        15.5.1. By Country

        15.5.2. By Product Type

    15.6. Market Trends

    15.7. Key Market Participants - Intensity Mapping

    15.8. Drivers and Restraints - Impact Analysis

16. Middle East and Africa Market Analysis 2017 to 2021 and Forecast 2022 to 2032

    16.1. Introduction

    16.2. Pricing Analysis

    16.3. Historical Market Category-B (US$ Million) and Volume Trend Analysis By Market Taxonomy, 2017 to 2021

    16.4. Market Category-B (US$ Million) and Volume Forecast By Market Taxonomy, 2022 to 2032

        16.4.1. By Country

            16.4.1.1. GCC Countries

            16.4.1.2. Turkey

            16.4.1.3. Northern Africa

            16.4.1.4. South Africa

            16.4.1.5. Rest of Middle East and Africa

        16.4.2. By Product Type

    16.5. Market Attractiveness Analysis

        16.5.1. By Country

        16.5.2. By Product Type

    16.6. Market Trends

    16.7. Key Market Participants - Intensity Mapping

    16.8. Drivers and Restraints - Impact Analysis

17. Emerging Countries Market Analysis

    17.1. Introduction

        17.1.1. Market Value Proportion Analysis, By Key Countries

        17.1.2. Global Vs. Country Growth Comparison

    17.2. United States of America Market Analysis

        17.2.1. By Product Type

    17.3. Canada Market Analysis

        17.3.1. By Product Type

    17.4. Mexico Market Analysis

        17.4.1. By Product Type

    17.5. Brazil Market Analysis

        17.5.1. By Product Type

    17.6. Germany Market Analysis

        17.6.1. By Product Type

    17.7. Italy Market Analysis

        17.7.1. By Product Type

    17.8. France Market Analysis

        17.8.1. By Product Type

    17.9. United Kingdom Market Analysis

        17.9.1. By Product Type

    17.10. Spain Market Analysis

        17.10.1. By Product Type

    17.11. Russia Market Analysis

        17.11.1. By Product Type

    17.12. BENELUX Market Analysis

        17.12.1. By Product Type

    17.13. China Market Analysis

        17.13.1. By Product Type

    17.14. Japan Market Analysis

        17.14.1. By Product Type

    17.15. S. Korea Market Analysis

        17.15.1. By Product Type

    17.16. India Market Analysis

        17.16.1. By Product Type

    17.17. ASEAN Market Analysis

        17.17.1. By Product Type

    17.18. Oceania Market Analysis

        17.18.1. By Product Type

    17.19. Turkey Market Analysis

        17.19.1. By Product Type

    17.20. GCC Countries Market Analysis

        17.20.1. By Product Type

    17.21. Northern Africa Market Analysis

        17.21.1. By Product Type

    17.22. South Africa Market Analysis

        17.22.1. By Product Type

18. Market Structure Analysis

    18.1. Market Analysis by Tier of Companies (Transmission Components)

    18.2. Market Share Analysis of Top Players

    18.3. Market Presence Analysis

19. Competition Analysis

    19.1. Competition Dashboard

    19.2. Competition Benchmarking

    19.3. Competition Deep Dive

        19.3.1. Hubbell

            19.3.1.1. Overview

            19.3.1.2. Product Portfolio

            19.3.1.3. Profitability by Market Segments (Product/Channel/Region)

            19.3.1.4. Sales Footprint

            19.3.1.5. Strategy Overview

        19.3.2. Eaton Corporation (Cooper and Crouse-Hinds)

            19.3.2.1. Overview

            19.3.2.2. Product Portfolio

            19.3.2.3. Profitability by Market Segments (Product/Channel/Region)

            19.3.2.4. Sales Footprint

            19.3.2.5. Strategy Overview

        19.3.3. ABB (Thomas & Betts)

            19.3.3.1. Overview

            19.3.3.2. Product Portfolio

            19.3.3.3. Profitability by Market Segments (Product/Channel/Region)

            19.3.3.4. Sales Footprint

            19.3.3.5. Strategy Overview

        19.3.4. MacLean Power Systems

            19.3.4.1. Overview

            19.3.4.2. Product Portfolio

            19.3.4.3. Profitability by Market Segments (Product/Channel/Region)

            19.3.4.4. Sales Footprint

            19.3.4.5. Strategy Overview

        19.3.5. S&C Electric

            19.3.5.1. Overview

            19.3.5.2. Product Portfolio

            19.3.5.3. Profitability by Market Segments (Product/Channel/Region)

            19.3.5.4. Sales Footprint

            19.3.5.5. Strategy Overview

        19.3.6. Aluma-Form

            19.3.6.1. Overview

            19.3.6.2. Product Portfolio

            19.3.6.3. Profitability by Market Segments (Product/Channel/Region)

            19.3.6.4. Sales Footprint

            19.3.6.5. Strategy Overview

        19.3.7. Siemens

            19.3.7.1. Overview

            19.3.7.2. Product Portfolio

            19.3.7.3. Profitability by Market Segments (Product/Channel/Region)

            19.3.7.4. Sales Footprint

            19.3.7.5. Strategy Overview

        19.3.8. Schneider Electric

            19.3.8.1. Overview

            19.3.8.2. Product Portfolio

            19.3.8.3. Profitability by Market Segments (Product/Channel/Region)

            19.3.8.4. Sales Footprint

            19.3.8.5. Strategy Overview

        19.3.9. General Electric

            19.3.9.1. Overview

            19.3.9.2. Product Portfolio

            19.3.9.3. Profitability by Market Segments (Product/Channel/Region)

            19.3.9.4. Sales Footprint

            19.3.9.5. Strategy Overview

        19.3.10. Generac

            19.3.10.1. Overview

            19.3.10.2. Product Portfolio

            19.3.10.3. Profitability by Market Segments (Product/Channel/Region)

            19.3.10.4. Sales Footprint

            19.3.10.5. Strategy Overview

        19.3.11. TE Connectivity

            19.3.11.1. Overview

            19.3.11.2. Product Portfolio

            19.3.11.3. Profitability by Market Segments (Product/Channel/Region)

            19.3.11.4. Sales Footprint

            19.3.11.5. Strategy Overview

        19.3.12. Taylor Power Systems

            19.3.12.1. Overview

            19.3.12.2. Product Portfolio

            19.3.12.3. Profitability by Market Segments (Product/Channel/Region)

            19.3.12.4. Sales Footprint

            19.3.12.5. Strategy Overview

        19.3.13. Power Systems and Controls

            19.3.13.1. Overview

            19.3.13.2. Product Portfolio

            19.3.13.3. Profitability by Market Segments (Product/Channel/Region)

            19.3.13.4. Sales Footprint

            19.3.13.5. Strategy Overview

        19.3.14. Emerson Electric Co

            19.3.14.1. Overview

            19.3.14.2. Product Portfolio

            19.3.14.3. Profitability by Market Segments (Product/Channel/Region)

            19.3.14.4. Sales Footprint

            19.3.14.5. Strategy Overview

        19.3.15. Toshiba

            19.3.15.1. Overview

            19.3.15.2. Product Portfolio

            19.3.15.3. Profitability by Market Segments (Product/Channel/Region)

            19.3.15.4. Sales Footprint

            19.3.15.5. Strategy Overview

        19.3.16. Mitsubishi Electric

            19.3.16.1. Overview

            19.3.16.2. Product Portfolio

            19.3.16.3. Profitability by Market Segments (Product/Channel/Region)

            19.3.16.4. Sales Footprint

            19.3.16.5. Strategy Overview

        19.3.17. Socomec

            19.3.17.1. Overview

            19.3.17.2. Product Portfolio

            19.3.17.3. Profitability by Market Segments (Product/Channel/Region)

            19.3.17.4. Sales Footprint

            19.3.17.5. Strategy Overview

20. Primary Survey Analysis

21. Assumptions and Acronyms Used

22. Research Methodology

List of Tables

Table 01: Global Market Volume (Units) & Value (US$ Million) Forecast by Product Type, 2017 to 2032

Table 02: Global Market Volume (Units) & Value (US $ Million) Forecast by Region, 2017 to 2032

Table 03: North America Market Volume (Units) & Value (US $ Million) Forecast by Country, 2017 to 2032

Table 04: North America Market Volume (Units) & Value (US$ Million) Forecast by Product Type, 2017 to 2032

Table 05: Latin America Market Volume (Units) & Value (US $ Million) Forecast by Country, 2017 to 2032

Table 06: Latin America Market Volume (Units) & Value (US$ Million) Forecast by Product Type, 2017 to 2032

Table 07: Europe Market Volume (Units) & Value (US $ Million) Forecast by Region, 2017 to 2032

Table 08: Europe Market Volume (Units) & Value (US$ Million) Forecast by Product Type, 2017 to 2032

Table 09: East Asia Market Volume (Units) & Value (US $ Million) Forecast by Country, 2017 to 2032

Table 10: East Asia Market Volume (Units) & Value (US$ Million) Forecast by Product Type, 2017 to 2032

Table 11: South Asia & Pacific Market Volume (Units) & Value (US $ Million) Forecast by Country, 2017 to 2032

Table 12: South Asia & Pacific Market Volume (Units) & Value (US$ Million) Forecast by Product Type, 2017 to 2032

Table 13: Middle East and Africa Market Volume (Units) & Value (US $ Million) Forecast by Country, 2017 to 2032

Table 14: Middle East and Africa Market Volume (Units) & Value (US$ Million) Forecast by Product Type, 2017 to 2032

List of Charts

Figure 01: Global Market Volume (Units) and Y-o-Y Growth Rate from 2022 to 2032

Figure 02: Global Pricing Analysis by Product Type (US$/Tons), 2021A

Figure 03: Global Market Volume Share (2021A) By Product Type

Figure 04: Global Market Size (2017 to 2021)

Figure 05: Global Absolute $ Opportunity Analysis (2017 to 2032)

Figure 06: Global Market Size (2022 to 2032)

Figure 07: Global Market Share and BPS Analysis by Product Type - 2022 to 2032

Figure 08: Global Market Y-o-Y Growth Projections by Product Type, 2022 to 2032

Figure 09: Global Market Attractiveness by Product Type, 2022 to 2032

Figure 10: Global Market Share and BPS Analysis by Region - 2022 to 2032

Figure 11: Global Market Y-o-Y Growth Projections by Region, 2022 to 2032

Figure 12: Global Market Attractiveness by Region, 2022 to 2032

Figure 13: North America Market Share and BPS Analysis by Country - 2022 to 2032

Figure 14: North America Market Y-o-Y Growth Projections by Country, 2022 to 2032

Figure 15: North America Market Attractiveness by Country, 2022 to 2032

Figure 16: North America Market Share and BPS Analysis by Product Type - 2022 to 2032

Figure 17: North America Market Y-o-Y Growth Projections by Product Type, 2022 to 2032

Figure 18: North America Market Attractiveness by Product Type, 2022 to 2032

Figure 19: Latin America Market Share and BPS Analysis by Country - 2022 to 2032

Figure 20: Latin America Market Y-o-Y Growth Projections by Country, 2022 to 2032

Figure 21: Latin America Market Attractiveness by Country, 2022 to 2032

Figure 22: Latin America Market Share and BPS Analysis by Product Type - 2022 to 2032

Figure 23: Latin America Market Y-o-Y Growth Projections by Product Type, 2022 to 2032

Figure 24: Latin America Market Attractiveness by Product Type, 2022 to 2032

Figure 25: Europe Market Share and BPS Analysis by Region - 2022 to 2032

Figure 26: Europe Market Y-o-Y Growth Projections by Region, 2022 to 2032

Figure 27: Europe Market Attractiveness by Region, 2022 to 2032

Figure 28: Europe Market Share and BPS Analysis by Product Type - 2022 to 2032

Figure 29: Europe Market Y-o-Y Growth Projections by Product Type, 2022 to 2032

Figure 30: Europe Market Attractiveness by Product Type, 2022 to 2032

Figure 31: East Asia Market Share and BPS Analysis by Country - 2022 to 2032

Figure 32: East Asia Market Y-o-Y Growth Projections by Country, 2022 to 2032

Figure 33: East Asia Market Attractiveness by Country, 2022 to 2032

Figure 34: East Asia Market Share and BPS Analysis by Product Type - 2022 to 2032

Figure 35: East Asia Market Y-o-Y Growth Projections by Product Type, 2022 to 2032

Figure 36: East Asia Market Attractiveness by Product Type, 2022 to 2032

Figure 37: South Asia & Pacific Market Share and BPS Analysis by Country - 2022 to 2032

Figure 38: South Asia & Pacific Market Y-o-Y Growth Projections by Country, 2022 to 2032

Figure 39: South Asia & Pacific Market Attractiveness by Country, 2022 to 2032

Figure 40: South Asia & Pacific Market Share and BPS Analysis by Product Type - 2022 to 2032

Figure 41: South Asia & Pacific Market Y-o-Y Growth Projections by Product Type, 2022 to 2032

Figure 42: South Asia & Pacific Market Attractiveness by Product Type, 2022 to 2032

Figure 43: Middle East and Africa Market Share and BPS Analysis by Country - 2022 to 2032

Figure 44: Middle East and Africa Market Y-o-Y Growth Projections by Country, 2022 to 2032

Figure 45: Middle East and Africa Market Attractiveness by Country, 2022 to 2032

Figure 46: Middle East and Africa Market Share and BPS Analysis by Product Type - 2022 to 2032

Figure 47: Middle East and Africa Market Y-o-Y Growth Projections by Product Type, 2022 to 2032

Figure 48: Middle East and Africa Market Attractiveness by Product Type, 2022 to 2032

Recommendations

Technology

Surge Protection Device Market

Published : November 2023

Industrial Automation

Surge Arrester Market

Published : November 2023

Explore Industrial Automation Insights

View Reports

Transmission Components Market