Transmission Fluids Market Outlook 2023 to 2033

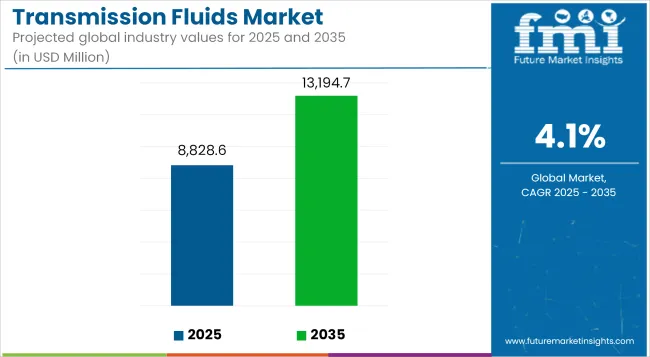
The global transmission fluids market reaches a valuation of US$ 8.0 billion in 2023, with a projected CAGR of 4.1% from 2023 to 2033. By 2033, the market is anticipated to reach US$ 12.0 billion.

Key Highlights

Soaring Demands for Passenger and Commercial Vehicles in Emerging Economies

The escalating demand for passenger vehicles in emerging economies, such as India and China, driven by rising disposable incomes and urbanization, is expected to contribute significantly to the growth of the transmission fluids market. As these countries continue to expand their automotive industries, the need for transmission fluids for OEM vehicle production and aftermarket servicing will increase.

Cruising Toward the Future Through Exploration of the Global Transmission Fluids Market

As the automotive industry experiences a paradigm shift toward sustainable mobility solutions, the transmission fluids market is adapting by focusing on environmentally friendly formulations. This includes the development of transmission fluids with enhanced biodegradability and reduced environmental impact, aligning with global sustainability goals and regulations.

Transmission Fluids Market Estimated Value (2023) US$ 8.0 billion
Transmission Fluids Market Estimated Value (2033) US$ 12.0 billion
Transmission Fluids Market Value CAGR (2023 to 2033) 4.1%

Don't pay for what you don't need

Customize your report by selecting specific countries or regions and save 30%!

2023 to 2033 Transmission Fluids Market Outlook in Comparison to 2018 to 2022 Growth

The transmission fluids market is undergoing a profound transformation from 2023 to 2033, diverging significantly from the growth observed between 2018 and 2022, where the market secured a 5.6% CAGR from 2018 to 2022 compared to a 4.1% growth rate from 2023 to 2033.

The central catalyst behind this shift is the rapid electrification of vehicles, particularly the rise of electric vehicles (EVs). This transition is reducing the demand for traditional transmission fluids used in internal combustion engines and ushering in a new era of specialized transmission fluids tailored for electric power trains.

Transmission Fluids Market Estimated Value (2018) US$ 6.1 billion
Transmission Fluids Market Estimated Value (2022) US$ 7.6 billion
Transmission Fluids Market Value CAGR (2018 to 2022) 5.6%

Sustainability concerns and regulatory pressures are driving the development of eco-friendly transmission fluid formulations, emphasizing biodegradability and reduced carbon footprints.

As the global market expands, particularly in emerging markets like China and India, the industry is poised for consolidation and increased collaboration among key players and stakeholders to navigate the evolving landscape effectively.

Challenges such as supply chain disruptions and regulatory complexities persist but also present opportunities for innovation and agility in response to market shifts. The 2023 to 2033 period represents a pivotal market decade characterized by adaptability, innovation, and sustainability in the face of electrified mobility trends.

Rapid Growth of the Electric Vehicle to Stimulate the Expansion of the Transmission Fluids Industry

  • The rapid expansion of the electric vehicle (EV) market worldwide is reshaping the transmission fluids landscape. While traditional internal combustion engine (ICE) vehicles require transmission fluids, EVs often use alternative lubrication technologies or may have reduced transmission fluid needs. However, specialized transmission fluids designed for EVs, such as those used in electric power trains, are becoming increasingly relevant, creating a new market segment within the transmission fluids industry.
  • The growth of the commercial vehicle market in emerging economies, including Brazil and Southeast Asian nations, presents another lucrative opportunity for the transmission fluids market. These regions' transportation and logistics sectors are experiencing robust growth, leading to a higher demand for commercial vehicles and, consequently, transmission fluids for maintenance and operations.
  • Collaborations and partnerships between transmission fluid manufacturers, automakers, and technology providers are becoming more prevalent. These collaborations aim to develop transmission fluids tailored to the unique requirements of modern vehicles, whether they are traditional ICE vehicles, hybrids, or fully electric models, reflecting the industry's commitment to innovation and performance optimization.
  • Despite the growth opportunities, the transmission fluids market faces challenges such as supply chain disruptions, fluctuating raw material prices, and the complexity of adapting to evolving regulatory standards. However, these challenges also prompt market players to innovate, streamline operations, and ensure resilience in the face of market fluctuations and uncertainties.
Nikhil Kaitwade
Nikhil Kaitwade

Principal Consultant

Talk to Analyst

Find your sweet spots for generating winning opportunities in this market.

Stability of the Passenger Car Market in Developed Nations May Damp Transmission Fluid Demand

  • Stable passenger car markets in developed countries are presenting a challenge to the transmission fluids market, as they can result in a consistent, rather than growing, demand for transmission fluids in these regions.
  • The established passenger car market in developed nations is characterized by a high level of market saturation and longer vehicle lifecycles, which can lead to reduced transmission fluid consumption compared to emerging markets.
  • While stable markets in developed countries offer reliability, they can hinder substantial growth opportunities for transmission fluid manufacturers and suppliers, as they must primarily focus on replacement and maintenance demand rather than rapid expansion.
  • To mitigate this challenge, transmission fluid industry stakeholders may need to explore diversification into specialized products for electric vehicles (EVs) and hybrid vehicles, which are increasingly gaining market share in developed regions and have distinct transmission fluid requirements.
  • Market saturation in developed countries can lead to increased competition among transmission fluid manufacturers, driving the need for product differentiation, innovation, and cost-efficiency to maintain market share.
  • Despite the challenges posed by stable passenger car markets, the aftermarket segment remains a crucial revenue source for transmission fluid providers in developed countries, as older vehicles require regular fluid replacement and maintenance.
  • Manufacturers can also explore opportunities to educate consumers and service centers on the benefits of using high-quality transmission fluids, emphasizing improved performance, fuel efficiency, and extended transmission life, which could potentially stimulate demand even in stable markets.
  • As vehicle technologies evolve, transmission fluid providers in developed countries may diversify into niche markets, such as high-performance sports cars and luxury vehicles, where specialized transmission fluids are in demand to meet specific performance requirements.

Country-wise Insights

The below highlights the market growth by key countries. China is the leader in the market, with an absolute dollar growth of US$ 784.8 million. The next leading market is the United States, with a CAGR of 4.0% through 2033, followed by Japan. FMI estimates that Asia Pacific represents an overwhelming regional opportunity due to the emerging countries in automotive, such as India.

China is likely to be at the Forefront of the Global Transmission Fluids Industry

The forecast period is expected to witness China's hegemony in the transmission fluids industry, with an anticipated market share of US$ 2.4 billion by 2033, advancing at 4% CAGR from 2023 to 2033.

China Market Size for 2033 US$ 2.4 billion
CAGR (2023 to 2033) 4.0%

China is also home to leading transmission fluid producers, including BASF SE, Chevron Corporation, Exxon Mobil Corporation, Royal Dutch Shell, and BP PLC. Currently securing the first market position in terms of growth, this standing is anticipated to continue in the foreseeable future.

In April 2019, the Chinese government invested around US$ 73 billion in critical transportation projects, including railways, highways, waterways, airports, and urban rail, further stimulating the demand for transmission fluid in the region.

A Surge in Automotive Industries is Driving the India Transmission Fluid Market

The market share of transmission fluid in India is expected to reach US$ 1.9 billion by 2033. Growing demand for transmission fluid in the automotive sector and its increasing use in industrial machinery is projected to be a key driver of this trend.

India Market Size for 2033 US$ 1.9 billion
CAGR (2023 to 2033) 3.0%

The ‘ Make in India’ initiative played a key role in the success of the automotive industry in the country. For instance, in 2021, Power Grid Corporation of India Limited (POWERGRID) made it possible for Electric Vehicles Charging Stations in Meghalaya, Shillong. The project is developed under FAME (Faster Adoption and Manufacturing and Electric Vehicle).

Similarly, Toyota Motors developed and launched a hydrogen fuel cell battery electric vehicle, Toyota Mirai, in 2021. The project aims to create a green environment in the country by reducing emissions, along with a minimum refueling time.

Presence of Prominent Players in the United States to Sway the Market Outlook Positively

The United States transmission fluids market is characterized by its concentration of multinational automakers. It includes Chrysler LLC, General Motors, and Ford, which is swaying the market outlook of the country positively, thereby catalyzing the expected growth rate of 4% from 2023 to 2033.

The United States Market Size for 2033 US$ 2.2 billion
CAGR (2023 to 2033) 4.0%

The growth of the transmission fluids industry in the United States is primarily driven by developments in the automotive industry. In the United States, consistent annual growth in construction sector investment is contributing positively to the market, particularly for off-road vehicles utilized in construction.

Demand for Less Carbon Emission Control Vehicles Uplifting the Market in the United Kingdom

The United Kingdom transmission fluids market is expected to grow by 3.8% from 2023 to 2033. A shift in consumer preference from manual to automatic transmission vehicles (ATVs) is expected to boost the country's demand for automatic transmission fluids (ATF).

The United Kingdom Market Size for 2033 US$ 424.9 million
CAGR (2023 to 2033) 3.8%

ATVs offer advantages such as ease of operation, improved fuel efficiency, and reduced emissions compared to traditional manual transmission vehicles. The key players in the United Kingdom driving the market's growth include Royal Dutch Shell Plc, Exol Lubricants Limited, and BP Plc, among others.

In January 2022, TotalEnergies, a global player in the lubricants market, and NEXUS, an expert in heavy-duty parts distribution, extended their five-year strategic partnership. As per the partnership, TotalEnergies expanded its presence in booming regions, trading with more than 170 global distributors.

Emerging Need for Transmission Fluid in Electric Vehicles is Accelerating the Market in Japan

The market in Japan recorded a valuation of US$ 768.2 million and is expected to reach US$ 2.4 billion by 2033. The market is witnessing steep growth in the country due to the automotive and heavy equipment industry.

Japan Market Size for 2033 US$ 2.4 billion
CAGR (2023 to 2033) 4.0%

Considering the strategic expansion of transmission fluid manufacturers in Japan represents an additional growth opportunity in the regional market. Furthermore, the existence of smaller players in these nations has the potential to drive revenue growth in the market in the coming years.

The lubricant market in Japan was dominated by the automotive industry in 2021, where the leading companies recorded a share of 83%. This includes Cosmo Emergy Holdings, ENEOS Corporation, Idemitsu Kosan, and others.

Get the data you need at a Fraction of the cost

Personalize your report by choosing insights you need
and save 40%!

Category-wise Insights:

The Automotive Segment to Emerge as the Prominent One in the Market by End Use

As per the transmission fluids market analysis by FMI, the automotive sub-segment is likely to emerge as the prominent one in the industry at a predicted 3.8% growth rate during the forecast period.

Top End Use Automotive
CAGR % 2018 to 2022 5.2%
CAGR % 2023 to End of Forecast(2033) 3.8%

The automotive industry represents a substantial and continuously growing consumer base for transmission fluids, with vehicles requiring regular maintenance and fluid changes.

The global shift towards electrification and the production of electric vehicles (EVs) has opened up new opportunities for specialized transmission fluids in EV power trains. Additionally, the demand for more efficient and environmentally friendly transmission fluids, driven by stringent emissions regulations and sustainability initiatives, further bolsters the automotive segment.

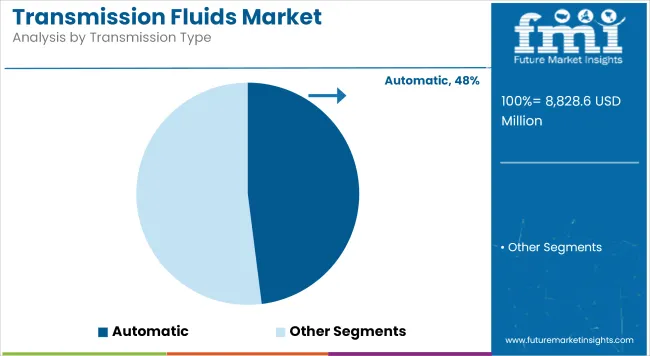
The Automatic Segment is Leading the Market in Types Category

The automatic transmission fluid segment dominates the market with a growth rate of 5.4% from 2018 to 2022. The market sensed a fall in the forecast period compared to the historical period, although the segment still decodes the strategies for growth with 4% from 2023 to 2033.

Top Type Automatic
CAGR % 2018 to 2022 5.4%
CAGR % 2023 to End of Forecast(2033) 4.0%

The transmission fluids market is segmented into automatic transmission fluid (ATF) and manual transmission fluid (MTF). The category is further segmented into dual-clutch and continuously variable transmission fluid, which falls under other segments.

The high recommendation of transmission fluids in automobile vehicles to avoid hydraulic pump wear out is driving the ATF segment. Moreover, the surge in industrial machinery in developing countries raises the demand for automatic transmission fluids.

Visionaries are Working on a New Era of Growth in Transmission Fluids

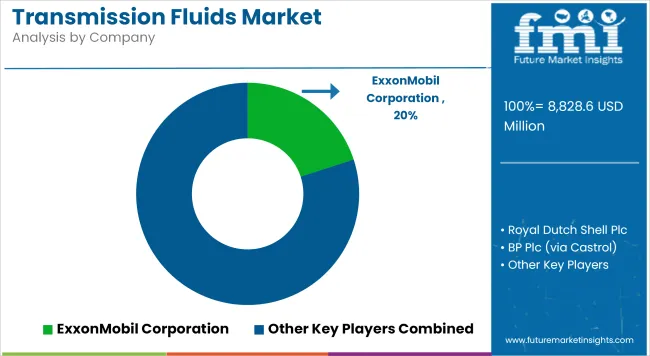
The market is characterized by a high degree of consolidation, dominated by a handful of leading multinational corporations that offer a wide array of products on a global scale.

These industry leaders possess extensive distribution networks and innovative product portfolios and are renowned for their substantial research and development efforts, allowing them to serve diverse application sectors worldwide. For example, BASF SE boasts an extensive range of innovative solutions tailored for heavy-duty vehicles, renowned for their extended maintenance intervals and enhanced fuel efficiency in the vehicles where they are applied.

The company's rigorous live product testing before market release provides it with a competitive advantage. Chevron Corporation's products are distinguished by their outstanding anti-wear properties, ensuring trouble-free, smooth transmission performance throughout the year, even under heavy loads.

Recent Developments in the Market for Transmission Fluids:

  • In December 2015, ExxonMobil successfully initiated operations at an onshore central processing facility in Indonesia's Banyu Urip field, augmenting oil production capacity by 130,000 barrels per day.
  • In March 2016, Lukoil (Russia) entered into a supply agreement with MAN Truck and Bus (Germany) for oil servicing in Slovakia, Czech Republic, and Hungary, encompassing the provision of motor oils, transmission oils, service fluids, and lubricants to MAN's subsidiaries and maintenance centers.

Key Players:

  • Afton Chemical Corporation
  • Amsoil, Inc.
  • BASF SE
  • BP PLC
  • Chevron Corporation
  • Evonik Industries AG
  • Exxon Mobil Corporation
  • Fuchs Petrolub SE

Segmentation Analysis

By Type:

  • Automatic
  • Manual
  • Other Types

By End Use:

  • Automotive
  • Off-Road Vehicles

Frequently Asked Questions

What is the Projected Global Transmission Fluids Market Value?

The projected market value is estimated to reach US$ 12.0 billion by 2033.

What is the United Kingdom Transmission Fluids Industry Outlook?

The industry in the United Kingdom is expected to advance at a CAGR of 3.8% till 2033.

At What Rate Is the Transmission Fluids Industry Expected to Grow in Japan?

During the forecast period, the industry in Japan is anticipated to grow at a rate of 4.0%.

What was the Historical Size of the Transmission Fluids Market?

The market size of the transmission fluids was US$ 6.1 billion in 2018.

Which Segment is Projected to Lead the Transmission Fluids Market Based on End Use?

The automotive segment is projected to lead the market for transmission fluids.

Table of Content
1. Executive Summary
    1.1. Global Market Outlook
    1.2. Demand-side Trends
    1.3. Supply-side Trends
    1.4. Technology Roadmap Analysis
    1.5. Analysis and Recommendations
2. Market Overview
    2.1. Market Coverage / Taxonomy
    2.2. Market Definition / Scope / Limitations
3. Market Background
    3.1. Market Dynamics
        3.1.1. Drivers
        3.1.2. Restraints
        3.1.3. Opportunity
        3.1.4. Trends
    3.2. Scenario Forecast
        3.2.1. Demand in Optimistic Scenario
        3.2.2. Demand in Likely Scenario
        3.2.3. Demand in Conservative Scenario
    3.3. Opportunity Map Analysis
    3.4. Product Life Cycle Analysis
    3.5. Supply Chain Analysis
        3.5.1. Supply Side Participants and their Roles
            3.5.1.1. Producers
            3.5.1.2. Mid-Level Participants (Traders/ Agents/ Brokers)
            3.5.1.3. Wholesalers and Distributors
        3.5.2. Value Added and Value Created at Node in the Supply Chain
        3.5.3. List of Raw Material Suppliers
        3.5.4. List of Existing and Potential Buyer’s
    3.6. Investment Feasibility Matrix
    3.7. Value Chain Analysis
        3.7.1. Profit Margin Analysis
        3.7.2. Wholesalers and Distributors
        3.7.3. Retailers
    3.8. PESTLE and Porter’s Analysis
    3.9. Regulatory Landscape
        3.9.1. By Key Regions
        3.9.2. By Key Countries
    3.10. Regional Parent Market Outlook
    3.11. Production and Consumption Statistics
    3.12. Import and Export Statistics
4. Global Market Analysis 2018 to 2022 and Forecast, 2023 to 2033
    4.1. Historical Market Size Value (US$ Million) & Volume (Tons) Analysis, 2018 to 2022
    4.2. Current and Future Market Size Value (US$ Million) & Volume (Tons) Projections, 2023 to 2033
        4.2.1. Y-o-Y Growth Trend Analysis
        4.2.2. Absolute $ Opportunity Analysis
5. Global Market Analysis 2018 to 2022 and Forecast 2023 to 2033, By Type
    5.1. Introduction / Key Findings
    5.2. Historical Market Size Value (US$ Million) & Volume (Tons) Analysis By Type, 2018 to 2022
    5.3. Current and Future Market Size Value (US$ Million) & Volume (Tons) Analysis and Forecast By Type, 2023 to 2033
        5.3.1. Automatic
        5.3.2. Manual
        5.3.3. Other Types
    5.4. Y-o-Y Growth Trend Analysis By Type, 2018 to 2022
    5.5. Absolute $ Opportunity Analysis By Type, 2023 to 2033
6. Global Market Analysis 2018 to 2022 and Forecast 2023 to 2033, By End-Use
    6.1. Introduction / Key Findings
    6.2. Historical Market Size Value (US$ Million) & Volume (Tons) Analysis By End-Use, 2018 to 2022
    6.3. Current and Future Market Size Value (US$ Million) & Volume (Tons) Analysis and Forecast By End-Use, 2023 to 2033
        6.3.1. Automotive
        6.3.2. Off-Road Vehicles
    6.4. Y-o-Y Growth Trend Analysis By End-Use, 2018 to 2022
    6.5. Absolute $ Opportunity Analysis By End-Use, 2023 to 2033
7. Global Market Analysis 2018 to 2022 and Forecast 2023 to 2033, By Region
    7.1. Introduction
    7.2. Historical Market Size Value (US$ Million) & Volume (Tons) Analysis By Region, 2018 to 2022
    7.3. Current Market Size Value (US$ Million) & Volume (Tons) Analysis and Forecast By Region, 2023 to 2033
        7.3.1. North America
        7.3.2. Latin America
        7.3.3. Western Europe
        7.3.4. Eastern Europe
        7.3.5. South Asia and Pacific
        7.3.6. East Asia
        7.3.7. Middle East and Africa
    7.4. Market Attractiveness Analysis By Region
8. North America Market Analysis 2018 to 2022 and Forecast 2023 to 2033, By Country
    8.1. Historical Market Size Value (US$ Million) & Volume (Tons) Trend Analysis By Market Taxonomy, 2018 to 2022
    8.2. Market Size Value (US$ Million) & Volume (Tons) Forecast By Market Taxonomy, 2023 to 2033
        8.2.1. By Country
            8.2.1.1. U.S.
            8.2.1.2. Canada
        8.2.2. By Type
        8.2.3. By End-Use
    8.3. Market Attractiveness Analysis
        8.3.1. By Country
        8.3.2. By Type
        8.3.3. By End-Use
    8.4. Key Takeaways
9. Latin America Market Analysis 2018 to 2022 and Forecast 2023 to 2033, By Country
    9.1. Historical Market Size Value (US$ Million) & Volume (Tons) Trend Analysis By Market Taxonomy, 2018 to 2022
    9.2. Market Size Value (US$ Million) & Volume (Tons) Forecast By Market Taxonomy, 2023 to 2033
        9.2.1. By Country
            9.2.1.1. Brazil
            9.2.1.2. Mexico
            9.2.1.3. Rest of Latin America
        9.2.2. By Type
        9.2.3. By End-Use
    9.3. Market Attractiveness Analysis
        9.3.1. By Country
        9.3.2. By Type
        9.3.3. By End-Use
    9.4. Key Takeaways
10. Western Europe Market Analysis 2018 to 2022 and Forecast 2023 to 2033, By Country
    10.1. Historical Market Size Value (US$ Million) & Volume (Tons) Trend Analysis By Market Taxonomy, 2018 to 2022
    10.2. Market Size Value (US$ Million) & Volume (Tons) Forecast By Market Taxonomy, 2023 to 2033
        10.2.1. By Country
            10.2.1.1. Germany
            10.2.1.2. U.K.
            10.2.1.3. France
            10.2.1.4. Spain
            10.2.1.5. Italy
            10.2.1.6. Rest of Western Europe
        10.2.2. By Type
        10.2.3. By End-Use
    10.3. Market Attractiveness Analysis
        10.3.1. By Country
        10.3.2. By Type
        10.3.3. By End-Use
    10.4. Key Takeaways
11. Eastern Europe Market Analysis 2018 to 2022 and Forecast 2023 to 2033, By Country
    11.1. Historical Market Size Value (US$ Million) & Volume (Tons) Trend Analysis By Market Taxonomy, 2018 to 2022
    11.2. Market Size Value (US$ Million) & Volume (Tons) Forecast By Market Taxonomy, 2023 to 2033
        11.2.1. By Country
            11.2.1.1. Poland
            11.2.1.2. Russia
            11.2.1.3. Czech Republic
            11.2.1.4. Romania
            11.2.1.5. Rest of Eastern Europe
        11.2.2. By Type
        11.2.3. By End-Use
    11.3. Market Attractiveness Analysis
        11.3.1. By Country
        11.3.2. By Type
        11.3.3. By End-Use
    11.4. Key Takeaways
12. South Asia and Pacific Market Analysis 2018 to 2022 and Forecast 2023 to 2033, By Country
    12.1. Historical Market Size Value (US$ Million) & Volume (Tons) Trend Analysis By Market Taxonomy, 2018 to 2022
    12.2. Market Size Value (US$ Million) & Volume (Tons) Forecast By Market Taxonomy, 2023 to 2033
        12.2.1. By Country
            12.2.1.1. India
            12.2.1.2. Bangladesh
            12.2.1.3. Australia
            12.2.1.4. New Zealand
            12.2.1.5. Rest of South Asia and Pacific
        12.2.2. By Type
        12.2.3. By End-Use
    12.3. Market Attractiveness Analysis
        12.3.1. By Country
        12.3.2. By Type
        12.3.3. By End-Use
    12.4. Key Takeaways
13. East Asia Market Analysis 2018 to 2022 and Forecast 2023 to 2033, By Country
    13.1. Historical Market Size Value (US$ Million) & Volume (Tons) Trend Analysis By Market Taxonomy, 2018 to 2022
    13.2. Market Size Value (US$ Million) & Volume (Tons) Forecast By Market Taxonomy, 2023 to 2033
        13.2.1. By Country
            13.2.1.1. China
            13.2.1.2. Japan
            13.2.1.3. South Korea
        13.2.2. By Type
        13.2.3. By End-Use
    13.3. Market Attractiveness Analysis
        13.3.1. By Country
        13.3.2. By Type
        13.3.3. By End-Use
    13.4. Key Takeaways
14. Middle East and Africa Market Analysis 2018 to 2022 and Forecast 2023 to 2033, By Country
    14.1. Historical Market Size Value (US$ Million) & Volume (Tons) Trend Analysis By Market Taxonomy, 2018 to 2022
    14.2. Market Size Value (US$ Million) & Volume (Tons) Forecast By Market Taxonomy, 2023 to 2033
        14.2.1. By Country
            14.2.1.1. GCC Countries
            14.2.1.2. South Africa
            14.2.1.3. Israel
            14.2.1.4. Rest of MEA
        14.2.2. By Type
        14.2.3. By End-Use
    14.3. Market Attractiveness Analysis
        14.3.1. By Country
        14.3.2. By Type
        14.3.3. By End-Use
    14.4. Key Takeaways
15. Key Countries Market Analysis
    15.1. U.S.
        15.1.1. Pricing Analysis
        15.1.2. Market Share Analysis, 2022
            15.1.2.1. By Type
            15.1.2.2. By End-Use
    15.2. Canada
        15.2.1. Pricing Analysis
        15.2.2. Market Share Analysis, 2022
            15.2.2.1. By Type
            15.2.2.2. By End-Use
    15.3. Brazil
        15.3.1. Pricing Analysis
        15.3.2. Market Share Analysis, 2022
            15.3.2.1. By Type
            15.3.2.2. By End-Use
    15.4. Mexico
        15.4.1. Pricing Analysis
        15.4.2. Market Share Analysis, 2022
            15.4.2.1. By Type
            15.4.2.2. By End-Use
    15.5. Germany
        15.5.1. Pricing Analysis
        15.5.2. Market Share Analysis, 2022
            15.5.2.1. By Type
            15.5.2.2. By End-Use
    15.6. U.K.
        15.6.1. Pricing Analysis
        15.6.2. Market Share Analysis, 2022
            15.6.2.1. By Type
            15.6.2.2. By End-Use
    15.7. France
        15.7.1. Pricing Analysis
        15.7.2. Market Share Analysis, 2022
            15.7.2.1. By Type
            15.7.2.2. By End-Use
    15.8. Spain
        15.8.1. Pricing Analysis
        15.8.2. Market Share Analysis, 2022
            15.8.2.1. By Type
            15.8.2.2. By End-Use
    15.9. Italy
        15.9.1. Pricing Analysis
        15.9.2. Market Share Analysis, 2022
            15.9.2.1. By Type
            15.9.2.2. By End-Use
    15.10. Poland
        15.10.1. Pricing Analysis
        15.10.2. Market Share Analysis, 2022
            15.10.2.1. By Type
            15.10.2.2. By End-Use
    15.11. Russia
        15.11.1. Pricing Analysis
        15.11.2. Market Share Analysis, 2022
            15.11.2.1. By Type
            15.11.2.2. By End-Use
    15.12. Czech Republic
        15.12.1. Pricing Analysis
        15.12.2. Market Share Analysis, 2022
            15.12.2.1. By Type
            15.12.2.2. By End-Use
    15.13. Romania
        15.13.1. Pricing Analysis
        15.13.2. Market Share Analysis, 2022
            15.13.2.1. By Type
            15.13.2.2. By End-Use
    15.14. India
        15.14.1. Pricing Analysis
        15.14.2. Market Share Analysis, 2022
            15.14.2.1. By Type
            15.14.2.2. By End-Use
    15.15. Bangladesh
        15.15.1. Pricing Analysis
        15.15.2. Market Share Analysis, 2022
            15.15.2.1. By Type
            15.15.2.2. By End-Use
    15.16. Australia
        15.16.1. Pricing Analysis
        15.16.2. Market Share Analysis, 2022
            15.16.2.1. By Type
            15.16.2.2. By End-Use
    15.17. New Zealand
        15.17.1. Pricing Analysis
        15.17.2. Market Share Analysis, 2022
            15.17.2.1. By Type
            15.17.2.2. By End-Use
    15.18. China
        15.18.1. Pricing Analysis
        15.18.2. Market Share Analysis, 2022
            15.18.2.1. By Type
            15.18.2.2. By End-Use
    15.19. Japan
        15.19.1. Pricing Analysis
        15.19.2. Market Share Analysis, 2022
            15.19.2.1. By Type
            15.19.2.2. By End-Use
    15.20. South Korea
        15.20.1. Pricing Analysis
        15.20.2. Market Share Analysis, 2022
            15.20.2.1. By Type
            15.20.2.2. By End-Use
    15.21. GCC Countries
        15.21.1. Pricing Analysis
        15.21.2. Market Share Analysis, 2022
            15.21.2.1. By Type
            15.21.2.2. By End-Use
    15.22. South Africa
        15.22.1. Pricing Analysis
        15.22.2. Market Share Analysis, 2022
            15.22.2.1. By Type
            15.22.2.2. By End-Use
    15.23. Israel
        15.23.1. Pricing Analysis
        15.23.2. Market Share Analysis, 2022
            15.23.2.1. By Type
            15.23.2.2. By End-Use
16. Market Structure Analysis
    16.1. Competition Dashboard
    16.2. Competition Benchmarking
    16.3. Market Share Analysis of Top Players
        16.3.1. By Regional
        16.3.2. By Type
        16.3.3. By End-Use
17. Competition Analysis
    17.1. Competition Deep Dive
        17.1.1. Afton Chemical Corporation
            17.1.1.1. Overview
            17.1.1.2. Product Portfolio
            17.1.1.3. Profitability by Market Segments
            17.1.1.4. Sales Footprint
            17.1.1.5. Strategy Overview
                17.1.1.5.1. Marketing Strategy
                17.1.1.5.2. Product Strategy
                17.1.1.5.3. Channel Strategy
        17.1.2. Amsoil, Inc.
            17.1.2.1. Overview
            17.1.2.2. Product Portfolio
            17.1.2.3. Profitability by Market Segments
            17.1.2.4. Sales Footprint
            17.1.2.5. Strategy Overview
                17.1.2.5.1. Marketing Strategy
                17.1.2.5.2. Product Strategy
                17.1.2.5.3. Channel Strategy
        17.1.3. BASF SE
            17.1.3.1. Overview
            17.1.3.2. Product Portfolio
            17.1.3.3. Profitability by Market Segments
            17.1.3.4. Sales Footprint
            17.1.3.5. Strategy Overview
                17.1.3.5.1. Marketing Strategy
                17.1.3.5.2. Product Strategy
                17.1.3.5.3. Channel Strategy
        17.1.4. BP PLC
            17.1.4.1. Overview
            17.1.4.2. Product Portfolio
            17.1.4.3. Profitability by Market Segments
            17.1.4.4. Sales Footprint
            17.1.4.5. Strategy Overview
                17.1.4.5.1. Marketing Strategy
                17.1.4.5.2. Product Strategy
                17.1.4.5.3. Channel Strategy
        17.1.5. Chevron Corporation
            17.1.5.1. Overview
            17.1.5.2. Product Portfolio
            17.1.5.3. Profitability by Market Segments
            17.1.5.4. Sales Footprint
            17.1.5.5. Strategy Overview
                17.1.5.5.1. Marketing Strategy
                17.1.5.5.2. Product Strategy
                17.1.5.5.3. Channel Strategy
        17.1.6. Evonik Industries AG
            17.1.6.1. Overview
            17.1.6.2. Product Portfolio
            17.1.6.3. Profitability by Market Segments
            17.1.6.4. Sales Footprint
            17.1.6.5. Strategy Overview
                17.1.6.5.1. Marketing Strategy
                17.1.6.5.2. Product Strategy
                17.1.6.5.3. Channel Strategy
        17.1.7. Exxon Mobil Corporation
            17.1.7.1. Overview
            17.1.7.2. Product Portfolio
            17.1.7.3. Profitability by Market Segments
            17.1.7.4. Sales Footprint
            17.1.7.5. Strategy Overview
                17.1.7.5.1. Marketing Strategy
                17.1.7.5.2. Product Strategy
                17.1.7.5.3. Channel Strategy
        17.1.8. Fuchs Petrolub SE
            17.1.8.1. Overview
            17.1.8.2. Product Portfolio
            17.1.8.3. Profitability by Market Segments
            17.1.8.4. Sales Footprint
            17.1.8.5. Strategy Overview
                17.1.8.5.1. Marketing Strategy
                17.1.8.5.2. Product Strategy
                17.1.8.5.3. Channel Strategy
        17.1.9. Gulf Oil Corporation Ltd.
            17.1.9.1. Overview
            17.1.9.2. Product Portfolio
            17.1.9.3. Profitability by Market Segments
            17.1.9.4. Sales Footprint
            17.1.9.5. Strategy Overview
                17.1.9.5.1. Marketing Strategy
                17.1.9.5.2. Product Strategy
                17.1.9.5.3. Channel Strategy
        17.1.10. Millers Oils Ltd.
            17.1.10.1. Overview
            17.1.10.2. Product Portfolio
            17.1.10.3. Profitability by Market Segments
            17.1.10.4. Sales Footprint
            17.1.10.5. Strategy Overview
                17.1.10.5.1. Marketing Strategy
                17.1.10.5.2. Product Strategy
                17.1.10.5.3. Channel Strategy
        17.1.11. Pennzoil
            17.1.11.1. Overview
            17.1.11.2. Product Portfolio
            17.1.11.3. Profitability by Market Segments
            17.1.11.4. Sales Footprint
            17.1.11.5. Strategy Overview
                17.1.11.5.1. Marketing Strategy
                17.1.11.5.2. Product Strategy
                17.1.11.5.3. Channel Strategy
        17.1.12. PetroChina Company Limited
            17.1.12.1. Overview
            17.1.12.2. Product Portfolio
            17.1.12.3. Profitability by Market Segments
            17.1.12.4. Sales Footprint
            17.1.12.5. Strategy Overview
                17.1.12.5.1. Marketing Strategy
                17.1.12.5.2. Product Strategy
                17.1.12.5.3. Channel Strategy
        17.1.13. Petroliam Nasional Berhad (PETRONAS)
            17.1.13.1. Overview
            17.1.13.2. Product Portfolio
            17.1.13.3. Profitability by Market Segments
            17.1.13.4. Sales Footprint
            17.1.13.5. Strategy Overview
                17.1.13.5.1. Marketing Strategy
                17.1.13.5.2. Product Strategy
                17.1.13.5.3. Channel Strategy
        17.1.14. Royal Dutch Shell PLC
            17.1.14.1. Overview
            17.1.14.2. Product Portfolio
            17.1.14.3. Profitability by Market Segments
            17.1.14.4. Sales Footprint
            17.1.14.5. Strategy Overview
                17.1.14.5.1. Marketing Strategy
                17.1.14.5.2. Product Strategy
                17.1.14.5.3. Channel Strategy
        17.1.15. SINOPEC Group
            17.1.15.1. Overview
            17.1.15.2. Product Portfolio
            17.1.15.3. Profitability by Market Segments
            17.1.15.4. Sales Footprint
            17.1.15.5. Strategy Overview
                17.1.15.5.1. Marketing Strategy
                17.1.15.5.2. Product Strategy
                17.1.15.5.3. Channel Strategy
        17.1.16. The Lubrizol Corporation
            17.1.16.1. Overview
            17.1.16.2. Product Portfolio
            17.1.16.3. Profitability by Market Segments
            17.1.16.4. Sales Footprint
            17.1.16.5. Strategy Overview
                17.1.16.5.1. Marketing Strategy
                17.1.16.5.2. Product Strategy
                17.1.16.5.3. Channel Strategy
        17.1.17. Total SA
            17.1.17.1. Overview
            17.1.17.2. Product Portfolio
            17.1.17.3. Profitability by Market Segments
            17.1.17.4. Sales Footprint
            17.1.17.5. Strategy Overview
                17.1.17.5.1. Marketing Strategy
                17.1.17.5.2. Product Strategy
                17.1.17.5.3. Channel Strategy
18. Assumptions & Acronyms Used
19. Research Methodology
Recommendations

Chemicals & Materials

Industrial Lubricant Market

October 2024

REP-GB-1010

306 pages

Automotive

Automotive Repair & Maintenance Services Market

June 2023

REP-GB-5335

287 pages

Explore Chemicals & Materials Insights

View Reports
Future Market Insights

Transmission Fluid Market

Schedule a Call