Reports

- Global Locations -

Headquarters

Future Market Insights, Inc.

Christiana Corporate, 200
Continental Drive, Suite 401,
Newark, Delaware - 19713,
United States

T: +1-347-918-3531

Americas

Future Market Insights, Inc.

616 Corporate Way, Suite 2-9018,
Valley Cottage, NY 10989, United States

MEA

Future Market Insights

1602-6 Jumeirah Bay X2 Tower, Plot No: JLT-PH2-X2A,
Jumeirah Lakes Towers, Dubai,
United Arab Emirates

Europe

Future Market Insights

3rd Floor, 207 Regent Street,
W1B 3HH London
United Kingdom

T: + 44 (0) 20 8123 9659

Asia Pacific

Future Market Insights

IndiaLand Global Tech Park, Unit UG-1, Behind Grand HighStreet, Phase 1, Hinjawadi, MH, Pune – 411057, India

Offshore Wind Market Outlook from 2024 to 2034

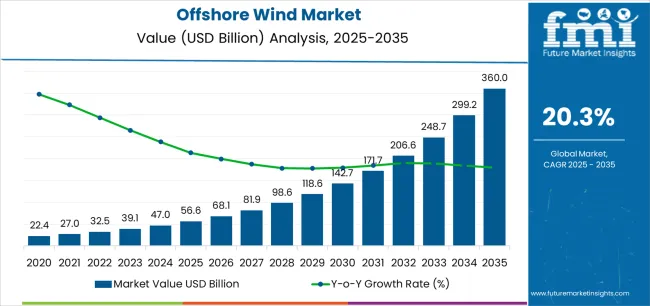
The offshore wind market is projected to grow at a CAGR of 21.4% from 2024 to 2034. The market is expected to rise from US$ 46.6 billion in 2024 to US$ 325 billion by 2034.

Offshore Wind Market Size, Analysis, Insights

The offshore wind sector is rapidly expanding globally as governments transition to greener energy sources. This growth is driven by initiatives to reduce carbon emissions and achieve environmental goals. Advancements in offshore wind turbine technology and reduced costs make it more competitive with traditional energy sources.

The industry faces limitations such as lengthy and expensive permitting processes and significant infrastructure expenditure. Innovation and collaboration among industry stakeholders are addressing these issues, positioning the offshore wind industry to play a critical role in addressing global energy demands.

Attributes Details
Offshore Wind Market Size, 2024 US$ 46.6 billion
Projected Market Size, 2034 US$ 325 billion
Value-based CAGR(2024to 2034) 21.4%

Don't pay for what you don't need

Customize your report by selecting specific countries or regions and save 30%!

Offshore Wind Market Trends

  • Offshore wind projects are expanding in size and capacity, with developers deploying larger turbines and wind farms with higher total megawatt capacities.
  • Technological advancements, such as larger rotor diameters and taller towers, contribute to increased energy generation and efficiency.
  • Cost reductions in the offshore wind sector have made it more competitive with conventional energy sources, attracting investment and driving deployment.
  • Offshore wind development is expanding beyond traditional markets, with increasing interest and investments in regions like the United States, Asia-Pacific, and emerging markets.
  • Governments and policymakers are setting ambitious offshore wind targets to support renewable energy transition and stimulate economic growth.
  • Technological innovation focuses on enhancing the efficiency, reliability, and sustainability of offshore wind projects, with advancements in floating wind turbine technology, enabling the harnessing of wind resources in deeper waters.
  • Investments in grid infrastructure and transmission networks are being addressed to accommodate the growing capacity of offshore wind projects.
  • Supportive regulatory frameworks, such as feed-in tariffs, auctions, and renewable energy targets, drive offshore wind deployment and investment.
  • The offshore wind industry is stimulating the growth of a robust supply chain, creating opportunities for manufacturers, suppliers, and service providers.
  • Environmental sustainability and social responsibility are integral aspects of offshore wind development, with stakeholders emphasizing the importance of minimizing environmental impacts and engaging local communities.

Dynamics of the Offshore Wind Market

  • Offshore wind projects are being developed in various regions globally. The industry is experiencing technological advancements such as larger turbines, floating offshore wind platforms, and improved installation and maintenance techniques, which are driving down costs and expanding the geographical reach of offshore wind development.
  • The offshore wind supply chain comprises various segments, including turbine manufacturers, project developers, engineering firms, vessel operators, and maintenance service providers.
  • The offshore wind market is characterized by a mix of established and new entrants, including energy companies, utilities, independent power producers, and financial investors.
  • Government policies, incentives, and regulations significantly shape the market, with supportive frameworks like feed-in tariffs, renewable energy targets, and carbon pricing mechanisms driving investment in offshore wind projects.
  • Offshore wind projects must navigate environmental and regulatory challenges, including wildlife conservation, marine habitat protection, and stakeholder engagement.
  • Cost and financing for offshore wind projects have been steadily declining due to technological advancements, economies of scale, and increased competition.
  • Financing structures vary depending on project size, location, and market conditions, With a mix of debt, equity, and government subsidies often used to fund development.
  • Integration with existing electricity grids presents technical and logistical challenges, including grid stability, transmission infrastructure, and interconnection capacity.
  • Grid modernization and investment in smart grid technologies are essential for maximizing the value of offshore wind energy.
  • The offshore wind market is poised for continued growth and expansion in the coming years, driven by the global transition to clean energy and the need to mitigate climate change.
Nikhil Kaitwade
Nikhil Kaitwade

Principal Consultant

Talk to Analyst

Find your sweet spots for generating winning opportunities in this market.

Potential For Offshore Energy Generation

  • Offshore wind companies are expanding as people observe the potential for wind energy resources in offshore places.
  • Offshore wind farms have higher, more constant wind speeds, making them more efficient for energy generation.
  • Set closer to important urban areas, decreasing transmission losses and land limitations, the market also seeks to show scalability and cost-effectiveness.
  • Advancements in technology, such as bigger turbines and unique floating platforms, have made offshore wind projects competitive with traditional energy sources.

Comparative View of Adjacent Markets

The analysis includes a comprehensive examination of the wind turbine gear oil market and the wind powder coating market in addition to the offshore wind market.

Offshore Wind Market:

Attributes Offshore Wind Market
Value-based CAGR (2024 to 2034) 21.4%
Market Trends The offshore wind market is undergoing significant growth, driven by technological advancements, cost reduction, market penetration, and increased global collaboration to accelerate the sustainable energy transition.
Growth Opportunities The offshore wind markets are thriving due to increased global demand, advanced technology, favorable regulatory conditions, and increased investment, fostering unprecedented development and innovation.

Wind Turbine Gear Oil Market:

Attributes Wind Turbine Gear Oil Market
Value-based CAGR (2024 to 2034) 6.8%
Market Trends The use of nanotechnology in gear oil formulations is being explored to enhance lubrication properties and boost wind turbine efficiency.
Growth Opportunities The demand for eco-friendly and high-performance gear oils to support the growth of wind energy installations is on the rise.

Wind Powder Coating Market:

Attributes Wind Powder Coating Market
Value-based CAGR (2024 to 2034) 10.8%
Market Trends The wind powder coating market is experiencing steady growth due to the growing demand for durable, eco-friendly coating solutions in wind turbine manufacturing and maintenance.
Growth Opportunities The wind powder coating market is poised to capitalize on the growing global demand for high-performance, corrosion-resistant coatings to enhance wind turbine component durability and longevity.

Get the data you need at a Fraction of the cost

Personalize your report by choosing insights you need
and save 40%!

Category-wise Insights

Advanced Technology and Sustainable Wind Resource Utilization within the Offshore Wind Industry

Attributes Details
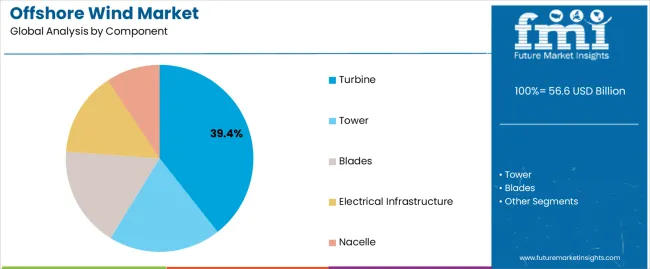
Top component Turbine
CAGR (2024 to 2034) 21.1%
  • Offshore wind turbines have significant scale and capacity, ranging from several megawatts to over ten megawatts per turbine.
  • Despite their size and scale, offshore wind turbines have a relatively low environmental impact compared to conventional energy sources.
  • They drive economic growth and job creation through manufacturing, installation, and maintenance activities associated with offshore wind projects.
  • Governments and policymakers worldwide are increasingly recognizing the importance of offshore wind energy in achieving climate and energy goals, encouraging investment in offshore wind projects, and promoting the expansion of the turbine offshore market.

Shallow Water is a Prime Energy Location

Attributes Details
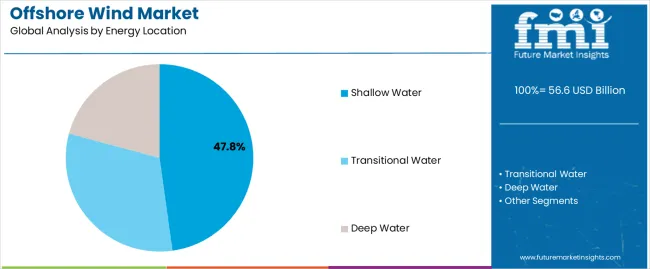
Top Energy Location Shallow Water
CAGR (2024 to 2034) 20.8%
  • Shallow water regions are ideal for offshore wind farms due to their abundant wind resources, efficient energy capture, cost-effective turbine installation, proximity to infrastructure, support for diverse marine ecosystems, reduced ecological sensitivity, enhanced economic viability, lower installation costs, higher energy yields, and reduced operational risks.
  • These regions also offer lower installation costs for offshore wind farms, higher energy outputs due to optimal wind conditions, and reduced operational risks.
  • Policy support, regulatory incentives, and strategic planning initiatives prioritize the exploration and utilization of shallow water areas, accelerating the transition toward renewable energy.
  • The favorable conditions in shallow water areas also contribute to reduced operational risks for offshore wind projects. Overall, shallow water regions offer strategic development opportunities for governments and energy stakeholders, contributing to the transition towards renewable energy.

Country-wise Insights

Countries CAGR through 2034
United States 21.8%
United Kingdom 22.8%
China 22.2%
Japan 20.1%
South Korea 24.0%

Rapid Growth in the United States Offshore Wind Market Renewable Energy Initiatives

  • States along the East Coast, including Massachusetts, New York, and New Jersey, have set ambitious renewable energy targets, including offshore wind capacity goals. These targets are enshrined in state legislation or executive orders, signaling a commitment to expanding renewable energy generation.
  • Federal and state governments have implemented favorable regulatory policies, facilitating offshore wind development through streamlined permitting processes and lease auctions. This has attracted significant investor interest, with the potential for long-term revenue streams and alignment with environmental, social, and governance principles.
  • The United States possesses abundant offshore wind resources along its Atlantic coastline, particularly in shallow waters with favorable wind speeds. Advances in turbine technology have expanded the feasible areas for offshore wind development, making the US a prime location for offshore wind deployment.
  • Major offshore wind projects, such as Vineyard Wind off Massachusetts and South Fork Wind Farm near Long Island, demonstrate the feasibility and potential of offshore wind to contribute to the nation's clean energy transition.

Significant Advancements in Renewable Energy Technologies in the United Kingdom

  • The United Kingdom has a robust offshore wind project pipeline, including the Hornsea and Dogger Bank wind farms, which are some of the world's largest installations.
  • A leader in deploying innovative offshore wind technologies, such as next-generation turbine designs, floating wind platforms, and advanced grid integration solutions.
  • Consistently supported offshore wind development through strategic policies and initiatives, such as the Offshore Wind Sector Deal, which aims to increase offshore wind capacity to 30 GW by 2030.
  • The upcoming Round 4 leasing round demonstrates the UK's proactive approach to expanding its offshore wind footprint and maintaining its leadership position in the global market.
  • The UK has also made significant investments in floating wind technology, such as the Floating Offshore Wind Centre of Excellence and the Hywind Scotland project, to access deeper waters and expand offshore wind deployment areas.

China's Dominance in the Offshore Wind Market

  • China leads the world in offshore wind capacity, with its vast coastline, shallow waters, and favorable wind conditions providing ample opportunities for large-scale installations.
  • The country has made strategic investments in offshore wind infrastructure, manufacturing capabilities, and technology innovation, aiming to accelerate the deployment of offshore wind capacity and support the country's energy transition goals.
  • The country's growing dominance in the offshore wind market extends beyond its borders, with Chinese companies participating in international projects and collaborations.

Expansion of the Market in Japan Due to Various Factors Reshaping the Country's Energy Landscape

  • Japan has implemented regulatory reforms to promote offshore wind development and streamline project approval processes.
  • These changes include simplifying permitting procedures, facilitating grid connection, and providing financial incentives for renewable energy projects.
  • Japan is also fostering industry partnerships between government entities, industry players, and international partners to drive innovation and capacity expansion in the offshore wind sector.
  • Offshore wind is increasingly recognized as a key source of energy security and climate change mitigation. Japan is promoting both fixed-bottom and floating offshore wind technologies to harness its diverse marine environments.
  • The government has set ambitious targets for offshore wind capacity deployment, aiming to install 10 gigawatts (GW) of capacity and 30-45 GW.
  • Strategic investments in infrastructure, research and development, and project financing support these targets and position Japan as a prominent player in the Asia-Pacific offshore wind market.

Ambitious Targets Drive Momentum in the Offshore Wind Market in South Korea

  • The South Korean government has shown strong support for offshore wind development as part of its renewable energy transition strategy.
  • The government has set ambitious targets for offshore wind capacity expansion, with renewable energy.
  • This ambitious target drives momentum in the offshore wind market, promoting investments, project developments, and technology innovation.
  • Strategic investments in technology and infrastructure, such as domestic manufacturing capabilities, port infrastructure, and R&D initiatives, are also being prioritized. South Korea is also developing a robust domestic manufacturing and supply chain ecosystem to support its offshore wind ambitions.
  • This includes fostering partnerships between industry players, research institutions, and government agencies to localize production, reduce project costs, and enhance project resilience.
  • South Korea is also fostering a culture of technological innovation and collaboration to drive advancements in offshore wind technology and deployment practices.

Comparative Landscape

The offshore wind market's maturity and growth potential are analyzed by examining offshore wind farms' installed capacity and deployment rates in different regions. Comparing the policy and regulatory frameworks governing offshore wind development helps understand government support, incentives, and barriers to entry. Technological advancements and innovation initiatives reveal trends in turbine design, foundation types, and installation techniques.

Market participants and industry players provide insights into market dynamics, competition, and collaboration. Resource potential and environmental considerations help identify favorable offshore wind sites and potential challenges for development. Investment trends, financing mechanisms, and project economics reveal funding sources, risk factors, and opportunities in the offshore wind market.

Understanding grid infrastructure capabilities and integration challenges is essential for ensuring efficient transmission and integration of offshore wind energy into existing power grids.

Recent Developments

  • In October 2023, Shell and BP plan to invest heavily in offshore wind ventures, while RWE and EDF Renewables have finalized agreements for offshore wind farms, marking significant progress in renewable energy development.
  • In June 2022, Orsted and Vestas partnered on offshore wind projects, while Siemens Gamesa and EnBW have announced joint ventures to drive innovation in wind energy technology.
  • In September 2021, Equinor and BP strengthened their offshore wind partnership to accelerate renewable energy projects, while Orsted secured key contracts for offshore wind farms, solidifying its industry leadership.

Key Market Players

  • General Electric (USA)
  • Ørsted A/S (Denmark)
  • Dong Energy A/S (Denmark)
  • ABB (Switzerland)
  • Senvion SA (Luxembourg
  • Engie (France)
  • EEW GROUP (Germany)
  • Goldwind Wind Energy GmbH (China)

Key Market Segmentation

By Component:

  • Turbine
  • Tower
  • Blades
  • Electrical Infrastructure
  • Nacelle

By Energy Location:

  • Shallow Water
  • Transitional Water
  • Deep Water

By Region:

  • North America
  • Latin America
  • Asia Pacific
  • Middle East and Africa (MEA)
  • Europe

Frequently Asked Questions

How Big is the offshore wind market?

In 2024, the offshore wind market is expected to be valued at US$ 46.6 billion.

What is the Growth Rate of the Offshore Wind Market?

The market is projected to experience a CAGR of 21.4% from 2024 to 2034.

Who are the Key Players in the Offshore Wind Market?

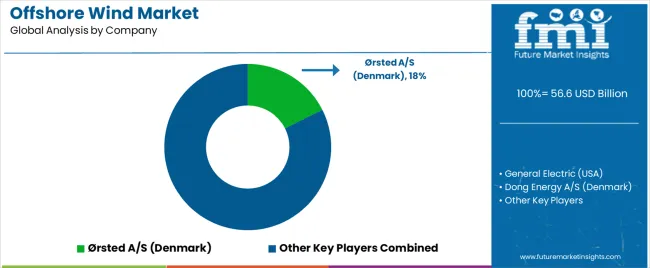
The market is dominated by key players such as Engie (France), EEW GROUP (Germany), Goldwind Wind Energy GmbH (China), and Ørsted A/S (Denmark).

Table of Content

1. Executive Summary

    1.1. Global Market Outlook

    1.2. Demand-side Trends

    1.3. Supply-side Trends

    1.4. Technology Roadmap Analysis

    1.5. Analysis and Recommendations

2. Market Overview

    2.1. Market Coverage / Taxonomy

    2.2. Market Definition / Scope / Limitations

3. Market Background

    3.1. Market Dynamics

        3.1.1. Drivers

        3.1.2. Restraints

        3.1.3. Opportunity

        3.1.4. Trends

    3.2. Scenario Forecast

        3.2.1. Demand in Optimistic Scenario

        3.2.2. Demand in Likely Scenario

        3.2.3. Demand in Conservative Scenario

    3.3. Opportunity Map Analysis

    3.4. Investment Feasibility Matrix

    3.5. PESTLE and Porter’s Analysis

    3.6. Regulatory Landscape

        3.6.1. By Key Regions

        3.6.2. By Key Countries

    3.7. Regional Parent Market Outlook

4. Global Market Analysis 2019 to 2023 and Forecast, 2024 to 2034

    4.1. Historical Market Size Value (US$ Million) Analysis, 2019 to 2023

    4.2. Current and Future Market Size Value (US$ Million) Projections, 2024 to 2034

        4.2.1. Y-o-Y Growth Trend Analysis

        4.2.2. Absolute $ Opportunity Analysis

5. Global Market Analysis 2019 to 2023 and Forecast 2024 to 2034, By Components

    5.1. Introduction / Key Findings

    5.2. Historical Market Size Value (US$ Million) Analysis By Components, 2019 to 2023

    5.3. Current and Future Market Size Value (US$ Million) Analysis and Forecast By Components, 2024 to 2034

        5.3.1. Turbine

        5.3.2. Tower

        5.3.3. Blades

        5.3.4. Electrical Infrastructure

        5.3.5. Nacelle

    5.4. Y-o-Y Growth Trend Analysis By Components, 2019 to 2023

    5.5. Absolute $ Opportunity Analysis By Components, 2024 to 2034

6. Global Market Analysis 2019 to 2023 and Forecast 2024 to 2034, By Energy Location

    6.1. Introduction / Key Findings

    6.2. Historical Market Size Value (US$ Million) Analysis By Energy Location, 2019 to 2023

    6.3. Current and Future Market Size Value (US$ Million) Analysis and Forecast By Energy Location, 2024 to 2034

        6.3.1. Shallow Water

        6.3.2. Transitional Water

        6.3.3. Deep Water

    6.4. Y-o-Y Growth Trend Analysis By Energy Location, 2019 to 2023

    6.5. Absolute $ Opportunity Analysis By Energy Location, 2024 to 2034

7. Global Market Analysis 2019 to 2023 and Forecast 2024 to 2034, By Region

    7.1. Introduction

    7.2. Historical Market Size Value (US$ Million) Analysis By Region, 2019 to 2023

    7.3. Current Market Size Value (US$ Million) Analysis and Forecast By Region, 2024 to 2034

        7.3.1. North America

        7.3.2. Latin America

        7.3.3. Western Europe

        7.3.4. Eastern Europe

        7.3.5. South Asia and Pacific

        7.3.6. East Asia

        7.3.7. Middle East and Africa

    7.4. Market Attractiveness Analysis By Region

8. North America Market Analysis 2019 to 2023 and Forecast 2024 to 2034, By Country

    8.1. Historical Market Size Value (US$ Million) Trend Analysis By Market Taxonomy, 2019 to 2023

    8.2. Market Size Value (US$ Million) Forecast By Market Taxonomy, 2024 to 2034

        8.2.1. By Country

            8.2.1.1. USA

            8.2.1.2. Canada

        8.2.2. By Components

        8.2.3. By Energy Location

    8.3. Market Attractiveness Analysis

        8.3.1. By Country

        8.3.2. By Components

        8.3.3. By Energy Location

    8.4. Key Takeaways

9. Latin America Market Analysis 2019 to 2023 and Forecast 2024 to 2034, By Country

    9.1. Historical Market Size Value (US$ Million) Trend Analysis By Market Taxonomy, 2019 to 2023

    9.2. Market Size Value (US$ Million) Forecast By Market Taxonomy, 2024 to 2034

        9.2.1. By Country

            9.2.1.1. Brazil

            9.2.1.2. Mexico

            9.2.1.3. Rest of Latin America

        9.2.2. By Components

        9.2.3. By Energy Location

    9.3. Market Attractiveness Analysis

        9.3.1. By Country

        9.3.2. By Components

        9.3.3. By Energy Location

    9.4. Key Takeaways

10. Western Europe Market Analysis 2019 to 2023 and Forecast 2024 to 2034, By Country

    10.1. Historical Market Size Value (US$ Million) Trend Analysis By Market Taxonomy, 2019 to 2023

    10.2. Market Size Value (US$ Million) Forecast By Market Taxonomy, 2024 to 2034

        10.2.1. By Country

            10.2.1.1. Germany

            10.2.1.2. UK

            10.2.1.3. France

            10.2.1.4. Spain

            10.2.1.5. Italy

            10.2.1.6. Rest of Western Europe

        10.2.2. By Components

        10.2.3. By Energy Location

    10.3. Market Attractiveness Analysis

        10.3.1. By Country

        10.3.2. By Components

        10.3.3. By Energy Location

    10.4. Key Takeaways

11. Eastern Europe Market Analysis 2019 to 2023 and Forecast 2024 to 2034, By Country

    11.1. Historical Market Size Value (US$ Million) Trend Analysis By Market Taxonomy, 2019 to 2023

    11.2. Market Size Value (US$ Million) Forecast By Market Taxonomy, 2024 to 2034

        11.2.1. By Country

            11.2.1.1. Poland

            11.2.1.2. Russia

            11.2.1.3. Czech Republic

            11.2.1.4. Romania

            11.2.1.5. Rest of Eastern Europe

        11.2.2. By Components

        11.2.3. By Energy Location

    11.3. Market Attractiveness Analysis

        11.3.1. By Country

        11.3.2. By Components

        11.3.3. By Energy Location

    11.4. Key Takeaways

12. South Asia and Pacific Market Analysis 2019 to 2023 and Forecast 2024 to 2034, By Country

    12.1. Historical Market Size Value (US$ Million) Trend Analysis By Market Taxonomy, 2019 to 2023

    12.2. Market Size Value (US$ Million) Forecast By Market Taxonomy, 2024 to 2034

        12.2.1. By Country

            12.2.1.1. India

            12.2.1.2. Bangladesh

            12.2.1.3. Australia

            12.2.1.4. New Zealand

            12.2.1.5. Rest of South Asia and Pacific

        12.2.2. By Components

        12.2.3. By Energy Location

    12.3. Market Attractiveness Analysis

        12.3.1. By Country

        12.3.2. By Components

        12.3.3. By Energy Location

    12.4. Key Takeaways

13. East Asia Market Analysis 2019 to 2023 and Forecast 2024 to 2034, By Country

    13.1. Historical Market Size Value (US$ Million) Trend Analysis By Market Taxonomy, 2019 to 2023

    13.2. Market Size Value (US$ Million) Forecast By Market Taxonomy, 2024 to 2034

        13.2.1. By Country

            13.2.1.1. China

            13.2.1.2. Japan

            13.2.1.3. South Korea

        13.2.2. By Components

        13.2.3. By Energy Location

    13.3. Market Attractiveness Analysis

        13.3.1. By Country

        13.3.2. By Components

        13.3.3. By Energy Location

    13.4. Key Takeaways

14. Middle East and Africa Market Analysis 2019 to 2023 and Forecast 2024 to 2034, By Country

    14.1. Historical Market Size Value (US$ Million) Trend Analysis By Market Taxonomy, 2019 to 2023

    14.2. Market Size Value (US$ Million) Forecast By Market Taxonomy, 2024 to 2034

        14.2.1. By Country

            14.2.1.1. GCC Countries

            14.2.1.2. South Africa

            14.2.1.3. Israel

            14.2.1.4. Rest of MEA

        14.2.2. By Components

        14.2.3. By Energy Location

    14.3. Market Attractiveness Analysis

        14.3.1. By Country

        14.3.2. By Components

        14.3.3. By Energy Location

    14.4. Key Takeaways

15. Key Countries Market Analysis

    15.1. USA

        15.1.1. Pricing Analysis

        15.1.2. Market Share Analysis, 2023

            15.1.2.1. By Components

            15.1.2.2. By Energy Location

    15.2. Canada

        15.2.1. Pricing Analysis

        15.2.2. Market Share Analysis, 2023

            15.2.2.1. By Components

            15.2.2.2. By Energy Location

    15.3. Brazil

        15.3.1. Pricing Analysis

        15.3.2. Market Share Analysis, 2023

            15.3.2.1. By Components

            15.3.2.2. By Energy Location

    15.4. Mexico

        15.4.1. Pricing Analysis

        15.4.2. Market Share Analysis, 2023

            15.4.2.1. By Components

            15.4.2.2. By Energy Location

    15.5. Germany

        15.5.1. Pricing Analysis

        15.5.2. Market Share Analysis, 2023

            15.5.2.1. By Components

            15.5.2.2. By Energy Location

    15.6. UK

        15.6.1. Pricing Analysis

        15.6.2. Market Share Analysis, 2023

            15.6.2.1. By Components

            15.6.2.2. By Energy Location

    15.7. France

        15.7.1. Pricing Analysis

        15.7.2. Market Share Analysis, 2023

            15.7.2.1. By Components

            15.7.2.2. By Energy Location

    15.8. Spain

        15.8.1. Pricing Analysis

        15.8.2. Market Share Analysis, 2023

            15.8.2.1. By Components

            15.8.2.2. By Energy Location

    15.9. Italy

        15.9.1. Pricing Analysis

        15.9.2. Market Share Analysis, 2023

            15.9.2.1. By Components

            15.9.2.2. By Energy Location

    15.10. Poland

        15.10.1. Pricing Analysis

        15.10.2. Market Share Analysis, 2023

            15.10.2.1. By Components

            15.10.2.2. By Energy Location

    15.11. Russia

        15.11.1. Pricing Analysis

        15.11.2. Market Share Analysis, 2023

            15.11.2.1. By Components

            15.11.2.2. By Energy Location

    15.12. Czech Republic

        15.12.1. Pricing Analysis

        15.12.2. Market Share Analysis, 2023

            15.12.2.1. By Components

            15.12.2.2. By Energy Location

    15.13. Romania

        15.13.1. Pricing Analysis

        15.13.2. Market Share Analysis, 2023

            15.13.2.1. By Components

            15.13.2.2. By Energy Location

    15.14. India

        15.14.1. Pricing Analysis

        15.14.2. Market Share Analysis, 2023

            15.14.2.1. By Components

            15.14.2.2. By Energy Location

    15.15. Bangladesh

        15.15.1. Pricing Analysis

        15.15.2. Market Share Analysis, 2023

            15.15.2.1. By Components

            15.15.2.2. By Energy Location

    15.16. Australia

        15.16.1. Pricing Analysis

        15.16.2. Market Share Analysis, 2023

            15.16.2.1. By Components

            15.16.2.2. By Energy Location

    15.17. New Zealand

        15.17.1. Pricing Analysis

        15.17.2. Market Share Analysis, 2023

            15.17.2.1. By Components

            15.17.2.2. By Energy Location

    15.18. China

        15.18.1. Pricing Analysis

        15.18.2. Market Share Analysis, 2023

            15.18.2.1. By Components

            15.18.2.2. By Energy Location

    15.19. Japan

        15.19.1. Pricing Analysis

        15.19.2. Market Share Analysis, 2023

            15.19.2.1. By Components

            15.19.2.2. By Energy Location

    15.20. South Korea

        15.20.1. Pricing Analysis

        15.20.2. Market Share Analysis, 2023

            15.20.2.1. By Components

            15.20.2.2. By Energy Location

    15.21. GCC Countries

        15.21.1. Pricing Analysis

        15.21.2. Market Share Analysis, 2023

            15.21.2.1. By Components

            15.21.2.2. By Energy Location

    15.22. South Africa

        15.22.1. Pricing Analysis

        15.22.2. Market Share Analysis, 2023

            15.22.2.1. By Components

            15.22.2.2. By Energy Location

    15.23. Israel

        15.23.1. Pricing Analysis

        15.23.2. Market Share Analysis, 2023

            15.23.2.1. By Components

            15.23.2.2. By Energy Location

16. Market Structure Analysis

    16.1. Competition Dashboard

    16.2. Competition Benchmarking

    16.3. Market Share Analysis of Top Players

        16.3.1. By Regional

        16.3.2. By Components

        16.3.3. By Energy Location

17. Competition Analysis

    17.1. Competition Deep Dive

        17.1.1. General Electric (USA)

            17.1.1.1. Overview

            17.1.1.2. Product Portfolio

            17.1.1.3. Profitability by Market Segments

            17.1.1.4. Sales Footprint

            17.1.1.5. Strategy Overview

                17.1.1.5.1. Marketing Strategy

        17.1.2. Siemens Gamesa Renewable Energy SA ( Germany)

            17.1.2.1. Overview

            17.1.2.2. Product Portfolio

            17.1.2.3. Profitability by Market Segments

            17.1.2.4. Sales Footprint

            17.1.2.5. Strategy Overview

                17.1.2.5.1. Marketing Strategy

        17.1.3. MHI Vestas (Denmark)

            17.1.3.1. Overview

            17.1.3.2. Product Portfolio

            17.1.3.3. Profitability by Market Segments

            17.1.3.4. Sales Footprint

            17.1.3.5. Strategy Overview

                17.1.3.5.1. Marketing Strategy

        17.1.4. Senvion SA (Luxembourg)

            17.1.4.1. Overview

            17.1.4.2. Product Portfolio

            17.1.4.3. Profitability by Market Segments

            17.1.4.4. Sales Footprint

            17.1.4.5. Strategy Overview

                17.1.4.5.1. Marketing Strategy

        17.1.5. Doosan Heavy Industries & Construction (South Korea)

            17.1.5.1. Overview

            17.1.5.2. Product Portfolio

            17.1.5.3. Profitability by Market Segments

            17.1.5.4. Sales Footprint

            17.1.5.5. Strategy Overview

                17.1.5.5.1. Marketing Strategy

        17.1.6. Suzlon Energy Limited (India)

            17.1.6.1. Overview

            17.1.6.2. Product Portfolio

            17.1.6.3. Profitability by Market Segments

            17.1.6.4. Sales Footprint

            17.1.6.5. Strategy Overview

                17.1.6.5.1. Marketing Strategy

        17.1.7. Dong Energy A/S (Denmark)

            17.1.7.1. Overview

            17.1.7.2. Product Portfolio

            17.1.7.3. Profitability by Market Segments

            17.1.7.4. Sales Footprint

            17.1.7.5. Strategy Overview

                17.1.7.5.1. Marketing Strategy

        17.1.8. EEW GROUP (Germany)

            17.1.8.1. Overview

            17.1.8.2. Product Portfolio

            17.1.8.3. Profitability by Market Segments

            17.1.8.4. Sales Footprint

            17.1.8.5. Strategy Overview

                17.1.8.5.1. Marketing Strategy

        17.1.9. ENERCON GmbH (Germany)

            17.1.9.1. Overview

            17.1.9.2. Product Portfolio

            17.1.9.3. Profitability by Market Segments

            17.1.9.4. Sales Footprint

            17.1.9.5. Strategy Overview

                17.1.9.5.1. Marketing Strategy

        17.1.10. Goldwind Wind Energy GmbH (China)

            17.1.10.1. Overview

            17.1.10.2. Product Portfolio

            17.1.10.3. Profitability by Market Segments

            17.1.10.4. Sales Footprint

            17.1.10.5. Strategy Overview

                17.1.10.5.1. Marketing Strategy

        17.1.11. ABB (Switzerland)

            17.1.11.1. Overview

            17.1.11.2. Product Portfolio

            17.1.11.3. Profitability by Market Segments

            17.1.11.4. Sales Footprint

            17.1.11.5. Strategy Overview

                17.1.11.5.1. Marketing Strategy

        17.1.12. Engie (France)

            17.1.12.1. Overview

            17.1.12.2. Product Portfolio

            17.1.12.3. Profitability by Market Segments

            17.1.12.4. Sales Footprint

            17.1.12.5. Strategy Overview

                17.1.12.5.1. Marketing Strategy

        17.1.13. Ørsted A/S (Denmark)

            17.1.13.1. Overview

            17.1.13.2. Product Portfolio

            17.1.13.3. Profitability by Market Segments

            17.1.13.4. Sales Footprint

            17.1.13.5. Strategy Overview

                17.1.13.5.1. Marketing Strategy

18. Assumptions & Acronyms Used

19. Research Methodology

List of Tables

Table 1: Global Market Value (US$ Million) Forecast by Region, 2019 to 2034

Table 2: Global Market Value (US$ Million) Forecast by Components, 2019 to 2034

Table 3: Global Market Value (US$ Million) Forecast by Energy Location, 2019 to 2034

Table 4: North America Market Value (US$ Million) Forecast by Country, 2019 to 2034

Table 5: North America Market Value (US$ Million) Forecast by Components, 2019 to 2034

Table 6: North America Market Value (US$ Million) Forecast by Energy Location, 2019 to 2034

Table 7: Latin America Market Value (US$ Million) Forecast by Country, 2019 to 2034

Table 8: Latin America Market Value (US$ Million) Forecast by Components, 2019 to 2034

Table 9: Latin America Market Value (US$ Million) Forecast by Energy Location, 2019 to 2034

Table 10: Western Europe Market Value (US$ Million) Forecast by Country, 2019 to 2034

Table 11: Western Europe Market Value (US$ Million) Forecast by Components, 2019 to 2034

Table 12: Western Europe Market Value (US$ Million) Forecast by Energy Location, 2019 to 2034

Table 13: Eastern Europe Market Value (US$ Million) Forecast by Country, 2019 to 2034

Table 14: Eastern Europe Market Value (US$ Million) Forecast by Components, 2019 to 2034

Table 15: Eastern Europe Market Value (US$ Million) Forecast by Energy Location, 2019 to 2034

Table 16: South Asia and Pacific Market Value (US$ Million) Forecast by Country, 2019 to 2034

Table 17: South Asia and Pacific Market Value (US$ Million) Forecast by Components, 2019 to 2034

Table 18: South Asia and Pacific Market Value (US$ Million) Forecast by Energy Location, 2019 to 2034

Table 19: East Asia Market Value (US$ Million) Forecast by Country, 2019 to 2034

Table 20: East Asia Market Value (US$ Million) Forecast by Components, 2019 to 2034

Table 21: East Asia Market Value (US$ Million) Forecast by Energy Location, 2019 to 2034

Table 22: Middle East and Africa Market Value (US$ Million) Forecast by Country, 2019 to 2034

Table 23: Middle East and Africa Market Value (US$ Million) Forecast by Components, 2019 to 2034

Table 24: Middle East and Africa Market Value (US$ Million) Forecast by Energy Location, 2019 to 2034

List of Charts

Figure 1: Global Market Value (US$ Million) by Components, 2024 to 2034

Figure 2: Global Market Value (US$ Million) by Energy Location, 2024 to 2034

Figure 3: Global Market Value (US$ Million) by Region, 2024 to 2034

Figure 4: Global Market Value (US$ Million) Analysis by Region, 2019 to 2034

Figure 5: Global Market Value Share (%) and BPS Analysis by Region, 2024 to 2034

Figure 6: Global Market Y-o-Y Growth (%) Projections by Region, 2024 to 2034

Figure 7: Global Market Value (US$ Million) Analysis by Components, 2019 to 2034

Figure 8: Global Market Value Share (%) and BPS Analysis by Components, 2024 to 2034

Figure 9: Global Market Y-o-Y Growth (%) Projections by Components, 2024 to 2034

Figure 10: Global Market Value (US$ Million) Analysis by Energy Location, 2019 to 2034

Figure 11: Global Market Value Share (%) and BPS Analysis by Energy Location, 2024 to 2034

Figure 12: Global Market Y-o-Y Growth (%) Projections by Energy Location, 2024 to 2034

Figure 13: Global Market Attractiveness by Components, 2024 to 2034

Figure 14: Global Market Attractiveness by Energy Location, 2024 to 2034

Figure 15: Global Market Attractiveness by Region, 2024 to 2034

Figure 16: North America Market Value (US$ Million) by Components, 2024 to 2034

Figure 17: North America Market Value (US$ Million) by Energy Location, 2024 to 2034

Figure 18: North America Market Value (US$ Million) by Country, 2024 to 2034

Figure 19: North America Market Value (US$ Million) Analysis by Country, 2019 to 2034

Figure 20: North America Market Value Share (%) and BPS Analysis by Country, 2024 to 2034

Figure 21: North America Market Y-o-Y Growth (%) Projections by Country, 2024 to 2034

Figure 22: North America Market Value (US$ Million) Analysis by Components, 2019 to 2034

Figure 23: North America Market Value Share (%) and BPS Analysis by Components, 2024 to 2034

Figure 24: North America Market Y-o-Y Growth (%) Projections by Components, 2024 to 2034

Figure 25: North America Market Value (US$ Million) Analysis by Energy Location, 2019 to 2034

Figure 26: North America Market Value Share (%) and BPS Analysis by Energy Location, 2024 to 2034

Figure 27: North America Market Y-o-Y Growth (%) Projections by Energy Location, 2024 to 2034

Figure 28: North America Market Attractiveness by Components, 2024 to 2034

Figure 29: North America Market Attractiveness by Energy Location, 2024 to 2034

Figure 30: North America Market Attractiveness by Country, 2024 to 2034

Figure 31: Latin America Market Value (US$ Million) by Components, 2024 to 2034

Figure 32: Latin America Market Value (US$ Million) by Energy Location, 2024 to 2034

Figure 33: Latin America Market Value (US$ Million) by Country, 2024 to 2034

Figure 34: Latin America Market Value (US$ Million) Analysis by Country, 2019 to 2034

Figure 35: Latin America Market Value Share (%) and BPS Analysis by Country, 2024 to 2034

Figure 36: Latin America Market Y-o-Y Growth (%) Projections by Country, 2024 to 2034

Figure 37: Latin America Market Value (US$ Million) Analysis by Components, 2019 to 2034

Figure 38: Latin America Market Value Share (%) and BPS Analysis by Components, 2024 to 2034

Figure 39: Latin America Market Y-o-Y Growth (%) Projections by Components, 2024 to 2034

Figure 40: Latin America Market Value (US$ Million) Analysis by Energy Location, 2019 to 2034

Figure 41: Latin America Market Value Share (%) and BPS Analysis by Energy Location, 2024 to 2034

Figure 42: Latin America Market Y-o-Y Growth (%) Projections by Energy Location, 2024 to 2034

Figure 43: Latin America Market Attractiveness by Components, 2024 to 2034

Figure 44: Latin America Market Attractiveness by Energy Location, 2024 to 2034

Figure 45: Latin America Market Attractiveness by Country, 2024 to 2034

Figure 46: Western Europe Market Value (US$ Million) by Components, 2024 to 2034

Figure 47: Western Europe Market Value (US$ Million) by Energy Location, 2024 to 2034

Figure 48: Western Europe Market Value (US$ Million) by Country, 2024 to 2034

Figure 49: Western Europe Market Value (US$ Million) Analysis by Country, 2019 to 2034

Figure 50: Western Europe Market Value Share (%) and BPS Analysis by Country, 2024 to 2034

Figure 51: Western Europe Market Y-o-Y Growth (%) Projections by Country, 2024 to 2034

Figure 52: Western Europe Market Value (US$ Million) Analysis by Components, 2019 to 2034

Figure 53: Western Europe Market Value Share (%) and BPS Analysis by Components, 2024 to 2034

Figure 54: Western Europe Market Y-o-Y Growth (%) Projections by Components, 2024 to 2034

Figure 55: Western Europe Market Value (US$ Million) Analysis by Energy Location, 2019 to 2034

Figure 56: Western Europe Market Value Share (%) and BPS Analysis by Energy Location, 2024 to 2034

Figure 57: Western Europe Market Y-o-Y Growth (%) Projections by Energy Location, 2024 to 2034

Figure 58: Western Europe Market Attractiveness by Components, 2024 to 2034

Figure 59: Western Europe Market Attractiveness by Energy Location, 2024 to 2034

Figure 60: Western Europe Market Attractiveness by Country, 2024 to 2034

Figure 61: Eastern Europe Market Value (US$ Million) by Components, 2024 to 2034

Figure 62: Eastern Europe Market Value (US$ Million) by Energy Location, 2024 to 2034

Figure 63: Eastern Europe Market Value (US$ Million) by Country, 2024 to 2034

Figure 64: Eastern Europe Market Value (US$ Million) Analysis by Country, 2019 to 2034

Figure 65: Eastern Europe Market Value Share (%) and BPS Analysis by Country, 2024 to 2034

Figure 66: Eastern Europe Market Y-o-Y Growth (%) Projections by Country, 2024 to 2034

Figure 67: Eastern Europe Market Value (US$ Million) Analysis by Components, 2019 to 2034

Figure 68: Eastern Europe Market Value Share (%) and BPS Analysis by Components, 2024 to 2034

Figure 69: Eastern Europe Market Y-o-Y Growth (%) Projections by Components, 2024 to 2034

Figure 70: Eastern Europe Market Value (US$ Million) Analysis by Energy Location, 2019 to 2034

Figure 71: Eastern Europe Market Value Share (%) and BPS Analysis by Energy Location, 2024 to 2034

Figure 72: Eastern Europe Market Y-o-Y Growth (%) Projections by Energy Location, 2024 to 2034

Figure 73: Eastern Europe Market Attractiveness by Components, 2024 to 2034

Figure 74: Eastern Europe Market Attractiveness by Energy Location, 2024 to 2034

Figure 75: Eastern Europe Market Attractiveness by Country, 2024 to 2034

Figure 76: South Asia and Pacific Market Value (US$ Million) by Components, 2024 to 2034

Figure 77: South Asia and Pacific Market Value (US$ Million) by Energy Location, 2024 to 2034

Figure 78: South Asia and Pacific Market Value (US$ Million) by Country, 2024 to 2034

Figure 79: South Asia and Pacific Market Value (US$ Million) Analysis by Country, 2019 to 2034

Figure 80: South Asia and Pacific Market Value Share (%) and BPS Analysis by Country, 2024 to 2034

Figure 81: South Asia and Pacific Market Y-o-Y Growth (%) Projections by Country, 2024 to 2034

Figure 82: South Asia and Pacific Market Value (US$ Million) Analysis by Components, 2019 to 2034

Figure 83: South Asia and Pacific Market Value Share (%) and BPS Analysis by Components, 2024 to 2034

Figure 84: South Asia and Pacific Market Y-o-Y Growth (%) Projections by Components, 2024 to 2034

Figure 85: South Asia and Pacific Market Value (US$ Million) Analysis by Energy Location, 2019 to 2034

Figure 86: South Asia and Pacific Market Value Share (%) and BPS Analysis by Energy Location, 2024 to 2034

Figure 87: South Asia and Pacific Market Y-o-Y Growth (%) Projections by Energy Location, 2024 to 2034

Figure 88: South Asia and Pacific Market Attractiveness by Components, 2024 to 2034

Figure 89: South Asia and Pacific Market Attractiveness by Energy Location, 2024 to 2034

Figure 90: South Asia and Pacific Market Attractiveness by Country, 2024 to 2034

Figure 91: East Asia Market Value (US$ Million) by Components, 2024 to 2034

Figure 92: East Asia Market Value (US$ Million) by Energy Location, 2024 to 2034

Figure 93: East Asia Market Value (US$ Million) by Country, 2024 to 2034

Figure 94: East Asia Market Value (US$ Million) Analysis by Country, 2019 to 2034

Figure 95: East Asia Market Value Share (%) and BPS Analysis by Country, 2024 to 2034

Figure 96: East Asia Market Y-o-Y Growth (%) Projections by Country, 2024 to 2034

Figure 97: East Asia Market Value (US$ Million) Analysis by Components, 2019 to 2034

Figure 98: East Asia Market Value Share (%) and BPS Analysis by Components, 2024 to 2034

Figure 99: East Asia Market Y-o-Y Growth (%) Projections by Components, 2024 to 2034

Figure 100: East Asia Market Value (US$ Million) Analysis by Energy Location, 2019 to 2034

Figure 101: East Asia Market Value Share (%) and BPS Analysis by Energy Location, 2024 to 2034

Figure 102: East Asia Market Y-o-Y Growth (%) Projections by Energy Location, 2024 to 2034

Figure 103: East Asia Market Attractiveness by Components, 2024 to 2034

Figure 104: East Asia Market Attractiveness by Energy Location, 2024 to 2034

Figure 105: East Asia Market Attractiveness by Country, 2024 to 2034

Figure 106: Middle East and Africa Market Value (US$ Million) by Components, 2024 to 2034

Figure 107: Middle East and Africa Market Value (US$ Million) by Energy Location, 2024 to 2034

Figure 108: Middle East and Africa Market Value (US$ Million) by Country, 2024 to 2034

Figure 109: Middle East and Africa Market Value (US$ Million) Analysis by Country, 2019 to 2034

Figure 110: Middle East and Africa Market Value Share (%) and BPS Analysis by Country, 2024 to 2034

Figure 111: Middle East and Africa Market Y-o-Y Growth (%) Projections by Country, 2024 to 2034

Figure 112: Middle East and Africa Market Value (US$ Million) Analysis by Components, 2019 to 2034

Figure 113: Middle East and Africa Market Value Share (%) and BPS Analysis by Components, 2024 to 2034

Figure 114: Middle East and Africa Market Y-o-Y Growth (%) Projections by Components, 2024 to 2034

Figure 115: Middle East and Africa Market Value (US$ Million) Analysis by Energy Location, 2019 to 2034

Figure 116: Middle East and Africa Market Value Share (%) and BPS Analysis by Energy Location, 2024 to 2034

Figure 117: Middle East and Africa Market Y-o-Y Growth (%) Projections by Energy Location, 2024 to 2034

Figure 118: Middle East and Africa Market Attractiveness by Components, 2024 to 2034

Figure 119: Middle East and Africa Market Attractiveness by Energy Location, 2024 to 2034

Figure 120: Middle East and Africa Market Attractiveness by Country, 2024 to 2034

Recommendations

Chemicals & Materials

Wind Power Coatings Market

Published : July 2023

Oil and Gas

Wind Turbine Gear Oils Market

Published : June 2023

Explore Industrial Automation Insights

View Reports