The global wind power coatings market is valued at USD 1.7 billion in 2025 and is forecast to reach USD 4.9 billion by 2035, advancing at a CAGR of 11.0%. The rise in demand shows surging offshore wind farm installations, where turbines face harsh marine environments requiring advanced anti-corrosion systems, erosion-resistant coatings, and protective layers for longer service life. Historical growth was more gradual, tied to onshore turbine installations, but the forecast phase highlights offshore expansion as the central catalyst for coating adoption, supported by larger blade designs and higher turbine capacities. Value growth will be further amplified as blade leading edge protection systems, high-performance topcoats, and nanostructured surface technologies command premium pricing.
Demand drivers are concentrated on extending turbine lifespans and reducing costly maintenance downtime. Offshore projects in Europe, China, and the United States are scaling at pace, driving interest in coating solutions with salt spray resistance, UV protection, and ice-phobic surfaces. The requirement for blade efficiency retention has created demand for polyurethane, epoxy, and fluoropolymer-based systems that resist erosion from rain, dust, and ice. Lifecycle cost reduction is becoming a procurement priority, where performance-verified coatings with longer recoat intervals reduce both labor and logistics burden in remote offshore locations. Industry investment is also directed toward digital inspection tools and drone-assisted monitoring, which identify coating wear patterns earlier, ensuring proactive reapplication strategies.
Challenges to expansion emerge from regulatory frameworks and raw material pricing. Stringent environmental restrictions on volatile organic compounds in coating formulations are pushing suppliers toward low-VOC waterborne and powder-based alternatives, though transition costs and technical tradeoffs remain concerns. Price fluctuations for specialty polymers and resin systems, including fluoropolymers and high-grade polyurethanes, pose risks for formulators attempting to maintain stable supply contracts. Competitive pressure from wind OEMs seeking lower costs per megawatt will test supplier margins, placing emphasis on service integration and lifecycle guarantees. Substitution pressure is limited since metallic or ceramic alternatives cannot match the flexibility and adhesion required for composite blades, leaving high-performance coatings as the dominant choice.
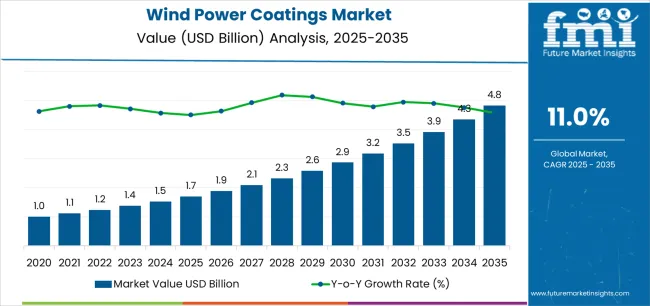
Between 2025 and 2030, the wind power coatings market is projected to expand from USD 1.7 billion to USD 2.9 billion, resulting in a value increase of USD 1.2 billion, which represents 37.5% of the total forecast growth for the decade. This phase of development will be shaped by rising demand for offshore wind blade protection and marine environment corrosion resistance applications, product innovation in leading-edge protection formulations and high-performance polymer solutions, as well as expanding integration with automated robotic application systems and advanced maintenance technologies. Companies are establishing competitive positions through investment in production capacity expansion, eco-friendly low-VOC manufacturing solutions, and strategic market expansion across offshore wind farms, onshore installations, and maintenance service applications.
From 2030 to 2035, the market is forecast to grow from USD 2.9 billion to USD 4.9 billion, adding another USD 2.0 billion, which constitutes 62.5% of the overall ten-year expansion. This period is expected to be characterized by the expansion of specialized coating formulations, including water-borne and solvent-free products tailored for specific environmental requirements, strategic collaborations between coating manufacturers and wind turbine OEMs, and an enhanced focus on application efficiency and environmental compliance. The growing emphasis on offshore wind capacity additions and blade life extension programs will drive demand for high-durability, high-performance wind power coating solutions across diverse geographical applications.
| Metric | Value |
|---|---|
| Market Value (2025) | USD 1.7 billion |
| Market Forecast Value (2035) | USD 4.9 billion |
| Forecast CAGR (2025-2035) | 11.0% |
The wind power coatings market grows by enabling wind energy operators to meet increasingly demanding performance standards and environmental durability requirements worldwide. Offshore and onshore wind farm operators face mounting pressure to implement effective blade protection systems, with advanced polymer coatings providing superior corrosion resistance and erosion protection while offering improved environmental characteristics compared to traditional solvent-based formulations. The compound's versatility across multiple applications, from leading-edge protection systems to tower and foundation coatings, creates demand across diverse wind energy infrastructure segments. Government mandates for renewable energy capacity expansion and offshore wind development, particularly in coastal and marine regions, drive increased consumption in wind turbine protection applications.
Growing demand from offshore wind installations, where polymer coatings serve as critical protection against harsh marine environments and salt-spray corrosion, supports market expansion in regions with aggressive offshore wind development programs. The maintenance and repowering sector's reliance on advanced coating systems as blade life extension solutions, combined with OEM requirements for high-performance formulations meeting strict durability specifications, creates stable demand across regulated wind energy segments. However, environmental regulations regarding VOC emissions and biocide content in marine coatings may influence formulation strategies in specific market segments, while availability of alternative protection technologies and material solutions poses competitive pressure in certain application areas.
The market is segmented by type, coating method, application, utilization, and region. By type, the market is divided into polymer coatings, ceramic coatings, and metal coatings. Based on coating method, the market is categorized into spray, roller, and other methods. By application, the market is segmented into offshore and onshore installations. By utilization, the market is divided into OEM and maintenance segments. Regionally, the market is divided into East Asia, North America, Western Europe, South Asia & Pacific, Latin America, and Middle East & Africa.
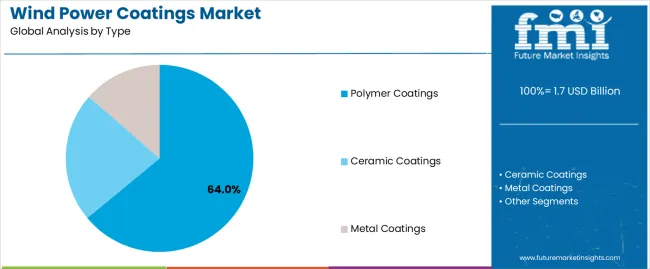
The polymer coatings segment represents the dominant force in the wind power coatings market, capturing approximately 64% of total market share in 2025. This category encompasses formulations designed for comprehensive wind turbine protection applications, including blade surfaces, towers, nacelles, and foundation structures, where advanced polymer chemistry provides optimal balance of corrosion resistance, erosion protection, and environmental durability for long-term performance requirements. The polymer segment's market leadership stems from its widespread adoption across multiple wind energy applications, with formulations offering reliable performance in marine environments, UV exposure conditions, and mechanical stress scenarios while maintaining favorable application characteristics for large-scale coating operations.
Within the polymer coatings segment, polyurethane formulations lead with 27.0% market share, serving applications requiring excellent abrasion resistance and flexible coating properties for blade leading-edge protection. Epoxy coatings maintain 20.0% share, providing superior adhesion and corrosion protection for tower and foundation applications. Fluoropolymer coatings hold 9.0% share, catering to premium applications demanding maximum weather resistance and self-cleaning properties. Gelcoat and topcoat systems account for 8.0% share, serving aesthetic and final protection layer requirements.
Key factors driving polymer segment dominance include:
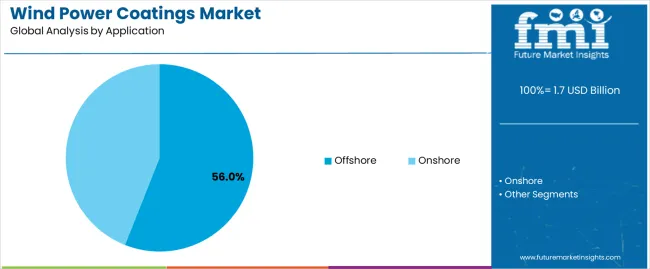
Offshore wind applications dominate the wind power coatings market with approximately 56% market share in 2025, reflecting the critical protective requirements for wind turbines operating in harsh marine environments with severe corrosion exposure, salt spray conditions, and demanding durability standards. The offshore segment's market leadership is reinforced by rapidly expanding offshore wind capacity installations, particularly in Europe, Asia, and North America, driving increased demand for premium coating systems engineered for extended service life in marine conditions.
Within the offshore application segment, blade and leading-edge protection systems lead with 26.0% market share, serving the critical need for erosion resistance and aerodynamic surface integrity in marine wind conditions. Tower protection accounts for 14.0% share, providing comprehensive corrosion barriers for tall tubular steel structures exposed to constant salt spray and humidity. Nacelle and hub coatings capture 9.0% share, protecting mechanical enclosures and rotating components. Foundation and monopile coatings hold 7.0% share, serving submerged and splash zone applications requiring maximum corrosion resistance.
The onshore wind segment represents 44.0% market share, serving land-based installations with different environmental exposure profiles including UV degradation, thermal cycling, icing conditions, and regional weather patterns requiring tailored coating solutions.
Key market dynamics supporting application growth include:
The market is driven by three concrete demand factors tied to renewable energy expansion and offshore wind development requirements. First, accelerating offshore wind installations create exponential demand for marine-grade coating systems, with global offshore wind capacity additions averaging 15-20 GW annually as coastal nations pursue renewable energy targets through large-scale offshore wind development programs. Second, stringent durability requirements for 20-25 year turbine service life drive adoption of advanced polymer coating systems, with operators demanding proven corrosion protection and erosion resistance that minimizes maintenance interventions and maximizes power generation uptime. Third, blade leading-edge erosion challenges maintain stable demand for specialized protection coatings, with industry studies indicating that leading-edge degradation reduces turbine efficiency by 5-10%, creating compelling economic justification for premium coating system investments.
Market restraints include environmental regulations governing VOC emissions and biocide content in marine coatings, creating formulation challenges and potential cost increases for manufacturers transitioning to water-borne and solvent-free technologies, particularly in European markets with strict environmental compliance requirements. Raw material price volatility for specialty polymers, fluoropolymers, and advanced resin systems can impact coating costs and project economics during periods of supply chain disruption or commodity price fluctuations. Application complexity and specialized equipment requirements for coating large wind turbine components create barriers for smaller coating contractors and maintenance service providers, particularly for offshore applications requiring marine-qualified application crews and equipment.
Key trends indicate accelerated adoption in Asia-Pacific markets, particularly China and emerging Southeast Asian wind markets, where rapid offshore wind capacity expansion and domestic blade manufacturing drive comprehensive coating system implementation. Technology advancement trends toward robotic and automated spray application systems enable more consistent coating quality while reducing labor requirements and improving transfer efficiency in blade manufacturing facilities. The maintenance and repowering sectors demonstrate growing demand for blade life extension coating systems and leading-edge protection retrofit programs, driven by aging wind farm assets in mature markets seeking to extend turbine operational life beyond original design specifications. However, the market thesis could face disruption if alternative blade protection technologies such as advanced tape systems or erosion-resistant composite materials gain significant market share through improved performance characteristics or favorable installation economics.
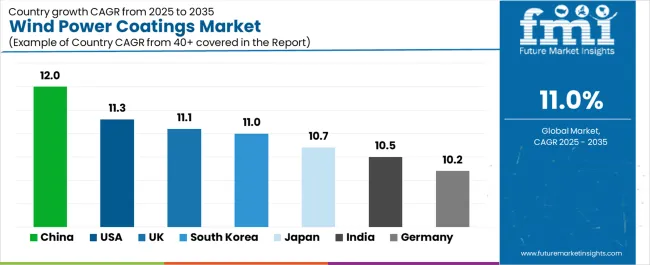
| Country | CAGR (2025-2035) |
|---|---|
| China | 12.0% |
| United States | 11.3% |
| United Kingdom | 11.1% |
| South Korea | 11.0% |
| Japan | 10.7% |
| India | 10.5% |
| Germany | 10.2% |
The wind power coatings market is gaining momentum worldwide, with China taking the lead thanks to massive offshore wind additions and rapid OEM blade manufacturing localization driving coating system demand. Close behind, the United States benefits from federal and state-backed offshore development programs and Midwest onshore installations requiring ice protection and leading-edge performance systems, positioning itself as a strategic growth market in North America. The United Kingdom shows strong advancement, where North Sea offshore projects and strict VOC and biocide regulations strengthen its role as a premium coating market favoring next-generation water-borne and solvent-free systems. South Korea is focusing on emerging offshore wind clusters with government support and advanced robotics-based coating application in shipyard facilities, signaling an ambition to capitalize on growing opportunities in Asian offshore markets. Meanwhile, Japan stands out for its floating offshore wind pilots and typhoon-resistant coating requirements, and India and Germany continue to record consistent progress in OEM blade capacity expansion and repowering applications with advanced leading-edge protection systems. Together, China and the United States anchor the global expansion story, while the rest build stability and technology advancement into the market's growth path.
The report covers an in-depth analysis of 40+ countries, with top-performing countries highlighted below.
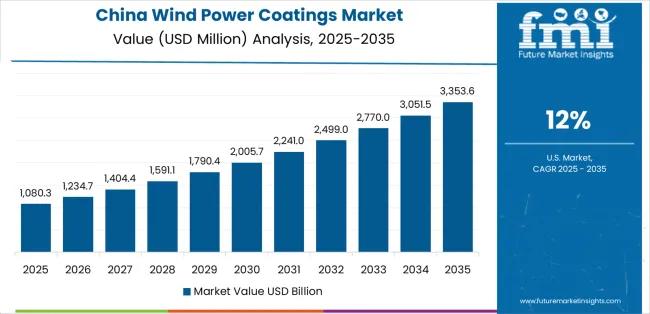
China demonstrates the strongest growth potential in the wind power coatings market with a CAGR of 12.0% through 2035. The country's leadership position stems from the world's largest annual offshore wind capacity additions, aggressive OEM blade manufacturing localization programs, and coastal corrosion exposure conditions driving demand for premium anti-corrosion and leading-edge protection coating systems. Growth is concentrated in major coastal manufacturing regions, including Jiangsu, Guangdong, Shandong, and Fujian, where blade factories, tower fabrication facilities, and offshore wind equipment manufacturers are implementing advanced polymer coating solutions for domestic installations and export markets. Distribution channels through established coating suppliers and direct manufacturer relationships expand deployment across OEM production facilities and offshore wind farm projects. The country's 14th Five-Year Plan renewable energy targets and offshore wind industrial policies provide strong policy support for coating system adoption.
Key market factors:
In major wind energy regions including Texas, Iowa, California, and emerging offshore markets along the Atlantic Coast, the adoption of advanced wind power coating systems is accelerating across blade manufacturing facilities, tower production plants, and offshore foundation fabrication yards, driven by federal offshore wind development targets and comprehensive renewable energy incentives. The market demonstrates strong growth momentum with a CAGR of 11.3% through 2035, linked to large-scale offshore wind lease areas under development and onshore market maturity requiring maintenance and repowering coating solutions. American wind energy developers are implementing advanced leading-edge protection systems and icing-resistant coating technologies to address Midwest cold climate challenges while meeting growing offshore wind project requirements in Northeast and Mid-Atlantic waters. The country's Inflation Reduction Act and state-level renewable portfolio standards create demand for wind turbine coating systems, while increasing emphasis on domestic manufacturing drives coating supply chain localization.
The wind power coatings sector in the United Kingdom demonstrates extensive implementation across offshore wind applications, with documented projects supporting North Sea wind farm installations and stringent environmental coating specifications. The country's offshore wind infrastructure in major maritime areas, including Scottish waters, East Anglia, and the Dogger Bank region, showcases integration of advanced coating technologies with large-scale turbine installations, leveraging investment in offshore wind capacity expansion and blade service hub development. British wind operators and coating suppliers emphasize environmental compliance and low-emission formulations, creating demand for water-borne and next-generation coating systems that support strict UK and EU environmental regulations. The market maintains strong growth through focus on offshore wind leadership and coating technology advancement, with a CAGR of 11.1% through 2035.
Key development areas:
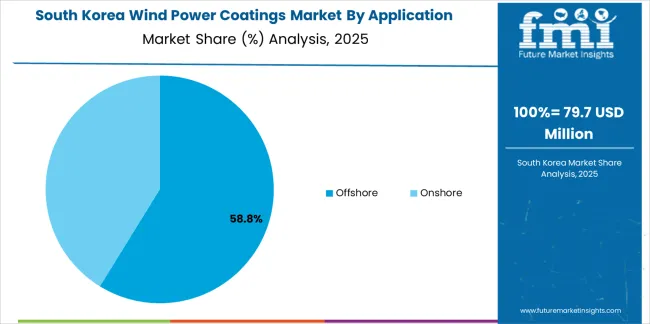
The wind power coatings market expansion in South Korea is driven by emerging offshore wind clusters along the southwestern coast in Jeolla provinces and southeastern regions near Ulsan, with government-backed offshore wind development programs and advanced shipyard coating application capabilities supporting market growth. The country demonstrates promising growth potential with a CAGR of 11.0% through 2035, supported by offshore wind capacity targets and robotics-based automated coating application in world-class shipyard and industrial facilities. Korean manufacturers face opportunities in leveraging existing heavy industry coating expertise for wind turbine applications, with major industrial companies entering wind energy component manufacturing. However, growing offshore wind project pipelines and government renewable energy commitments create compelling business cases for coating system adoption, particularly in offshore foundation and monopile protection applications where Korean shipyards possess technical advantages.
Market characteristics:
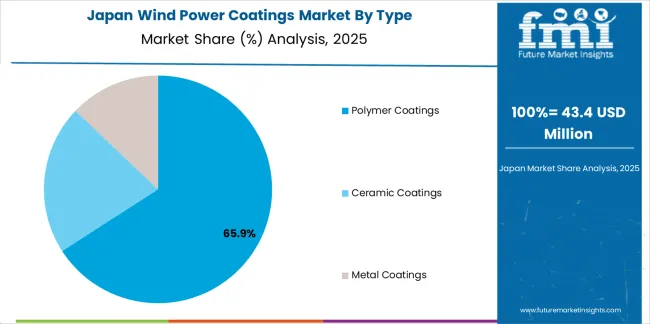
The Japan market leads in demanding high-performance coating specifications based on floating offshore wind technology deployment and extreme weather resistance requirements including typhoon exposure and severe sea-spray conditions. The country shows solid potential with a CAGR of 10.7% through 2035, driven by floating offshore pilot projects and technology demonstration programs requiring advanced anti-erosion and anti-fouling coating systems. Japanese wind energy developers and coating suppliers are collaborating on specialized formulations addressing Japan's unique environmental challenges, particularly typhoon-resistant coating systems and floating platform corrosion protection requirements. Technology deployment channels through established chemical manufacturers and comprehensive technical support services expand coverage across offshore demonstration projects and expanding onshore installations.
Leading market segments:
In Gujarat, Tamil Nadu, Maharashtra, and Rajasthan, wind turbine blade manufacturing facilities and tower production plants are implementing polymer coating systems to support India's expanding wind energy capacity and OEM export operations, with documented applications supporting both domestic installations and international blade sales. The market shows moderate growth potential with a CAGR of 10.5% through 2035, linked to blade manufacturing capacity expansion, coastal humidity and UV exposure conditions requiring comprehensive corrosion protection, and cost-optimized polyurethane and epoxy coating system adoption. Indian manufacturers are adopting spray application technologies and quality control systems to meet international blade quality standards while maintaining competitive pricing for global markets. The country's renewable energy targets and manufacturing incentive programs create demand for coating solutions that integrate with expanding blade production facilities.
Market development factors:
In major wind energy states including Lower Saxony, Schleswig-Holstein, Brandenburg, and coastal regions, wind farm operators and blade service providers are implementing coating systems to support repowering programs, Baltic and North Sea offshore expansion, and leading-edge protection retrofit initiatives extending blade operational life. The market shows steady growth potential with a CAGR of 10.2% through 2035, linked to onshore wind farm repowering replacing first-generation turbines with modern high-capacity systems, offshore wind capacity additions in German Baltic and North Sea waters, and maintenance sector growth driven by aging turbine asset base. German coating suppliers and application specialists are adopting advanced leading-edge protection technologies and comprehensive blade refurbishment programs to maximize turbine performance and extend asset life. The country's Energiewende transition policies and offshore wind expansion targets create coating demand across new installations and maintenance applications.
Key market characteristics:
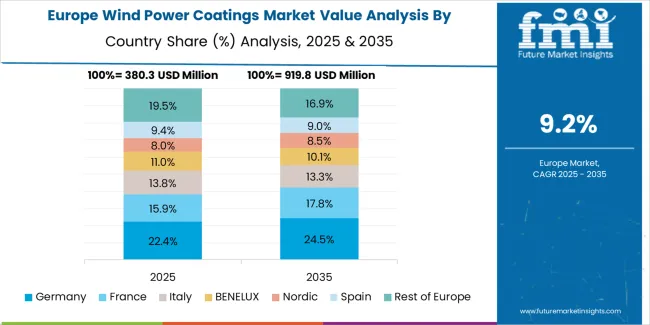
The European Wind Power Coatings market is projected to grow from USD 0.6 billion in 2025 to USD 1.6 billion by 2035, registering a CAGR of 10.5% over the forecast period. Germany is expected to maintain its leadership position with a 24.5% market share in 2025, easing slightly to 24.0% by 2035, supported by strong Baltic and North Sea repowering programs and blade leading-edge protection retrofit initiatives.
The United Kingdom follows with a 21.0% share in 2025, projected to reach 21.3% by 2035, driven by large offshore wind hubs and tighter environmental specifications favoring advanced water-borne coating systems. Denmark holds a 15.2% share in 2025, declining slightly to 15.0% by 2035, reflecting its role in OEM blade manufacturing and advanced leading-edge protection system usage. The Netherlands commands a 12.0% share in 2025, expanding to 12.2% by 2035, attributed to monopile and foundation protection demand from offshore wind development.
France accounts for 10.8% in 2025, growing to 11.1% by 2035, driven by Atlantic and English Channel offshore projects scaling up capacity. Spain holds 9.0% in 2025, projected to reach 9.2% by 2035, supported by coastal onshore installations and emerging offshore wind pilot programs. The Rest of Europe region collectively declines from 7.5% to 7.2% by 2035, while Nordic and Eastern European projects expand with stricter corrosion and icing protection standards driving specialized coating adoption.
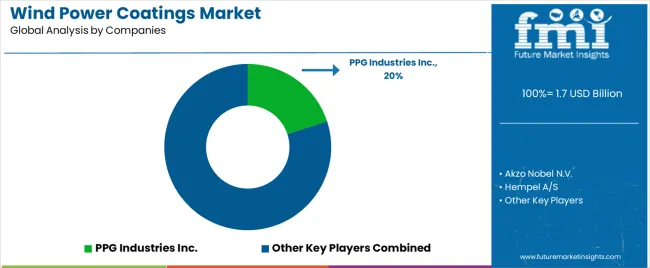
The Wind Power Coatings Market features approximately 10-15 meaningful players with moderate concentration, where the leading company PPG Industries Inc. holds approximately 20.0% of global market share, while the top three companies collectively control roughly 45-50% of the market through established coating production facilities and extensive wind energy industry relationships. Competition centers on formulation technology advancement, marine environment performance validation, and comprehensive technical service support rather than price competition alone.
Market leaders include PPG Industries Inc., Akzo Nobel N.V., and Hempel A/S, which maintain competitive advantages through comprehensive protective coatings portfolios, global manufacturing networks, and deep expertise in industrial and marine coating sectors, creating high switching costs for wind turbine OEMs and operators relying on proven performance and technical support. These companies leverage economies of scale and ongoing customer relationships to defend market positions while expanding into specialized applications including leading-edge protection systems and offshore foundation coatings.
Challengers encompass Jotun A/S and Sherwin-Williams, which compete through marine coating expertise and diversified industrial coating portfolios serving multiple sectors beyond wind energy. Technology specialists, including BASF SE, Covestro AG (supplying raw materials and coating technologies), Teknos Group, Duromar Inc., and Mankiewicz, focus on specific coating formulations or vertical applications, offering differentiated capabilities in polyurethane systems, epoxy formulations, and specialized application solutions.
Regional players and emerging coating producers create competitive pressure through cost-effective solutions and localized service capabilities, particularly in high-growth markets including China and India, where domestic presence provides advantages in customer service and supply chain responsiveness. Market dynamics favor companies that combine proven coating formulation technology with comprehensive application support and long-term performance warranties that address the complete product lifecycle from OEM manufacturing through multi-year maintenance programs.
Wind power coatings represent versatile protective solutions that enable wind energy operators to achieve effective corrosion resistance, erosion protection, and long-term durability performance across diverse turbine components, delivering reliable asset protection and maintenance cost optimization essential for achieving target service life and maximizing energy production efficiency in demanding offshore and onshore environments. With the market projected to grow from USD 1.7 billion in 2025 to USD 4.9 billion by 2035 at an 11.0% CAGR, these coating solutions offer compelling advantages-proven performance in marine environments, advanced erosion resistance capabilities, and comprehensive turbine component protection-making them essential for offshore wind applications (56.0% market share), OEM manufacturing operations (54.0% share), and maintenance programs seeking reliable coating solutions that support asset life extension and regulatory compliance. Scaling market adoption and technological advancement requires coordinated action across renewable energy policy, coating technology development, chemical manufacturers, wind energy operators, and eco-friendly chemistry investment capital.
How Governments Could Spur Local Production and Adoption?
How Industry Bodies Could Support Market Development?
How OEMs and Technology Players Could Strengthen the Ecosystem?
How Suppliers Could Navigate the Shift?
How Investors and Financial Enablers Could Unlock Value?
| Item | Value |
|---|---|
| Quantitative Units | USD 1.7 billion |
| Type | Polymer Coatings (Polyurethane, Epoxy, Fluoropolymer, Gelcoat/Topcoat), Ceramic Coatings, Metal Coatings |
| Coating Method | Spray (Airless, Electrostatic, Robotic/Automated), Roller, Other |
| Application | Offshore (Blades/LEP, Towers, Nacelles/Hubs, Foundations/Monopiles), Onshore |
| Utilization | OEM, Maintenance |
| Regions Covered | East Asia, North America, Western Europe, South Asia & Pacific, Latin America, Middle East & Africa |
| Country Covered | China, United States, United Kingdom, South Korea, Japan, India, Germany, and 40+ countries |
| Key Companies Profiled | PPG Industries Inc., Akzo Nobel N.V., Hempel A/S, Jotun A/S, Sherwin-Williams, BASF SE, Covestro AG, Teknos Group, Duromar Inc., Mankiewicz |
| Additional Attributes | Dollar sales by type, coating method, application, and utilization categories, regional adoption trends across East Asia, North America, and Western Europe, competitive landscape with coating manufacturers and technology providers, production facility requirements and specifications, integration with wind turbine manufacturing and maintenance systems, innovations in formulation technology and application equipment, and development of specialized coatings with erosion resistance and marine environment capabilities. |
The global wind power coatings market is estimated to be valued at USD 1.7 billion in 2025.
The market size for the wind power coatings market is projected to reach USD 4.8 billion by 2035.
The wind power coatings market is expected to grow at a 11.0% CAGR between 2025 and 2035.
The key product types in wind power coatings market are polymer coatings , ceramic coatings and metal coatings.
In terms of application, offshore segment to command 56.0% share in the wind power coatings market in 2025.


Full Research Suite comprises of:
Market outlook & trends analysis
Interviews & case studies
Strategic recommendations
Vendor profiles & capabilities analysis
5-year forecasts
8 regions and 60+ country-level data splits
Market segment data splits
12 months of continuous data updates
DELIVERED AS:
PDF EXCEL ONLINE
Wind Energy Consulting Service Market Size and Share Forecast Outlook 2025 to 2035
Window Air Conditioner Market Size and Share Forecast Outlook 2025 to 2035
Windsurf Foil Board Market Size and Share Forecast Outlook 2025 to 2035
Windscreen Adhesives Market Size and Share Forecast Outlook 2025 to 2035
Wind Turbine Blade Market Size and Share Forecast Outlook 2025 to 2035
Wind Turbine Forging Market Size and Share Forecast Outlook 2025 to 2035
Wind Vane Wiring Market Size and Share Forecast Outlook 2025 to 2035
Wind Turbine Pitch and Yaw Drive Market Size and Share Forecast Outlook 2025 to 2035
Window Packaging Market Size and Share Forecast Outlook 2025 to 2035
Wind Turbine Industry Analysis in Latin America Growth - Trends & Forecast 2025 to 2035
Wind Turbine Market Analysis and Insights - 2025 to 2035
Window Coverings Market – Trends, Growth & Forecast 2025 to 2035
Assessing Window Packaging Market Share & Industry Trends
Wind Turbine Automation Market Insights - Growth & Forecast through 2035
Wind Turbine Composite Material Market Size 2024-2034
Wind Turbine Blade Repair Material Market Growth – Trends & Forecast 2024-2034
Wind Speed Alarm Market
Window Rain Guards Market
Wind Turbine Shaft Market
Sidewinder Machine Market Size and Share Forecast Outlook 2025 to 2035

Thank you!
You will receive an email from our Business Development Manager. Please be sure to check your SPAM/JUNK folder too.
Chat With
MaRIA