Floating Offshore Wind Energy Market Size and Share Forecast Outlook 2025 to 2035

The Floating Offshore Wind Energy Market is estimated to be valued at USD 483.5 million in 2025 and is projected to reach USD 7476.1 million by 2035, registering a compound annual growth rate (CAGR) of 31.5% over the forecast period.
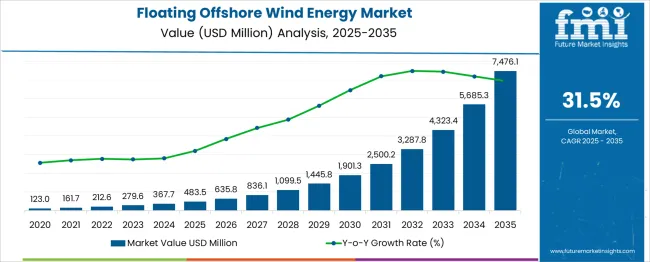
Quick Stats for Floating Offshore Wind Energy Market

  • Floating Offshore Wind Energy Market Value (2025): USD 483.5 million
  • Floating Offshore Wind Energy Market Forecast Value (2035): USD 7476.1 million
  • Floating Offshore Wind Energy Market Forecast CAGR: 31.5%
  • Leading Segment in Floating Offshore Wind Energy Market in 2025: ≤ 2 MW (29.4%)
  • Key Growth Regions in Floating Offshore Wind Energy Market: North America, Asia-Pacific, Europe
  • Top Key Players in Floating Offshore Wind Energy Market: Equinor ASA, General Electric, Global Energy (Group) Limited, Hexicon, Nexans, Ørsted A/S, Prysmian Group, RWE, Sumitomo Electric Industries, Ltd., Simply Blue Group, Siemens Gamesa Renewable Energy, Vattenfall AB, Vestas

Floating Offshore Wind Energy Market

Floating Offshore Wind Energy Market Key Takeaways

Metric Value
Floating Offshore Wind Energy Market Estimated Value in (2025 E) USD 483.5 million
Floating Offshore Wind Energy Market Forecast Value in (2035 F) USD 7476.1 million
Forecast CAGR (2025 to 2035) 31.5%

Why is the Floating Offshore Wind Energy Market Growing?

Advancements in mooring technologies, turbine design, and floating platform stability have accelerated project feasibility, attracting strong public and private investment. Rising energy demand, coupled with decarbonization commitments from major economies, has positioned floating wind as a strategic contributor to long-term renewable energy targets. The market is further supported by favorable regulatory frameworks, feed-in tariffs, and offshore leasing rounds that incentivize project development.

Future growth is expected to be driven by large-scale demonstration projects transitioning into commercial deployments, reducing the levelized cost of energy (LCOE) through economies of scale. As technology matures and global supply chains expand, floating wind is set to play a critical role in the renewable energy mix, particularly for countries with deep-water coastlines and limited land availability.

Segmental Analysis

The floating offshore wind energy market is segmented by turbine rating, axis, component, and depth, as well as geographic regions. The turbine rating of the floating offshore wind energy market is divided into ≤ 2 MW, >2 to 5 MW, >5 to 8 MW, >8 to 10 MW, >10 to 12 MW, and > 12 MW. In terms of the axis, the floating offshore wind energy market is classified into Horizontal (HAWTs), Up-wind, Downwind, and Vertical (VAWTs). The floating offshore wind energy market is segmented into Blades, Towers, and Others. The depth of the floating offshore wind energy market is segmented into ≤ 30 m, >30 m to ≤ 50 m, and > 50 m. Regionally, the floating offshore wind energy industry is classified into North America, Latin America, Western Europe, Eastern Europe, Balkan & Baltic Countries, Russia & Belarus, Central Asia, East Asia, South Asia & Pacific, and the Middle East & Africa.
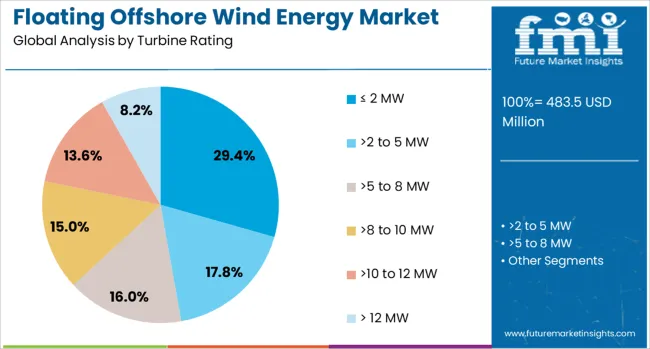
Insights into the ≤ 2 MW Turbine Rating Segment

Floating Offshore Wind Energy Market Analysis By Turbine Rating

The ≤ 2 MW turbine rating segment accounted for 29.4% of the floating offshore wind energy market, largely driven by pilot-scale projects, small-grid applications, and early-stage deployments focused on technology validation. This segment serves as the entry point for testing floating platforms, mooring systems, and integration with grid infrastructure before scaling to higher-capacity installations.

Despite being lower in power output, these turbines offer greater flexibility for research institutions and developers seeking to optimize design under real-sea conditions. Their compact size enables easier transportation, installation, and maintenance, making them suitable for isolated coastal grids and remote island systems.

As floating wind technology matures and confidence builds through these smaller-scale installations, the ≤ 2 MW segment is expected to remain relevant for educational, R&D, and hybrid energy projects, even as the market shifts toward larger turbine capacities.
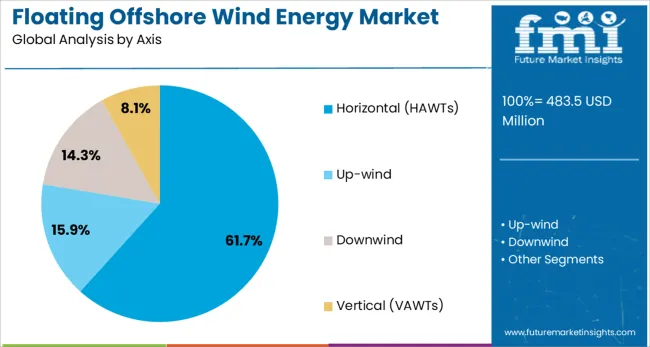
Insights into the Horizontal (HAWTs) Axis Segment

Floating Offshore Wind Energy Market Analysis By Axis

The horizontal axis wind turbine (HAWT) segment dominates the axis category with a commanding 61.7% market share, reflecting its technological maturity, higher efficiency, and widespread industry acceptance. HAWTs are favored in floating offshore wind applications due to their proven track record in fixed offshore installations, standardized manufacturing processes, and optimized blade aerodynamics.

Their horizontal rotor orientation enables better alignment with prevailing winds, maximizing power generation and operational stability. Additionally, the availability of engineering expertise, supply chain infrastructure, and performance data makes HAWTs the preferred configuration for utility-scale projects.

Most of the floating demonstration and pre-commercial arrays currently under development utilize horizontal-axis systems, further reinforcing their dominance. As the market scales and developers prioritize risk mitigation and reliability, HAWTs are expected to retain their leading position in floating offshore wind deployments globally.
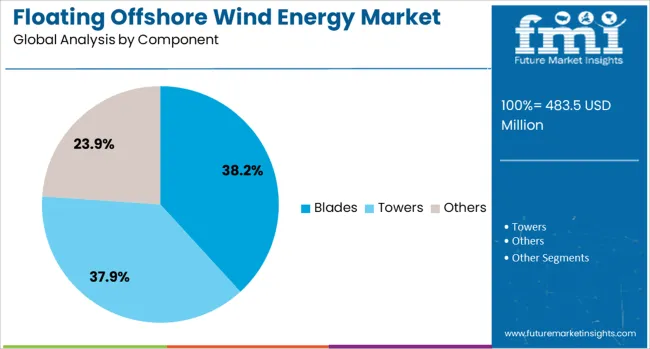
Insights into the Blades Component Segment

Floating Offshore Wind Energy Market Analysis By Component

The blades segment leads the component category with a 38.2% market share, emphasizing its critical role in determining turbine efficiency, load handling, and aerodynamic performance. In floating offshore applications, blades are subjected to complex dynamic forces from wind, waves, and platform motion, requiring advanced material engineering and structural optimization.

Manufacturers are increasingly investing in lightweight, high-strength composite materials and modular blade designs to enhance performance and reduce logistical challenges. Longer blades with higher aspect ratios are being deployed to capture low-speed winds efficiently, thereby improving energy yield in deep-sea locations.

As turbines grow in size and capacity, the demand for durable, efficient, and low-maintenance blades continues to rise. The segment is expected to maintain strong momentum as innovation in blade technology remains central to cost reduction and performance improvement in floating offshore wind systems.

What are the Drivers, Restraints, and Key Trends of the Floating Offshore Wind Energy Market?

Floating offshore wind continues to expand into deeper waters, accounting for 18 % of new offshore turbine installations in 2024. Activity is concentrated in Pacific and North Atlantic zones where seabed constraints limit fixed-bottom use. Higher wind availability and foundation flexibility are key drivers. Innovations in mooring and platform design remain central.

Floating Turbine Deployment & Deep-Water Site Optimization

Floating wind farms are now sited beyond 60 m depth using spar, semi-submersible, and tension-leg platforms. These locations provide steadier wind conditions, boosting capacity factors by up to 12 % over fixed-bottom units. Trials in Scotland, Japan, and Portugal have recorded improved platform stability and minimal seabed impact. Dynamic mooring sensors and real-time ballast systems are enabling automated tilt correction. Developers use modular interconnects and preassembled topsides to reduce offshore hook-up time by 27 %. Platforms are shipped with pre-certified structures for site-specific wave and wind loads, shortening commissioning timelines and lowering risk during mobilization.

Installation Expenditure, Mooring Complexity & Supply Chain Limitations

Floating wind installations face higher costs and logistical hurdles. Platform deployment averages 25–30 % more than fixed foundations due to mooring systems, buoyant substructures, and dynamic export cabling. Mooring arrays require precise tensioning, increasing turbine-level installation time by up to 18 %. Vessel shortages often delay campaigns in remote waters, with project timelines slipping 14–20 %. There are few fabrication yards capable of building floaters at scale, and oversized unit transport can extend lead times by 8–10 weeks. Onshore permitting and offshore grid readiness assessments add 4–6 months to the pre-build phase.
Analysis of Floating Offshore Wind Energy Market By Key Countries

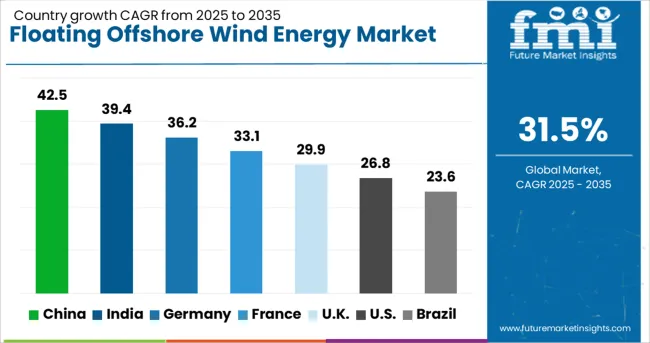
Floating Offshore Wind Energy Market Cagr Analysis By Country

Country CAGR
China 42.5%
India 39.4%
Germany 36.2%
France 33.1%
UK 29.9%
USA 26.8%
Brazil 23.6%

Global floating offshore wind energy market is projected to grow at a 31.5% CAGR from 2025 to 2035. Among the top five markets, China leads with a 42.5% CAGR, exceeding the global average by +35% due to accelerated project commissioning and favorable coastal geography. India follows at 39.4%, offering a +25% premium, driven by supportive government frameworks and technology partnerships. Germany, at 36.2%, maintains a +15% margin, anchored by North Sea capacity additions. The UK records 29.9%, slightly trailing the global trend (–5%) amid grid access constraints. The US stands at 26.8%, or –15% below average, impacted by regulatory lags and interconnection bottlenecks. The report covers detailed analysis of 40+ countries, with the top five countries shared as a reference.

China Accelerates Offshore Deployment via Deep-Water Zones

Demand o floating offshore wind sector is expanding at 42.5% CAGR, driven by activity along Fujian and Guangdong coasts. Over 4.6 GW of projects have cleared pilot approvals from the National Energy Administration. China State Shipbuilding Corporation increased floater output at its Guangzhou yard. Deployment is shifting to 16 MW+ turbines. Two eastern ports completed upgrades to manage spar-buoy transport logistics.

  • 7.3 GW of floating capacity in the pipeline, including 2.2 GW under construction
  • Installations extending beyond 70 m water depths along the eastern coast
  • 17 turbine nacelles rated above 16 MW shipped from Qingdao in 2024

India Expands Floating Wind in Gulf and Bay Regions

The market in India is advancing at 39.4% CAGR, led by MNRE-backed tenders and joint ventures with Dutch and Norwegian firms. Gujarat and Tamil Nadu are priority regions, with over 2.1 GW in pre-feasibility. Prototype testing began at BHEL and Cochin Shipyard. Policy measures require grid compatibility for floating systems before 2027.
  • 840 MW of capacity identified in the Gulf of Mannar
  • 4 cross-border MoUs signed for mooring system co-development
  • 22% of 2024 offshore engineering graduates placed in floating wind firms

Germany Targets Baltic Expansion and Moored Floater Designs

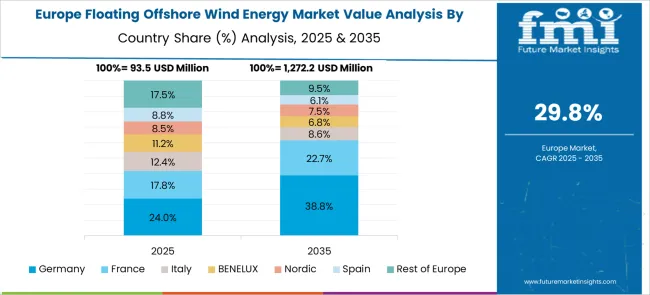
Floating Offshore Wind Energy Market Europe Country Market Share Analysis, 2025 & 2035

Gemany market for the floating segment is growing at a 36.2% CAGR, focused on Baltic Sea sites. Fraunhofer IWES completed model testing of TLP and barge configurations in the North Sea. New OEM partnerships support floaters co-designed for hydrogen coupling. Regulatory approval was granted for dynamic offshore cable protocols in 2024.

  • 2.6 GW of licenses under technical evaluation in the Baltic region
  • 38% of new project tenders included hydrogen-enabled floaters
  • 3 ports adapted for turbine assembly and floater integration

UK Repositions Port Infrastructure for ScotWind Floating Projects

UK floating wind is expanding at 29.9% CAGR, led by ScotWind and INTOG leases. Fourteen floating-specific awards were granted by Crown Estate Scotland. Hybrid TLP and semi-submersible foundations are under testing in Moray Firth and Western Isles. Port of Nigg and Port Talbot received over £340 million in infrastructure investment.
  • 7.4 GW of floating capacity awarded under seabed lease agreements
  • 6 prototypes under trial in Orkney and Shetland zones
  • 18 foundation units installed with 12–15 MW turbines in 2024

USA Advances Floating Wind Through California and Gulf of Maine

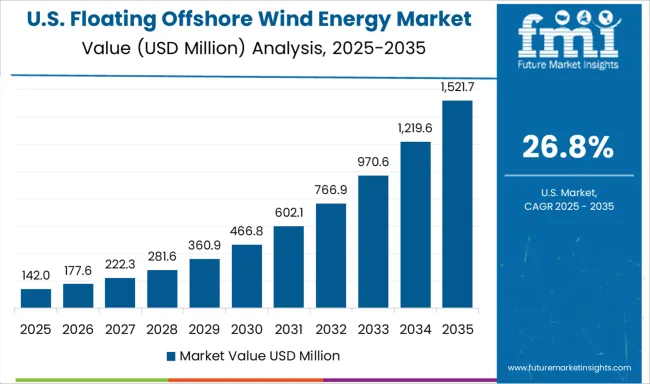
Floating Offshore Wind Energy Market Country Value Analysis

The USA floating wind market is advancing at 26.8% CAGR, supported by BOEM lease activity in Pacific and Northeast waters. California sites exceed 900 m depth, favoring semi-submersible platforms. Equinor and Ocean Winds established USA joint ventures for hull manufacturing. Redwood Coast and Morro Bay projects are piloting AI-based mooring tension control. The DoE allocated USD 275 million to floating wind R&D in 2024.
  • 5.6 GW in federal lease areas reserved for floating wind
  • Shipyards in Oregon and Louisiana converted for floater production
  • 76% of deep-water feasibility studies in 2024 focused on mooring analysis

Competitive Landscape of Floating Offshore Wind Energy Market

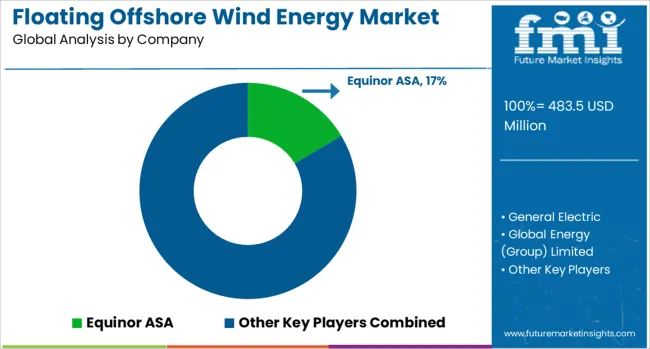
Floating Offshore Wind Energy Market Analysis By Company

Equinor ASA holds a significant share of the floating offshore wind sector, leading early commercial deployment. Ørsted and RWE are scaling investments, supported by turbine OEMs such as Siemens Gamesa and Vestas, both developing 15 MW+ models tailored for floating integration. Platform firms like Hexicon are advancing twin-turbine configurations, while Prysmian Group and Nexans supply dynamic export cabling for deep-water connection. The industry is transitioning from pilot-scale installations to full utility-scale projects, targeting 150 GW globally by 2035. Cost-reduction efforts center on modular substructure design and hybrid steel–concrete platforms, aiming for a 40 % decrease by 2030. Deployment remains constrained by limited access to floater-capable vessels and staging ports. Co-location opportunities with hydrogen generation and offshore aquaculture are being incorporated in project planning across Asia, Europe, and North America.

Key Developments in Floating Offshore Wind Energy Market

In April 2024, the UK approved the 560 MW Green Volt project, Europe’s first large-scale floating wind farm. Located 80 km off Aberdeen, it will use 35 turbines of 16 MW each. Developed by Flotation Energy and Vårgrønn, it secured a CfD for 400 MW at £139.93/MWh. Commissioning is set for 2029.

Scope of the Report

Item Value
Quantitative Units USD 483.5 Million
Turbine Rating ≤ 2 MW, >2 to 5 MW, >5 to 8 MW, >8 to 10 MW, >10 to 12 MW, and > 12 MW
Axis Horizontal (HAWTs), Up-wind, Downwind, and Vertical (VAWTs)
Component Blades, Towers, and Others
Depth ≤ 30 m, >30 m to ≤ 50 m, and > 50 m
Regions Covered North America, Europe, Asia-Pacific, Latin America, Middle East & Africa
Country Covered United States, Canada, Germany, France, United Kingdom, China, Japan, India, Brazil, South Africa
Key Companies Profiled Equinor ASA, General Electric, Global Energy (Group) Limited, Hexicon, Nexans, Ørsted A/S, Prysmian Group, RWE, Sumitomo Electric Industries, Ltd., Simply Blue Group, Siemens Gamesa Renewable Energy, Vattenfall AB, and Vestas
Additional Attributes Dollar sales by platform type (spar-buoy, semi-submersible, tension-leg) and application (utility-scale power, hybrid energy parks, island electrification), demand dynamics across deepwater leasing, power purchase agreements, and hydrogen co-location, regional trends led by Europe with Asia‑Pacific advancing domestic turbine integration, innovation in dynamic cable design and mooring system optimization, and environmental impact of seabed disturbance limits and marine biodiversity preservation.

Floating Offshore Wind Energy Market by Segments

Turbine Rating:

  • ≤ 2 MW
  • >2 to 5 MW
  • >5 to 8 MW
  • >8 to 10 MW
  • >10 to 12 MW
  • > 12 MW

Axis:

  • Horizontal (HAWTs)
  • Up-wind
  • Downwind
  • Vertical (VAWTs)

Component:

  • Blades
  • Towers
  • Others

Depth:

  • ≤ 30 m
  • >30 m to ≤ 50 m
  • > 50 m

Region:

  • North America
    • USA
    • Canada
    • Mexico
  • Latin America
    • Brazil
    • Chile
    • Rest of Latin America
  • Western Europe
    • Germany
    • UK
    • Italy
    • Spain
    • France
    • Nordic
    • BENELUX
    • Rest of Western Europe
  • Eastern Europe
    • Russia
    • Poland
    • Hungary
    • Balkan & Baltic
    • Rest of Eastern Europe
  • East Asia
    • China
    • Japan
    • South Korea
  • South Asia and Pacific
    • India
    • ASEAN
    • Australia & New Zealand
    • Rest of South Asia and Pacific
  • Middle East & Africa
    • Kingdom of Saudi Arabia
    • Other GCC Countries
    • Turkiye
    • South Africa
    • Other African Union
    • Rest of Middle East & Africa

Table of Content

  1. Executive Summary
    • Global Market Outlook
    • Demand-side Trends
    • Supply-side Trends
    • Technology Roadmap Analysis
    • Analysis and Recommendations
  2. Market Overview
    • Market Coverage / Taxonomy
    • Market Definition / Scope / Limitations
  3. Market Background
    • Market Dynamics
      • Drivers
      • Restraints
      • Opportunity
      • Trends
    • Scenario Forecast
      • Demand in Optimistic Scenario
      • Demand in Likely Scenario
      • Demand in Conservative Scenario
    • Opportunity Map Analysis
    • Product Life Cycle Analysis
    • Supply Chain Analysis
    • Investment Feasibility Matrix
    • Value Chain Analysis
    • PESTLE and Porter’s Analysis
    • Regulatory Landscape
    • Regional Parent Market Outlook
    • Production and Consumption Statistics
    • Import and Export Statistics
  4. Global Floating Offshore Wind Energy Market Analysis 2020-2024 and Forecast, 2025-2035
    • Historical Market Size Value (USD Mn) Analysis, 2020-2024
    • Current and Future Market Size Value (USD Mn) Projections, 2025-2035
      • Y-o-Y Growth Trend Analysis
      • Absolute $ Opportunity Analysis
  5. Global Floating Offshore Wind Energy Market Pricing Analysis 2020-2024 and Forecast 2025-2035
  6. Global Floating Offshore Wind Energy Market Analysis 2020-2024 and Forecast 2025-2035, By Turbine Rating
    • Introduction / Key Findings
    • Historical Market Size Value (USD Mn) Analysis By Turbine Rating , 2020-2024
    • Current and Future Market Size Value (USD Mn) Analysis and Forecast By Turbine Rating , 2025-2035
      • ≤ 2 MW
      • >2 to 5 MW
      • >5 to 8 MW
      • >8 to 10 MW
      • >10 to 12 MW
      • > 12 MW
    • Y-o-Y Growth Trend Analysis By Turbine Rating , 2020-2024
    • Absolute $ Opportunity Analysis By Turbine Rating , 2025-2035
  7. Global Floating Offshore Wind Energy Market Analysis 2020-2024 and Forecast 2025-2035, By Axis
    • Introduction / Key Findings
    • Historical Market Size Value (USD Mn) Analysis By Axis, 2020-2024
    • Current and Future Market Size Value (USD Mn) Analysis and Forecast By Axis, 2025-2035
      • Horizontal (HAWTs)
      • Up-wind
      • Downwind
      • Vertical (VAWTs)
    • Y-o-Y Growth Trend Analysis By Axis, 2020-2024
    • Absolute $ Opportunity Analysis By Axis, 2025-2035
  8. Global Floating Offshore Wind Energy Market Analysis 2020-2024 and Forecast 2025-2035, By Component
    • Introduction / Key Findings
    • Historical Market Size Value (USD Mn) Analysis By Component, 2020-2024
    • Current and Future Market Size Value (USD Mn) Analysis and Forecast By Component, 2025-2035
      • Blades
      • Towers
      • Others
    • Y-o-Y Growth Trend Analysis By Component, 2020-2024
    • Absolute $ Opportunity Analysis By Component, 2025-2035
  9. Global Floating Offshore Wind Energy Market Analysis 2020-2024 and Forecast 2025-2035, By Depth
    • Introduction / Key Findings
    • Historical Market Size Value (USD Mn) Analysis By Depth, 2020-2024
    • Current and Future Market Size Value (USD Mn) Analysis and Forecast By Depth, 2025-2035
      • ≤ 30 m
      • >30 m to ≤ 50 m
      • > 50 m
    • Y-o-Y Growth Trend Analysis By Depth, 2020-2024
    • Absolute $ Opportunity Analysis By Depth, 2025-2035
  10. Global Floating Offshore Wind Energy Market Analysis 2020-2024 and Forecast 2025-2035, By Region
    • Introduction
    • Historical Market Size Value (USD Mn) Analysis By Region, 2020-2024
    • Current Market Size Value (USD Mn) Analysis and Forecast By Region, 2025-2035
      • North America
      • Latin America
      • Western Europe
      • Eastern Europe
      • East Asia
      • South Asia and Pacific
      • Middle East & Africa
    • Market Attractiveness Analysis By Region
  11. North America Floating Offshore Wind Energy Market Analysis 2020-2024 and Forecast 2025-2035, By Country
    • Historical Market Size Value (USD Mn) Trend Analysis By Market Taxonomy, 2020-2024
    • Market Size Value (USD Mn) Forecast By Market Taxonomy, 2025-2035
      • By Country
        • USA
        • Canada
        • Mexico
      • By Turbine Rating
      • By Axis
      • By Component
      • By Depth
    • Market Attractiveness Analysis
      • By Country
      • By Turbine Rating
      • By Axis
      • By Component
      • By Depth
    • Key Takeaways
  12. Latin America Floating Offshore Wind Energy Market Analysis 2020-2024 and Forecast 2025-2035, By Country
    • Historical Market Size Value (USD Mn) Trend Analysis By Market Taxonomy, 2020-2024
    • Market Size Value (USD Mn) Forecast By Market Taxonomy, 2025-2035
      • By Country
        • Brazil
        • Chile
        • Rest of Latin America
      • By Turbine Rating
      • By Axis
      • By Component
      • By Depth
    • Market Attractiveness Analysis
      • By Country
      • By Turbine Rating
      • By Axis
      • By Component
      • By Depth
    • Key Takeaways
  13. Western Europe Floating Offshore Wind Energy Market Analysis 2020-2024 and Forecast 2025-2035, By Country
    • Historical Market Size Value (USD Mn) Trend Analysis By Market Taxonomy, 2020-2024
    • Market Size Value (USD Mn) Forecast By Market Taxonomy, 2025-2035
      • By Country
        • Germany
        • UK
        • Italy
        • Spain
        • France
        • Nordic
        • BENELUX
        • Rest of Western Europe
      • By Turbine Rating
      • By Axis
      • By Component
      • By Depth
    • Market Attractiveness Analysis
      • By Country
      • By Turbine Rating
      • By Axis
      • By Component
      • By Depth
    • Key Takeaways
  14. Eastern Europe Floating Offshore Wind Energy Market Analysis 2020-2024 and Forecast 2025-2035, By Country
    • Historical Market Size Value (USD Mn) Trend Analysis By Market Taxonomy, 2020-2024
    • Market Size Value (USD Mn) Forecast By Market Taxonomy, 2025-2035
      • By Country
        • Russia
        • Poland
        • Hungary
        • Balkan & Baltic
        • Rest of Eastern Europe
      • By Turbine Rating
      • By Axis
      • By Component
      • By Depth
    • Market Attractiveness Analysis
      • By Country
      • By Turbine Rating
      • By Axis
      • By Component
      • By Depth
    • Key Takeaways
  15. East Asia Floating Offshore Wind Energy Market Analysis 2020-2024 and Forecast 2025-2035, By Country
    • Historical Market Size Value (USD Mn) Trend Analysis By Market Taxonomy, 2020-2024
    • Market Size Value (USD Mn) Forecast By Market Taxonomy, 2025-2035
      • By Country
        • China
        • Japan
        • South Korea
      • By Turbine Rating
      • By Axis
      • By Component
      • By Depth
    • Market Attractiveness Analysis
      • By Country
      • By Turbine Rating
      • By Axis
      • By Component
      • By Depth
    • Key Takeaways
  16. South Asia and Pacific Floating Offshore Wind Energy Market Analysis 2020-2024 and Forecast 2025-2035, By Country
    • Historical Market Size Value (USD Mn) Trend Analysis By Market Taxonomy, 2020-2024
    • Market Size Value (USD Mn) Forecast By Market Taxonomy, 2025-2035
      • By Country
        • India
        • ASEAN
        • Australia & New Zealand
        • Rest of South Asia and Pacific
      • By Turbine Rating
      • By Axis
      • By Component
      • By Depth
    • Market Attractiveness Analysis
      • By Country
      • By Turbine Rating
      • By Axis
      • By Component
      • By Depth
    • Key Takeaways
  17. Middle East & Africa Floating Offshore Wind Energy Market Analysis 2020-2024 and Forecast 2025-2035, By Country
    • Historical Market Size Value (USD Mn) Trend Analysis By Market Taxonomy, 2020-2024
    • Market Size Value (USD Mn) Forecast By Market Taxonomy, 2025-2035
      • By Country
        • Kingdom of Saudi Arabia
        • Other GCC Countries
        • Turkiye
        • South Africa
        • Other African Union
        • Rest of Middle East & Africa
      • By Turbine Rating
      • By Axis
      • By Component
      • By Depth
    • Market Attractiveness Analysis
      • By Country
      • By Turbine Rating
      • By Axis
      • By Component
      • By Depth
    • Key Takeaways
  18. Key Countries Floating Offshore Wind Energy Market Analysis
    • USA
      • Pricing Analysis
      • Market Share Analysis, 2024
        • By Turbine Rating
        • By Axis
        • By Component
        • By Depth
    • Canada
      • Pricing Analysis
      • Market Share Analysis, 2024
        • By Turbine Rating
        • By Axis
        • By Component
        • By Depth
    • Mexico
      • Pricing Analysis
      • Market Share Analysis, 2024
        • By Turbine Rating
        • By Axis
        • By Component
        • By Depth
    • Brazil
      • Pricing Analysis
      • Market Share Analysis, 2024
        • By Turbine Rating
        • By Axis
        • By Component
        • By Depth
    • Chile
      • Pricing Analysis
      • Market Share Analysis, 2024
        • By Turbine Rating
        • By Axis
        • By Component
        • By Depth
    • Germany
      • Pricing Analysis
      • Market Share Analysis, 2024
        • By Turbine Rating
        • By Axis
        • By Component
        • By Depth
    • UK
      • Pricing Analysis
      • Market Share Analysis, 2024
        • By Turbine Rating
        • By Axis
        • By Component
        • By Depth
    • Italy
      • Pricing Analysis
      • Market Share Analysis, 2024
        • By Turbine Rating
        • By Axis
        • By Component
        • By Depth
    • Spain
      • Pricing Analysis
      • Market Share Analysis, 2024
        • By Turbine Rating
        • By Axis
        • By Component
        • By Depth
    • France
      • Pricing Analysis
      • Market Share Analysis, 2024
        • By Turbine Rating
        • By Axis
        • By Component
        • By Depth
    • India
      • Pricing Analysis
      • Market Share Analysis, 2024
        • By Turbine Rating
        • By Axis
        • By Component
        • By Depth
    • ASEAN
      • Pricing Analysis
      • Market Share Analysis, 2024
        • By Turbine Rating
        • By Axis
        • By Component
        • By Depth
    • Australia & New Zealand
      • Pricing Analysis
      • Market Share Analysis, 2024
        • By Turbine Rating
        • By Axis
        • By Component
        • By Depth
    • China
      • Pricing Analysis
      • Market Share Analysis, 2024
        • By Turbine Rating
        • By Axis
        • By Component
        • By Depth
    • Japan
      • Pricing Analysis
      • Market Share Analysis, 2024
        • By Turbine Rating
        • By Axis
        • By Component
        • By Depth
    • South Korea
      • Pricing Analysis
      • Market Share Analysis, 2024
        • By Turbine Rating
        • By Axis
        • By Component
        • By Depth
    • Russia
      • Pricing Analysis
      • Market Share Analysis, 2024
        • By Turbine Rating
        • By Axis
        • By Component
        • By Depth
    • Poland
      • Pricing Analysis
      • Market Share Analysis, 2024
        • By Turbine Rating
        • By Axis
        • By Component
        • By Depth
    • Hungary
      • Pricing Analysis
      • Market Share Analysis, 2024
        • By Turbine Rating
        • By Axis
        • By Component
        • By Depth
    • Kingdom of Saudi Arabia
      • Pricing Analysis
      • Market Share Analysis, 2024
        • By Turbine Rating
        • By Axis
        • By Component
        • By Depth
    • Turkiye
      • Pricing Analysis
      • Market Share Analysis, 2024
        • By Turbine Rating
        • By Axis
        • By Component
        • By Depth
    • South Africa
      • Pricing Analysis
      • Market Share Analysis, 2024
        • By Turbine Rating
        • By Axis
        • By Component
        • By Depth
  19. Market Structure Analysis
    • Competition Dashboard
    • Competition Benchmarking
    • Market Share Analysis of Top Players
      • By Regional
      • By Turbine Rating
      • By Axis
      • By Component
      • By Depth
  20. Competition Analysis
    • Competition Deep Dive
      • Company1
        • Overview
        • Product Portfolio
        • Profitability by Market Segments (Product/Age /Sales Channel/Region)
        • Sales Footprint
        • Strategy Overview
          • Marketing Strategy
          • Product Strategy
          • Channel Strategy
      • Company2
      • Company3
      • Company4
      • Company5
      • Company6
      • Company7
      • Company8
      • Company9
      • Company10
      • Company11
      • Company12
      • Company13
      • Company14
      • Company15
      • Company16
      • Company17
      • Company18
      • Company19
      • Company20
  21. Assumptions & Acronyms Used
  22. Research Methodology

List of Tables

  • Table 1: Global Floating Offshore Wind Energy Market Value (USD Mn) Forecast by Region, 2020-2035
  • Table 2: Global Floating Offshore Wind Energy Market Value (USD Mn) Forecast by Turbine Rating , 2020-2035
  • Table 3: Global Floating Offshore Wind Energy Market Value (USD Mn) Forecast by Axis, 2020-2035
  • Table 4: Global Floating Offshore Wind Energy Market Value (USD Mn) Forecast by Component, 2020-2035
  • Table 5: Global Floating Offshore Wind Energy Market Value (USD Mn) Forecast by Depth, 2020-2035
  • Table 6: North America Floating Offshore Wind Energy Market Value (USD Mn) Forecast by Country, 2020-2035
  • Table 7: North America Floating Offshore Wind Energy Market Value (USD Mn) Forecast by Turbine Rating , 2020-2035
  • Table 8: North America Floating Offshore Wind Energy Market Value (USD Mn) Forecast by Axis, 2020-2035
  • Table 9: North America Floating Offshore Wind Energy Market Value (USD Mn) Forecast by Component, 2020-2035
  • Table 10: North America Floating Offshore Wind Energy Market Value (USD Mn) Forecast by Depth, 2020-2035
  • Table 11: Latin America Floating Offshore Wind Energy Market Value (USD Mn) Forecast by Country, 2020-2035
  • Table 12: Latin America Floating Offshore Wind Energy Market Value (USD Mn) Forecast by Turbine Rating , 2020-2035
  • Table 13: Latin America Floating Offshore Wind Energy Market Value (USD Mn) Forecast by Axis, 2020-2035
  • Table 14: Latin America Floating Offshore Wind Energy Market Value (USD Mn) Forecast by Component, 2020-2035
  • Table 15: Latin America Floating Offshore Wind Energy Market Value (USD Mn) Forecast by Depth, 2020-2035
  • Table 16: Western Europe Floating Offshore Wind Energy Market Value (USD Mn) Forecast by Country, 2020-2035
  • Table 17: Western Europe Floating Offshore Wind Energy Market Value (USD Mn) Forecast by Turbine Rating , 2020-2035
  • Table 18: Western Europe Floating Offshore Wind Energy Market Value (USD Mn) Forecast by Axis, 2020-2035
  • Table 19: Western Europe Floating Offshore Wind Energy Market Value (USD Mn) Forecast by Component, 2020-2035
  • Table 20: Western Europe Floating Offshore Wind Energy Market Value (USD Mn) Forecast by Depth, 2020-2035
  • Table 21: Eastern Europe Floating Offshore Wind Energy Market Value (USD Mn) Forecast by Country, 2020-2035
  • Table 22: Eastern Europe Floating Offshore Wind Energy Market Value (USD Mn) Forecast by Turbine Rating , 2020-2035
  • Table 23: Eastern Europe Floating Offshore Wind Energy Market Value (USD Mn) Forecast by Axis, 2020-2035
  • Table 24: Eastern Europe Floating Offshore Wind Energy Market Value (USD Mn) Forecast by Component, 2020-2035
  • Table 25: Eastern Europe Floating Offshore Wind Energy Market Value (USD Mn) Forecast by Depth, 2020-2035
  • Table 26: East Asia Floating Offshore Wind Energy Market Value (USD Mn) Forecast by Country, 2020-2035
  • Table 27: East Asia Floating Offshore Wind Energy Market Value (USD Mn) Forecast by Turbine Rating , 2020-2035
  • Table 28: East Asia Floating Offshore Wind Energy Market Value (USD Mn) Forecast by Axis, 2020-2035
  • Table 29: East Asia Floating Offshore Wind Energy Market Value (USD Mn) Forecast by Component, 2020-2035
  • Table 30: East Asia Floating Offshore Wind Energy Market Value (USD Mn) Forecast by Depth, 2020-2035
  • Table 31: South Asia and Pacific Floating Offshore Wind Energy Market Value (USD Mn) Forecast by Country, 2020-2035
  • Table 32: South Asia and Pacific Floating Offshore Wind Energy Market Value (USD Mn) Forecast by Turbine Rating , 2020-2035
  • Table 33: South Asia and Pacific Floating Offshore Wind Energy Market Value (USD Mn) Forecast by Axis, 2020-2035
  • Table 34: South Asia and Pacific Floating Offshore Wind Energy Market Value (USD Mn) Forecast by Component, 2020-2035
  • Table 35: South Asia and Pacific Floating Offshore Wind Energy Market Value (USD Mn) Forecast by Depth, 2020-2035
  • Table 36: Middle East & Africa Floating Offshore Wind Energy Market Value (USD Mn) Forecast by Country, 2020-2035
  • Table 37: Middle East & Africa Floating Offshore Wind Energy Market Value (USD Mn) Forecast by Turbine Rating , 2020-2035
  • Table 38: Middle East & Africa Floating Offshore Wind Energy Market Value (USD Mn) Forecast by Axis, 2020-2035
  • Table 39: Middle East & Africa Floating Offshore Wind Energy Market Value (USD Mn) Forecast by Component, 2020-2035
  • Table 40: Middle East & Africa Floating Offshore Wind Energy Market Value (USD Mn) Forecast by Depth, 2020-2035

List of Figures

  • Figure 1: Global Floating Offshore Wind Energy Market Pricing Analysis
  • Figure 2: Global Floating Offshore Wind Energy Market Value (USD Mn) Forecast 2020–2035
  • Figure 3: Global Floating Offshore Wind Energy Market Value (USD Mn) Share and BPS Analysis by Region, 2025 and 2035
  • Figure 4: Global Floating Offshore Wind Energy Market Y-o-Y Growth Comparison by Region, 2025–2035
  • Figure 5: Global Floating Offshore Wind Energy Market Attractiveness Analysis by Region
  • Figure 6: North America Floating Offshore Wind Energy Market Incremental Dollar Opportunity, 2025–2035
  • Figure 7: Latin America Floating Offshore Wind Energy Market Incremental Dollar Opportunity, 2025–2035
  • Figure 8: Western Europe Floating Offshore Wind Energy Market Incremental Dollar Opportunity, 2025–2035
  • Figure 9: Eastern Europe Floating Offshore Wind Energy Market Incremental Dollar Opportunity, 2025–2035
  • Figure 10: East Asia Floating Offshore Wind Energy Market Incremental Dollar Opportunity, 2025–2035
  • Figure 11: South Asia and Pacific Floating Offshore Wind Energy Market Incremental Dollar Opportunity, 2025–2035
  • Figure 12: Middle East & Africa Floating Offshore Wind Energy Market Incremental Dollar Opportunity, 2025–2035
  • Figure 13: North America Floating Offshore Wind Energy Market Value Share and BPS Analysis by Country, 2025 and 2035
  • Figure 14: Latin America Floating Offshore Wind Energy Market Value Share and BPS Analysis by Country, 2025 and 2035
  • Figure 15: Western Europe Floating Offshore Wind Energy Market Value Share and BPS Analysis by Country, 2025 and 2035
  • Figure 16: Eastern Europe Floating Offshore Wind Energy Market Value Share and BPS Analysis by Country, 2025 and 2035
  • Figure 17: East Asia Floating Offshore Wind Energy Market Value Share and BPS Analysis by Country, 2025 and 2035
  • Figure 18: South Asia and Pacific Floating Offshore Wind Energy Market Value Share and BPS Analysis by Country, 2025 and 2035
  • Figure 19: Middle East & Africa Floating Offshore Wind Energy Market Value Share and BPS Analysis by Country, 2025 and 2035
  • Figure 20: Global Floating Offshore Wind Energy Market – Tier Structure Analysis
  • Figure 21: Global Floating Offshore Wind Energy Market – Company Share Analysis

Frequently Asked Questions

How big is the floating offshore wind energy market in 2025?

The global floating offshore wind energy market is estimated to be valued at USD 483.5 million in 2025.

What will be the size of floating offshore wind energy market in 2035?

The market size for the floating offshore wind energy market is projected to reach USD 7,476.1 million by 2035.

How much will be the floating offshore wind energy market growth between 2025 and 2035?

The floating offshore wind energy market is expected to grow at a 31.5% CAGR between 2025 and 2035.

What are the key product types in the floating offshore wind energy market?

The key product types in floating offshore wind energy market are ≤ 2 mw, >2 to 5 mw, >5 to 8 mw, >8 to 10 mw, >10 to 12 mw and > 12 mw.

Which axis segment to contribute significant share in the floating offshore wind energy market in 2025?

In terms of axis, horizontal (hawts) segment to command 61.7% share in the floating offshore wind energy market in 2025.

Explore Similar Insights

Future Market Insights

Floating Offshore Wind Energy Market