Hydrocarbon Tester Market Snapshot (2022 to 2032)

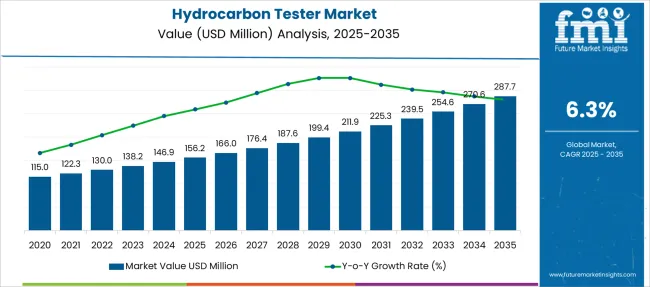
The global hydrocarbon tester market stood at around US$ 110 Million in 2021 and is slated to increase at a Y-o-Y growth rate of 4% to reach US$ 130 Million by 2022-end. Furthermore, from 2022 to 2032, the market is poised to expand at a CAGR of 6.3% to reach a valuation of US$ 240 Million.

Growing emphasis on the enforcement of occupational safety and health regulations regarding hydrocarbons by several regulatory organizations such as the Environmental Protection Agency is creating growth prospects for the global market for hydrocarbon testers.

Report Attribute Details
Estimated Base Year Value (2021) US$ 125 Million
Expected Market Value (2022) US$ 130 Million
Anticipated Forecast Value (2032) US$ 240 Million
Projected Growth Rate (2022 to 2032) 6.3% CAGR

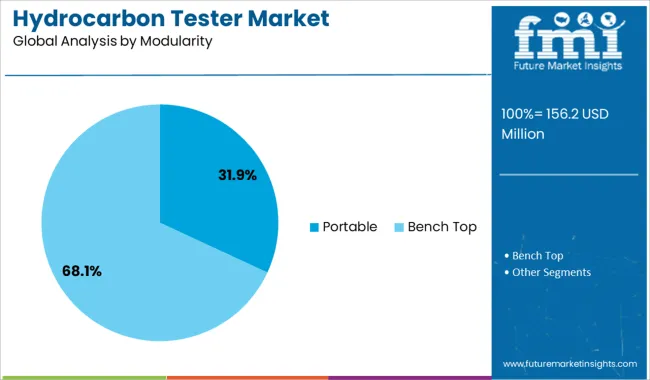
Although not all hydrocarbons are hazardous wastes, they are known to be common site contaminants. Total hydrocarbon analyzers are instruments used for sampling and analyzing the hydrocarbon family. These tools are available in both benchtop and portable configurations.

Hydrocarbon Testers are being used in a variety of applications for hydrocarbon analysis, including volatile organic compound monitoring, emission monitoring, solvent recovery, carbon absorbers, gas leak detection, and coating process control monitoring. This is expected to help the global market demand for total hydrocarbon analyzers.

A hydrocarbon tester is a device that analyses the concentration of hydrocarbon compounds to determine and improve the product quality of crude oil, diesel, fuel oil, jet fuel, gas oil, and petroleum products. The demand for hydrocarbon testers is increasing due to the high amount of hydrocarbon impurities associated with the production of petroleum, diesel, crude oil, and other products.

Toxins in these products can cause significant damage to machines or instruments, resulting in high demand for hydrocarbon testers to analyze the hydrocarbon. Because of the widespread use of petroleum, diesel, crude oil, and other products, the demand for hydrocarbon testers is rapidly increasing, contributing to the growth of the hydrocarbon tester market. Hydrocarbon testing and analysis aid oil and gas companies in identifying and analyzing hydrocarbon compound concentrations.

Hydrocarbon testers are also rapidly being adopted in metallurgy and geothermal exploration, which is fueling the global growth of the hydrocarbon tester market.

Don't pay for what you don't need

Customize your report by selecting specific countries or regions and save 30%!

Which are Some Prominent Drivers Spearheading Hydrocarbon Tester Market Growth?

Hydrocarbon processing, one of the world's most important industries, must adhere to a plethora of regulations, standards, and norms in order to run smoothly. Because the sector is required to maintain the highest safety standards, effective hydrocarbon analysis is critical for hydrocarbon processing in order to achieve a high level of productivity. The hydrocarbon testing market is extremely regulated, and certain standards must be followed when analyzing the sample.

The American Society of Testing and Materials (ASTM) is an international standard-setting organization that creates standards for a wide variety of materials and products. These standards are critical for various end-user companies such as petroleum refineries, aviation companies, and automotive, geological, and chemical processing plants that examine and process fuel oils to ensure quality. For instance, ASTM D7675 specifies a standard test method for determining total hydrocarbons in hydrogen using a hydrocarbon tester. These rigorous requirements in various geographies are ultimately propelling the hydrocarbon tester market forward. There is a high demand for simple hydrocarbon testers, which is causing manufacturers to release portable and simple hydrocarbon testers. The manufacturers' main strategy is to introduce advanced hydrocarbon testers with enhanced features.

Their primary focus is on introducing hydrocarbon testers with high sensitivity. For example, PetroSense Inc., one of the leading manufacturers of hydrocarbon testers, has introduced a portable hydrocarbon tester that has high sensitivity and analyses accurate and fast quantitative data for petroleum hydrocarbons in vapor and water. This type of advancement by manufacturers contributes to the global expansion of the hydrocarbon tester market.

What are the Challenges Faced by the Hydrocarbon Tester Industry?

The growing popularity of electric vehicles is causing a decline in sales of diesel and gasoline-powered vehicles. This has a significant negative impact on the hydrocarbon tester market, as the use of petrol and diesel engines is being replaced by electric batteries. During the forecast period, the growing prevalence of electric vehicles is expected to be a potential challenge for hydrocarbon testers.

Nikhil Kaitwade
Nikhil Kaitwade

Principal Consultant

Talk to Analyst

Find your sweet spots for generating winning opportunities in this market.

Why is Asia-Pacific emerging as an Opportunistic Hydrocarbon Tester Market?

Asia Pacific was the largest market for Hydrocarbon Tester. Geographically, countries with substantial inventions in the field of fossil fuels and geo analysis, such as Kuwait, China, and other Gulf countries, hold the major market share in the hydrocarbon tester market. The expansion of the hydrocarbon tester market is being driven by the increased production of energy sources and the demand for refined products. As these countries' fossil fuel production increases, so do the sales for refinement of these products.

To ensure safe and optimized processing, a wide range of hydrocarbon analysis measurements and analyzing devices such as flame ionization detectors, catalytic sensors, photo-ionization, gas chromatographs, infrared sensors, and others are required. As a result, rapid growth in the hydrocarbon processing industry in prominent economies such as China and India is expected to create lucrative growth opportunities for the hydrocarbon tester market. As a result, potential growth opportunities in the adoption of hydrocarbon testers in various industries are expected. The hydrocarbon tester market is expected to grow at a rapid pace as a result of several government initiatives in the Asia Pacific.
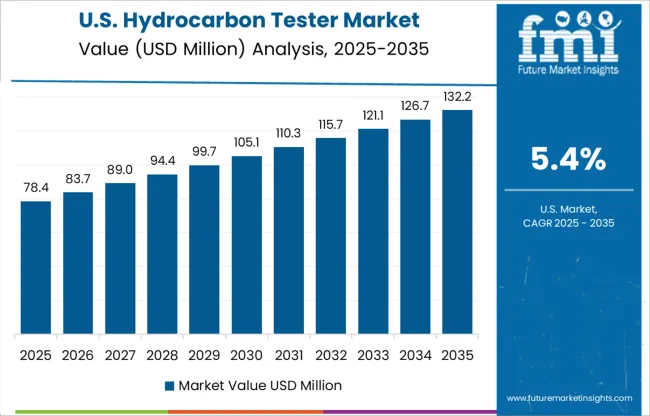
How is North America Contributing to Growth of the Hydrocarbon Tester Market?

According to Future Market Insights, North America is expected to grow at a rapid CAGR in the global hydrocarbon tester market between 2022 and 2032.

Owing to the attributes such as integrated systems, flexible temperature ranges, and precision analysis, hydrocarbon testers are finding a wide range of applications in environmental monitoring, ethylene production, petroleum refining, and other sectors.
Get the data you need at a Fraction of the cost

Personalize your report by choosing insights you need
and save 40%!

Market Competition

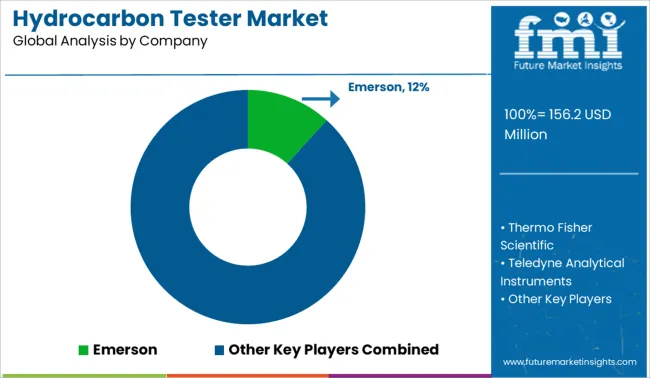
Some of the key participants present in the global Hydrocarbon Tester market include Emerson, Thermo Fisher Scientific, Teledyne Analytical Instruments, SICK AG, Agilent Technologies, Inc., MKS Instruments, PerkinElmer, J.U.M. Engineering GmbH, Galvanic, VIG Industries, Inc., Gow-Mac Instrument Co., Shimadzu Corporation, MOCON Inc., Buck Scientific., among others.

The market is highly concentrated owing to the existence of such a large number of participants and the escalating product launches with advanced connectivity and multi-functional features.

  • In May 2022, Thermo Fisher Scientific, a global leader in serving science, and Qatar Genome Program (QGP), a member of Qatar Foundation (QF), collaborated to accelerate genomic research and clinical applications of predictive genomics in Qatar as a step toward broadening the gains of precision medicine across Arab populations globally.
  • In June 2022, Agilent has Introduced New Oligonucleotide Analysis Software for Biopharma Research.

Report Scope

Report Attribute Details
Growth Rate CAGR of 6.3% from 2022 to 2032
Market Value in 2022 US$ 130 Million
Market Value in 2032 US$ 240 Million
Base Year for Estimation 2021
Historical Data 2017 to 2021
Forecast Period 2022 to 2032
Quantitative Units Revenue in US$ Million and CAGR from 2022 to 2032
Report Coverage Revenue Forecast, Volume Forecast, Company Ranking, Competitive Landscape, Growth Factors, Trends, and Pricing Analysis
Segments Covered
  • Sample
  • End Use
  • Modularity
  • Region
Regions Covered
  • North America
  • Latin America
  • Europe
  • East Asia
  • South Asia & Pacific
  • Middle East and Africa
Key Countries Profiled
  • USA
  • Canada
  • Mexico
  • Brazil
  • Germany
  • Italy
  • France
  • United Kingdom
  • Spain
  • BENELUX
  • Russia
  • China
  • Japan
  • South Korea
  • India
  • ASEAN
  • Australia & New Zealand
  • GCC Countries
  • Turkey
  • South Africa
Key Companies Profiled
  • Emerson
  • Thermo Fisher Scientific
  • Teledyne Analytical Instruments
  • SICK AG
  • Agilent Technologies, Inc.
  • MKS Instruments
  • PerkinElmer
  • J.U.M. Engineering GmbH
  • Galvanic
  • VIG Industries, Inc.
  • Gow-Mac Instrument Co.
  • Shimadzu Corporation
  • MOCON Inc.
  • Buck Scientific
Customization Available Upon Request

Key Segments Profiled in the Hydrocarbon Tester Industry Survey

By Sample:

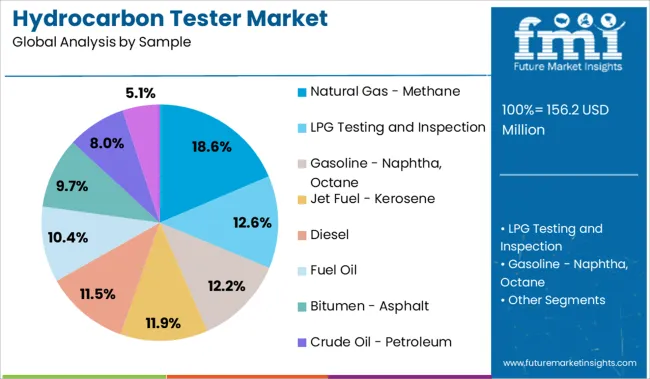
  • Natural Gas (Methane)
  • LPG Testing and Inspection (LPG)
  • Gasoline (Naphtha, Octane)
  • Jet Fuel (kerosene)
  • Diesel
  • Fuel Oil
  • Bitumen (Asphalt)
  • Crude Oil (Petroleum)
  • Other Samples

By End Use:

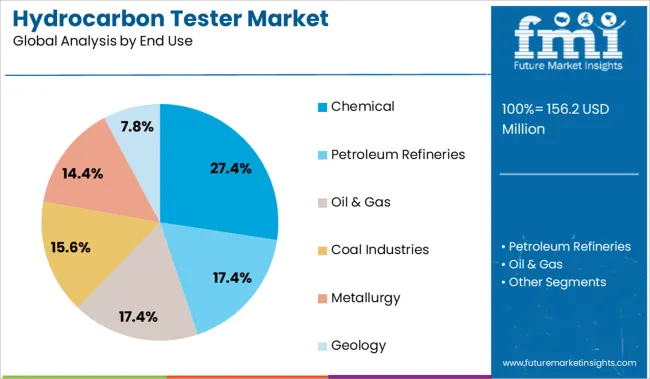
  • Chemical Industry
  • Petroleum Refineries
  • Oil & Gas Industry
  • Coal industries
  • Metallurgy
  • Geology

By Modularity:

  • Portable
  • Benchtop

By Region:

  • North America
  • Latin America
  • Europe
  • East Asia
  • South Asia and the Pacific
  • Middle East & Africa

Frequently Asked Questions

What is the anticipated growth of the hydrocarbon tester market until 2032?

FMI projects the global Hydrocarbon Tester market to expand at a 6.3% value CAGR by 2032

Which region is forecast to be the most lucrative for hydrocarbon tester market growth?

Asia Pacific is expected to be the most opportunistic Hydrocarbon Tester market, expanding at a 6% CAGR

Which are some prominent hydrocarbon tester manufacturers?

Emerson, Thermo Fisher Scientific, SICK AG, Agilent Technologies, Inc., MKS Instruments, PerkinElmer, and Teledyne Analytical Instruments are some prominent Hydrocarbon Tester manufacturers.

Table of Content
1. Executive Summary | Hydrocarbon Tester Market

    1.1. Global Market Outlook

    1.2. Demand-side Trends

    1.3. Supply-side Trends

    1.4. Technology Roadmap Analysis

    1.5. Analysis and Recommendations

2. Market Overview

    2.1. Market Coverage / Taxonomy

    2.2. Market Definition / Scope / Limitations

3. Market Background

    3.1. Market Dynamics

        3.1.1. Drivers

        3.1.2. Restraints

        3.1.3. Opportunity 

        3.1.4. Trends

    3.2. Scenario Forecast

        3.2.1. Demand in Optimistic Scenario

        3.2.2. Demand in Likely Scenario

        3.2.3. Demand in Conservative Scenario

    3.3. Opportunity Map Analysis

    3.4. Product Life Cycle Analysis

    3.5. Supply Chain Analysis

        3.5.1. Supply Side Participants and Their Roles

            3.5.1.1. Producers

            3.5.1.2. Mid-Level Participants (Traders/ Agents/ Brokers)

            3.5.1.3. Wholesalers and Distributors

        3.5.2. Value Added and Value Created at Node in the Supply Chain

        3.5.3. List of Raw Material Suppliers

        3.5.4. List of Existing and Potential Buyers

    3.6. Investment Feasibility Matrix

    3.7. Value Chain Analysis

        3.7.1. Profit Margin Analysis

        3.7.2. Wholesalers and Distributors

        3.7.3. Retailers

    3.8. PESTLE and Porter’s Analysis

    3.9. Regulatory Landscape

        3.9.1. By Key Regions

        3.9.2. By Key Countries

    3.10. Regional Parent Market Outlook

    3.11. Production and Consumption Statistics

    3.12. Import and Export Statistics

4. Global Market Analysis 2017 to 2021 and Forecast, 2022 to 2032

    4.1. Historical Market Size Value (US$ Million) & Volume (Units) Analysis, 2017 to 2021

    4.2. Current and Future Market Size Value (US$ Million) & Volume (Units) Projections, 2022 to 2032

        4.2.1. Y-o-Y Growth Trend Analysis

        4.2.2. Absolute $ Opportunity Analysis

5. Global Market Analysis 2017 to 2021 and Forecast 2022 to 2032, By Sample

    5.1. Introduction / Key Findings

    5.2. Historical Market Size Value (US$ Million) & Volume (Units) Analysis By Sample, 2017 to 2021

    5.3. Current and Future Market Size Value (US$ Million) & Volume (Units) Analysis and Forecast By Sample, 2022 to 2032

        5.3.1. Natural Gas - Methane

        5.3.2. LPG Testing and Inspection

        5.3.3. Gasoline - Naphtha, Octane

        5.3.4. Jet Fuel - Kerosene

        5.3.5. Diesel

        5.3.6. Fuel Oil

        5.3.7. Bitumen - Asphalt

        5.3.8. Crude Oil - Petroleum

        5.3.9. Other Samples

    5.4. Y-o-Y Growth Trend Analysis By Sample, 2017 to 2021

    5.5. Absolute $ Opportunity Analysis By Sample, 2022 to 2032

6. Global Market Analysis 2017 to 2021 and Forecast 2022 to 2032, By End Use

    6.1. Introduction / Key Findings

    6.2. Historical Market Size Value (US$ Million) & Volume (Units) Analysis By End Use, 2017 to 2021

    6.3. Current and Future Market Size Value (US$ Million) & Volume (Units) Analysis and Forecast By End Use, 2022 to 2032

        6.3.1. Chemical

        6.3.2. Petroleum Refineries

        6.3.3. Oil & Gas

        6.3.4. Coal industries

        6.3.5. Metallurgy

        6.3.6. Geology

    6.4. Y-o-Y Growth Trend Analysis By End Use, 2017 to 2021

    6.5. Absolute $ Opportunity Analysis By End Use, 2022 to 2032

7. Global Market Analysis 2017 to 2021 and Forecast 2022 to 2032, By Modularity

    7.1. Introduction / Key Findings

    7.2. Historical Market Size Value (US$ Million) & Volume (Units) Analysis By Modularity, 2017 to 2021

    7.3. Current and Future Market Size Value (US$ Million) & Volume (Units) Analysis and Forecast By Modularity, 2022 to 2032

        7.3.1. Portable

        7.3.2. Bench Top

    7.4. Y-o-Y Growth Trend Analysis By Modularity, 2017 to 2021

    7.5. Absolute $ Opportunity Analysis By Modularity, 2022 to 2032

8. Global Market Analysis 2017 to 2021 and Forecast 2022 to 2032, By Region

    8.1. Introduction

    8.2. Historical Market Size Value (US$ Million) & Volume (Units) Analysis By Region, 2017 to 2021

    8.3. Current Market Size Value (US$ Million) & Volume (Units) Analysis and Forecast By Region, 2022 to 2032

        8.3.1. North America

        8.3.2. Latin America

        8.3.3. Europe

        8.3.4. East Asia

        8.3.5. South Asia & Pacific

        8.3.6. Middle East and Africa(MEA)

    8.4. Market Attractiveness Analysis By Region

9. North America Market Analysis 2017 to 2021 and Forecast 2022 to 2032, By Country

    9.1. Historical Market Size Value (US$ Million) & Volume (Units) Trend Analysis By Market Taxonomy, 2017 to 2021

    9.2. Market Size Value (US$ Million) & Volume (Units) Forecast By Market Taxonomy, 2022 to 2032

        9.2.1. By Country

            9.2.1.1. USA

            9.2.1.2. Canada

        9.2.2. By Sample

        9.2.3. By End Use

        9.2.4. By Modularity

    9.3. Market Attractiveness Analysis

        9.3.1. By Country

        9.3.2. By Sample

        9.3.3. By End Use

        9.3.4. By Modularity

    9.4. Key Takeaways

10. Latin America Market Analysis 2017 to 2021 and Forecast 2022 to 2032, By Country

    10.1. Historical Market Size Value (US$ Million) & Volume (Units) Trend Analysis By Market Taxonomy, 2017 to 2021

    10.2. Market Size Value (US$ Million) & Volume (Units) Forecast By Market Taxonomy, 2022 to 2032

        10.2.1. By Country

            10.2.1.1. Mexico

            10.2.1.2. Brazil

            10.2.1.3. Rest of Latin America

        10.2.2. By Sample

        10.2.3. By End Use

        10.2.4. By Modularity

    10.3. Market Attractiveness Analysis

        10.3.1. By Country

        10.3.2. By Sample

        10.3.3. By End Use

        10.3.4. By Modularity

    10.4. Key Takeaways

11. Europe Market Analysis 2017 to 2021 and Forecast 2022 to 2032, By Country

    11.1. Historical Market Size Value (US$ Million) & Volume (Units) Trend Analysis By Market Taxonomy, 2017 to 2021

    11.2. Market Size Value (US$ Million) & Volume (Units) Forecast By Market Taxonomy, 2022 to 2032

        11.2.1. By Country

            11.2.1.1. Germany

            11.2.1.2. Italy

            11.2.1.3. France

            11.2.1.4. United Kingdom

            11.2.1.5. Spain

            11.2.1.6. BENELUX

            11.2.1.7. Russia

            11.2.1.8. Rest of Europe

        11.2.2. By Sample

        11.2.3. By End Use

        11.2.4. By Modularity

    11.3. Market Attractiveness Analysis

        11.3.1. By Country

        11.3.2. By Sample

        11.3.3. By End Use

        11.3.4. By Modularity

    11.4. Key Takeaways

12. East Asia Market Analysis 2017 to 2021 and Forecast 2022 to 2032, By Country

    12.1. Historical Market Size Value (US$ Million) & Volume (Units) Trend Analysis By Market Taxonomy, 2017 to 2021

    12.2. Market Size Value (US$ Million) & Volume (Units) Forecast By Market Taxonomy, 2022 to 2032

        12.2.1. By Country

            12.2.1.1. China

            12.2.1.2. Japan

            12.2.1.3. South Korea

        12.2.2. By Sample

        12.2.3. By End Use

        12.2.4. By Modularity

    12.3. Market Attractiveness Analysis

        12.3.1. By Country

        12.3.2. By Sample

        12.3.3. By End Use

        12.3.4. By Modularity

    12.4. Key Takeaways

13. South Asia & Pacific Market Analysis 2017 to 2021 and Forecast 2022 to 2032, By Country

    13.1. Historical Market Size Value (US$ Million) & Volume (Units) Trend Analysis By Market Taxonomy, 2017 to 2021

    13.2. Market Size Value (US$ Million) & Volume (Units) Forecast By Market Taxonomy, 2022 to 2032

        13.2.1. By Country

            13.2.1.1. India

            13.2.1.2. ASEAN

            13.2.1.3. Australia and New Zealand

            13.2.1.4. Rest of South Asia & Pacific

        13.2.2. By Sample

        13.2.3. By End Use

        13.2.4. By Modularity

    13.3. Market Attractiveness Analysis

        13.3.1. By Country

        13.3.2. By Sample

        13.3.3. By End Use

        13.3.4. By Modularity

    13.4. Key Takeaways

14. MEA Market Analysis 2017 to 2021 and Forecast 2022 to 2032, By Country

    14.1. Historical Market Size Value (US$ Million) & Volume (Units) Trend Analysis By Market Taxonomy, 2017 to 2021

    14.2. Market Size Value (US$ Million) & Volume (Units) Forecast By Market Taxonomy, 2022 to 2032

        14.2.1. By Country

            14.2.1.1. GCC Countries

            14.2.1.2. Turkey

            14.2.1.3. South Africa

            14.2.1.4. Rest of Middle East and Africa(MEA)

        14.2.2. By Sample

        14.2.3. By End Use

        14.2.4. By Modularity

    14.3. Market Attractiveness Analysis

        14.3.1. By Country

        14.3.2. By Sample

        14.3.3. By End Use

        14.3.4. By Modularity

    14.4. Key Takeaways

15. Key Countries Market Analysis

    15.1. USA

        15.1.1. Pricing Analysis

        15.1.2. Market Share Analysis, 2021

            15.1.2.1. By Sample

            15.1.2.2. By End Use

            15.1.2.3. By Modularity

    15.2. Canada

        15.2.1. Pricing Analysis

        15.2.2. Market Share Analysis, 2021

            15.2.2.1. By Sample

            15.2.2.2. By End Use

            15.2.2.3. By Modularity

    15.3. Mexico

        15.3.1. Pricing Analysis

        15.3.2. Market Share Analysis, 2021

            15.3.2.1. By Sample

            15.3.2.2. By End Use

            15.3.2.3. By Modularity

    15.4. Brazil

        15.4.1. Pricing Analysis

        15.4.2. Market Share Analysis, 2021

            15.4.2.1. By Sample

            15.4.2.2. By End Use

            15.4.2.3. By Modularity

    15.5. Germany

        15.5.1. Pricing Analysis

        15.5.2. Market Share Analysis, 2021

            15.5.2.1. By Sample

            15.5.2.2. By End Use

            15.5.2.3. By Modularity

    15.6. Italy

        15.6.1. Pricing Analysis

        15.6.2. Market Share Analysis, 2021

            15.6.2.1. By Sample

            15.6.2.2. By End Use

            15.6.2.3. By Modularity

    15.7. France

        15.7.1. Pricing Analysis

        15.7.2. Market Share Analysis, 2021

            15.7.2.1. By Sample

            15.7.2.2. By End Use

            15.7.2.3. By Modularity

    15.8. United Kingdom

        15.8.1. Pricing Analysis

        15.8.2. Market Share Analysis, 2021

            15.8.2.1. By Sample

            15.8.2.2. By End Use

            15.8.2.3. By Modularity

    15.9. Spain

        15.9.1. Pricing Analysis

        15.9.2. Market Share Analysis, 2021

            15.9.2.1. By Sample

            15.9.2.2. By End Use

            15.9.2.3. By Modularity

    15.10. BENELUX

        15.10.1. Pricing Analysis

        15.10.2. Market Share Analysis, 2021

            15.10.2.1. By Sample

            15.10.2.2. By End Use

            15.10.2.3. By Modularity

    15.11. Russia

        15.11.1. Pricing Analysis

        15.11.2. Market Share Analysis, 2021

            15.11.2.1. By Sample

            15.11.2.2. By End Use

            15.11.2.3. By Modularity

    15.12. China

        15.12.1. Pricing Analysis

        15.12.2. Market Share Analysis, 2021

            15.12.2.1. By Sample

            15.12.2.2. By End Use

            15.12.2.3. By Modularity

    15.13. Japan

        15.13.1. Pricing Analysis

        15.13.2. Market Share Analysis, 2021

            15.13.2.1. By Sample

            15.13.2.2. By End Use

            15.13.2.3. By Modularity

    15.14. South Korea

        15.14.1. Pricing Analysis

        15.14.2. Market Share Analysis, 2021

            15.14.2.1. By Sample

            15.14.2.2. By End Use

            15.14.2.3. By Modularity

    15.15. India

        15.15.1. Pricing Analysis

        15.15.2. Market Share Analysis, 2021

            15.15.2.1. By Sample

            15.15.2.2. By End Use

            15.15.2.3. By Modularity

    15.16. ASEAN

        15.16.1. Pricing Analysis

        15.16.2. Market Share Analysis, 2021

            15.16.2.1. By Sample

            15.16.2.2. By End Use

            15.16.2.3. By Modularity

    15.17. Australia and New Zealand

        15.17.1. Pricing Analysis

        15.17.2. Market Share Analysis, 2021

            15.17.2.1. By Sample

            15.17.2.2. By End Use

            15.17.2.3. By Modularity

    15.18. GCC Countries

        15.18.1. Pricing Analysis

        15.18.2. Market Share Analysis, 2021

            15.18.2.1. By Sample

            15.18.2.2. By End Use

            15.18.2.3. By Modularity

    15.19. Turkey

        15.19.1. Pricing Analysis

        15.19.2. Market Share Analysis, 2021

            15.19.2.1. By Sample

            15.19.2.2. By End Use

            15.19.2.3. By Modularity

    15.20. South Africa

        15.20.1. Pricing Analysis

        15.20.2. Market Share Analysis, 2021

            15.20.2.1. By Sample

            15.20.2.2. By End Use

            15.20.2.3. By Modularity

16. Market Structure Analysis

    16.1. Competition Dashboard

    16.2. Competition Benchmarking

    16.3. Market Share Analysis of Top Players

        16.3.1. By Regional

        16.3.2. By Sample

        16.3.3. By End Use

        16.3.4. By Modularity

17. Competition Analysis

    17.1. Competition Deep Dive

        17.1.1. Emerson

            17.1.1.1. Overview

            17.1.1.2. Product Portfolio

            17.1.1.3. Profitability by Market Segments

            17.1.1.4. Sales Footprint

            17.1.1.5. Strategy Overview

                17.1.1.5.1. Marketing Strategy

                17.1.1.5.2. Product Strategy

                17.1.1.5.3. Channel Strategy

        17.1.2. Thermo Fisher Scientific

            17.1.2.1. Overview

            17.1.2.2. Product Portfolio

            17.1.2.3. Profitability by Market Segments

            17.1.2.4. Sales Footprint

            17.1.2.5. Strategy Overview

                17.1.2.5.1. Marketing Strategy

                17.1.2.5.2. Product Strategy

                17.1.2.5.3. Channel Strategy

        17.1.3. Teledyne Analytical Instruments

            17.1.3.1. Overview

            17.1.3.2. Product Portfolio

            17.1.3.3. Profitability by Market Segments

            17.1.3.4. Sales Footprint

            17.1.3.5. Strategy Overview

                17.1.3.5.1. Marketing Strategy

                17.1.3.5.2. Product Strategy

                17.1.3.5.3. Channel Strategy

        17.1.4. SICK AG

            17.1.4.1. Overview

            17.1.4.2. Product Portfolio

            17.1.4.3. Profitability by Market Segments

            17.1.4.4. Sales Footprint

            17.1.4.5. Strategy Overview

                17.1.4.5.1. Marketing Strategy

                17.1.4.5.2. Product Strategy

                17.1.4.5.3. Channel Strategy

        17.1.5. Agilent Technologies, Inc.

            17.1.5.1. Overview

            17.1.5.2. Product Portfolio

            17.1.5.3. Profitability by Market Segments

            17.1.5.4. Sales Footprint

            17.1.5.5. Strategy Overview

                17.1.5.5.1. Marketing Strategy

                17.1.5.5.2. Product Strategy

                17.1.5.5.3. Channel Strategy

        17.1.6. MKS Instruments

            17.1.6.1. Overview

            17.1.6.2. Product Portfolio

            17.1.6.3. Profitability by Market Segments

            17.1.6.4. Sales Footprint

            17.1.6.5. Strategy Overview

                17.1.6.5.1. Marketing Strategy

                17.1.6.5.2. Product Strategy

                17.1.6.5.3. Channel Strategy

        17.1.7. PerkinElmer

            17.1.7.1. Overview

            17.1.7.2. Product Portfolio

            17.1.7.3. Profitability by Market Segments

            17.1.7.4. Sales Footprint

            17.1.7.5. Strategy Overview

                17.1.7.5.1. Marketing Strategy

                17.1.7.5.2. Product Strategy

                17.1.7.5.3. Channel Strategy

        17.1.8. J.U.M. Engineering GmbH

            17.1.8.1. Overview

            17.1.8.2. Product Portfolio

            17.1.8.3. Profitability by Market Segments

            17.1.8.4. Sales Footprint

            17.1.8.5. Strategy Overview

                17.1.8.5.1. Marketing Strategy

                17.1.8.5.2. Product Strategy

                17.1.8.5.3. Channel Strategy

        17.1.9. Galvanic

            17.1.9.1. Overview

            17.1.9.2. Product Portfolio

            17.1.9.3. Profitability by Market Segments

            17.1.9.4. Sales Footprint

            17.1.9.5. Strategy Overview

                17.1.9.5.1. Marketing Strategy

                17.1.9.5.2. Product Strategy

                17.1.9.5.3. Channel Strategy

        17.1.10. VIG Industries, Inc.

            17.1.10.1. Overview

            17.1.10.2. Product Portfolio

            17.1.10.3. Profitability by Market Segments

            17.1.10.4. Sales Footprint

            17.1.10.5. Strategy Overview

                17.1.10.5.1. Marketing Strategy

                17.1.10.5.2. Product Strategy

                17.1.10.5.3. Channel Strategy

        17.1.11. Gow-Mac Instrument Co.

            17.1.11.1. Overview

            17.1.11.2. Product Portfolio

            17.1.11.3. Profitability by Market Segments

            17.1.11.4. Sales Footprint

            17.1.11.5. Strategy Overview

                17.1.11.5.1. Marketing Strategy

                17.1.11.5.2. Product Strategy

                17.1.11.5.3. Channel Strategy

        17.1.12. Shimadzu Corporation

            17.1.12.1. Overview

            17.1.12.2. Product Portfolio

            17.1.12.3. Profitability by Market Segments

            17.1.12.4. Sales Footprint

            17.1.12.5. Strategy Overview

                17.1.12.5.1. Marketing Strategy

                17.1.12.5.2. Product Strategy

                17.1.12.5.3. Channel Strategy

        17.1.13. MOCON Inc.

            17.1.13.1. Overview

            17.1.13.2. Product Portfolio

            17.1.13.3. Profitability by Market Segments

            17.1.13.4. Sales Footprint

            17.1.13.5. Strategy Overview

                17.1.13.5.1. Marketing Strategy

                17.1.13.5.2. Product Strategy

                17.1.13.5.3. Channel Strategy

        17.1.14. Buck Scientific

            17.1.14.1. Overview

            17.1.14.2. Product Portfolio

            17.1.14.3. Profitability by Market Segments

            17.1.14.4. Sales Footprint

            17.1.14.5. Strategy Overview

                17.1.14.5.1. Marketing Strategy

                17.1.14.5.2. Product Strategy

                17.1.14.5.3. Channel Strategy

18. Assumptions & Acronyms Used

19. Research Methodology
Recommendations

Testing Equipment

Ultrasonic Pulse Velocity Tester Market

December 2018

REP-GB-7924

165 pages

Explore Testing Equipment Insights

View Reports
Future Market Insights

Hydrocarbon Tester Market