
- Market Size (2026)
- USD 316.1 Mn
- Forecast (2036)
- USD 714.7 Mn
- CAGR (2026 to 2036)
- 8.5%
How big is the IMSI Catcher Market in 2026?
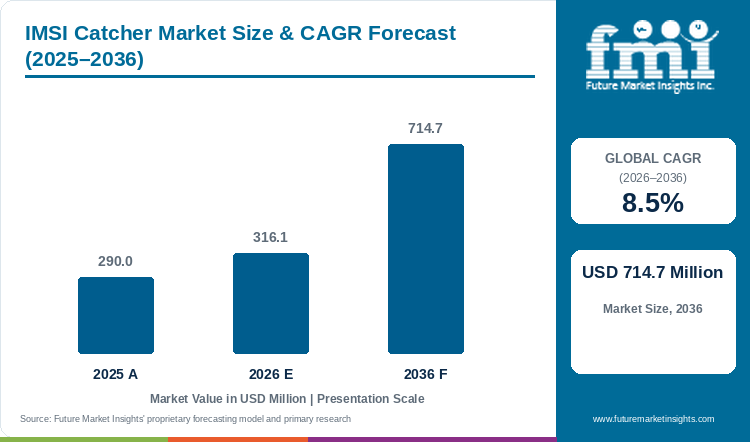
FMI projects the global IMSI catcher market at USD 714.7 million in 2036, a 8.5% CAGR over 2026 to 2036. The market was valued at USD 290.0 million in 2025 and is estimated at USD 316.1 million in 2026.
IMSI Catcher Market Size and Forecast
Table 1: IMSI Catcher Market Size and Forecast
| Market size and forecast | Value |
|---|---|
| Market size in 2025 | USD 290.0 million |
| Estimated market size in 2026 | USD 316.1 million |
| Projected market size by 2036 | USD 714.7 million |
| CAGR from 2026 to 2036 | 8.5% |
Source: Future Market Insights analysis of the IMSI catcher market, 2026.
Replacement expenditure is a more useful demand indicator than the number of agencies owning equipment. Berlin's September 2025 parliamentary budget material separated a planned existing-system upgrade from a vehicle-based successor acquisition intended for 2026. This is a concrete example of an existing customer budgeting for technological continuity.
At the same time, network privacy protections change what vendors can credibly promise. NIST's March 2026 paper explains the privacy value of concealed subscriber identifiers in appropriately configured 5G networks. Purchasing therefore depends on verified compatibility and authorized use, with clear limits on the functions included in a contract. The adjacent lawful interception market covers a wider set of network-based capabilities. The central commercial question is whether an agency funds a compliant replacement package, including support, when its existing hardware no longer matches the local network environment.
Key Market Trends & Insights
- 5G is the growth category in FMI's network outlook. The forecast value of the 5G category rises from USD 79.0 million in 2026 to USD 356.5 million in 2036, a 16.3% CAGR.
- Legislative attention keeps authorization and accountability central to procurement. US Senate bill S. 2522, introduced on 29 July 2025, would regulate cell-site simulator use.
- Adjacent 5G measurement and security products are advancing. Rohde & Schwarz announced enhancements to 5G monitoring, testing and security offerings on 12 February 2025.
Regional Highlights
- India, Saudi Arabia and the United Arab Emirates are gaining share of global revenue. FMI's 2036 shares are India 9.2% (from 8.0%), Saudi Arabia 5.8% (from 5.0%) and the United Arab Emirates 5.8% (from 5.0%).
- Share slips for the United States, Russia and the United Kingdom as revenue grows. Projected 2036 shares are the United States 24.9% (from 26.0%), Russia 3.2% (from 4.0%) and the United Kingdom 5.2% (from 6.0%).
Analyst Perspective
“The most durable contracts will connect equipment renewal to a defined network transition and a clear authorization framework. A broad technology label has limited commercial value if acceptance tests, support responsibilities and data controls remain ambiguous. Suppliers also need to distinguish active collection products from defensive monitoring and other adjacent tools when presenting their portfolios.”
- Sudip Saha, Principal Consultant, FMI
How is the IMSI Catcher Market segmented?
- By platform: Portable and Handheld. Vehicle-Mounted. Airborne and Fixed.
- By network technology: 2G. 3G. 4G. 5G.
- By end user: Law Enforcement. Intelligence and Defence. Border and Homeland Security.
- By region: North America. Latin America. Western Europe. Eastern Europe. East Asia. South Asia. Middle East, and Rest of world.
Why does the Portable and Handheld segment lead by Platform in the IMSI Catcher Market in 2026?
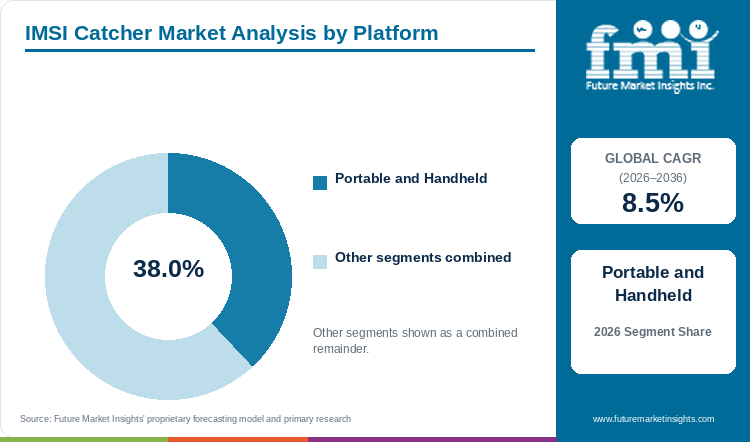
The Portable and Handheld segment holds 38.0% of the IMSI Catcher Market by platform in 2026.
The lead of portable equipment is relatively narrow. Vehicle-Mounted revenue is only four percentage points lower in 2026. This distribution argues against treating compact equipment as the only commercially significant format. A supplier's platform choice changes the integration boundary and the support arrangements included in the sale.
Septier publicly describes a portfolio spanning field-deployable products and large network-based installations. Its corporate site identifies law enforcement, intelligence, homeland security and emergency services among the markets it serves. The portfolio breadth supports a distinction between compact products and larger installations.
FMI forecasts Portable and Handheld revenue of USD 280.0 million in 2036, with an 8.8% CAGR over 2026 to 2036. Its share reaches 39.2%, so Portable and Handheld keeps its lead. Vehicle-Mounted products still account for 32.0% in 2036. The practical supplier implication is to quote portable systems against their own acceptance and service requirements.
Vehicle-Mounted and Airborne and Fixed together hold the remaining 62.0% by platform.
Table 2: Platform, 2026 Share
| Leading Share | 2026 market share |
|---|---|
| Portable and Handheld | 38.0% |
| All Other Segments Combined Share | 62.0% |
Source: Future Market Insights analysis of the IMSI catcher market, 2026.
Why does the 4G segment lead by Network Technology in the IMSI Catcher Market in 2026?
The 4G segment holds 35.0% of the IMSI Catcher Market by network technology in 2026.
The 2026 technology mix contains a substantial legacy component. Both 2G and 3G represent 20.0% of revenue, alongside 4G's 35.0%. Purchases consequently span several network generations.
The structural change occurs during the following decade. Revenue associated with 2G falls to USD 44.5 million by 2036, corresponding to a negative 3.5% CAGR. 5G revenue expands at 16.3% annually.
NIST identifies subscriber-identity protection as an important 5G privacy capability whose deployment depends on operator choices. For suppliers, the relevant market opportunity is supported adaptation to an authorized customer's environment. Changes considered in the 5G security market also affect product acceptance and the credibility of commercial claims. Contracts that define supported configurations and future support obligations have a clearer value proposition than an unqualified generation label.
2G, 3G and 5G together hold the remaining 65.0% by network technology.
Table 3: Network Technology, 2026 Share
| Leading Share | 2026 market share |
|---|---|
| 4G | 35.0% |
| All Other Segments Combined Share | 65.0% |
Source: Future Market Insights analysis of the IMSI catcher market, 2026.
Why does the Law Enforcement segment lead by End User in the IMSI Catcher Market in 2026?
The Law Enforcement segment holds 46.0% of the IMSI Catcher Market by end user in 2026.
Law Enforcement leads the categories, although the other two categories together represent a majority of spending. FMI forecasts USD 312.5 million of law-enforcement revenue in 2036, at an 8.0% CAGR. Its share declines to 43.7% as Intelligence and Defence expands more quickly to USD 298.0 million.
Public policy makes this segment commercially different from general communications equipment. The US Department of Justice requires trained and appropriately supervised users. Its policy generally requires a probable-cause warrant, subject to specified exceptions, and prohibits its covered systems from collecting communications content. These provisions apply within the policy's stated jurisdiction and scope.
For a vendor, the purchase is therefore connected to the customer's authorized workflow and continuing accountability. Training, documented functional boundaries and support for required records affect the completeness of the offer. FMI expects competition in this category to depend on credible delivery into a defined institutional setting, with the contract reflecting its legal and technical limits.
Intelligence and Defence and Border and Homeland Security together hold the remaining 54.0% by end user.
Table 4: End User, 2026 Share
| Leading Share | 2026 market share |
|---|---|
| Law Enforcement | 46.0% |
| All Other Segments Combined Share | 54.0% |
Source: Future Market Insights analysis of the IMSI catcher market, 2026.
What are the key drivers restraints and opportunities?
Existing equipment replacement supports demand, while changing network protections and authorization requirements limit easy substitution. Suppliers have opportunities in clearly scoped upgrades and continuing support for authorized public-sector customers.
Driver
Network-generation changes create replacement decisions for agencies whose existing equipment no longer meets their requirements.
Restraint
Legal authority, export permission and verified product functionality can each prevent a proposed sale from becoming a deliverable contract.
Opportunity
Suppliers can compete for support and integration work where a customer funds a defined equipment transition.
How do purchasing rules and qualification affect IMSI catcher market demand?
FMI's forecast adds USD 398.6 million of annual market value between 2026 and 2036. Revenue increases through both additional equipment and changing realization. The technology split is especially uneven: 5G-related sales rise rapidly while 2G revenue contracts. A supplier's addressable demand therefore depends on its actual supported portfolio, not the headline global growth rate.
The platform forecast also resists a single-product interpretation. Portable and Handheld equipment retains leadership, but Vehicle-Mounted and Airborne and Fixed systems together still represent the larger portion of spending in 2036. Revenue comparisons should preserve those different package boundaries. The broader electronic warfare market contains other defence-electronics programs, whose budgets should remain outside this equipment forecast unless they fall within the defined IMSI catcher scope.
What limits reliable IMSI catcher market supply and quality?
There are two different commercial risks. A product may fail a customer's acceptance requirements even when a transaction is legally permitted. Separately, a technically suitable product may not qualify for export or authorized use. Israel's Defense Export Controls Agency identifies national security, international commitments and human rights among its policy considerations.
The historical Gamma International case also illustrates why reputation and due diligence belong in supplier assessment. The OECD's case record describes findings that conduct was inconsistent with specified OECD Guidelines provisions. That record concerns a concluded historical complaint.
Where can suppliers win additional business in the IMSI catcher market?
The strongest service proposition is a precise one: supported product scope, agreed acceptance evidence and a named party responsible for maintenance.
A buyer evaluating an upgrade also needs a credible account of what remains usable. Replacing all components may be unnecessarily expensive, while retaining unsupported elements may undermine the purchase. FMI sees room for suppliers that explain these boundaries clearly and price continuing support transparently. Such offers can compete on the useful life of a procurement, even when the customer's next major capital purchase remains several budget years away. The security side of the same networks is covered in FMI's internet security market.
IMSI Catcher Market by Country (2026 to 2036)
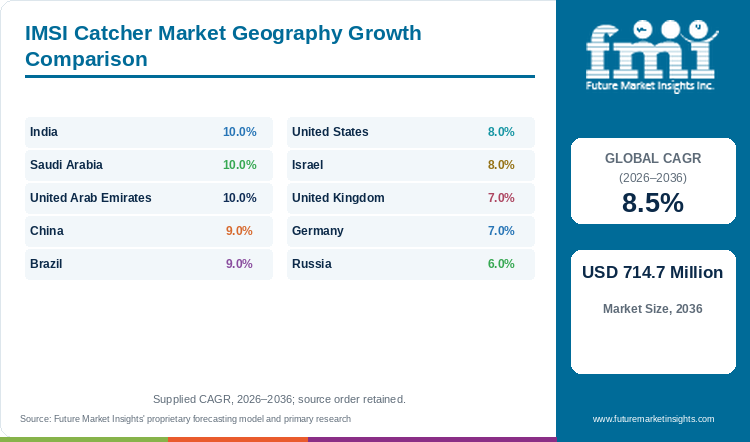
Table 5: IMSI Catcher Market Country Growth Forecast
| Country | CAGR, 2026 to 2036 |
|---|---|
| India | 10.0% |
| Saudi Arabia | 10.0% |
| United Arab Emirates | 10.0% |
| China | 9.0% |
| Brazil | 9.0% |
| United States | 8.0% |
| Israel | 8.0% |
| United Kingdom | 7.0% |
| Germany | 7.0% |
| Russia | 6.0% |
Source: Future Market Insights analysis of the IMSI catcher market, 2026.
India
India presents a combination of rapid network deployment and a recently revised legal framework. The Ministry of Communications reported in December 2025 that 5G was available in 99.9% of districts. It also reported approximately 508,000 base transceiver stations for 5G as of 31 October 2025.
The 2026 to 2036 forecast assigns India a 10.0% CAGR. National revenue increases from USD 25.3 million to USD 65.8 million, while its share of global value rises from 8.0% to 9.2%. The outlook supports a larger commercial role for India over the decade without equating telecommunications construction spending with surveillance-equipment purchases. By absolute increase, India ranks third with USD 40.5 million over the decade. Over the decade, revenue in India grows 2.6 times and the global total 2.3 times.
The Telecommunications lawful-interception rules establish arrangements for authorized agencies, the communication of orders and review committees. The amended text also addresses responsibility for unauthorized interception and the handling of records. These rules govern their stated activities and do not themselves demonstrate that a particular standalone product is approved. For suppliers, the commercial consequence is a need to identify the relevant authorization and contract responsibilities before treating a project as deliverable revenue. Local product availability alone is insufficient evidence of procurement eligibility. FMI sees the combination of modernization and explicit institutional procedures as the main distinction in India's opportunity, with continuing support likely to matter as networks develop.
Saudi Arabia
The Saudi opportunity is shaped by the coexistence of extensive 4G service and expanding 5G coverage. In its 2025 annual report, stc stated that its domestic infrastructure reached 63.0% 5G population coverage and 99.0% 4G coverage at year-end. These are operator figures with a defined coverage measure.
Against that network setting, FMI estimates Saudi IMSI catcher revenue at USD 15.8 million in 2026. It is forecast to reach USD 41.1 million in 2036, at a 10.0% CAGR during 2026 to 2036. Its global share increases from 5.0% to 5.8%. The projection gives Saudi Arabia one of the higher rates among the ten named countries, while retaining a comparatively modest absolute market base. Growth of USD 25.3 million leaves Saudi Arabia joint fourth among the ten named countries. In the IMSI catcher market, Saudi Arabia ranks joint fifth of ten on 2026 revenue. A 10.0% CAGR leaves Saudi Arabia 1.5 points above the 8.5% global pace.
A mixed network environment creates a purchasing choice between maintaining older equipment and funding a broader replacement. For vendors, commercial differentiation depends on a support commitment tied to the approved contract and the local environment. FMI's interpretation is that growth should be assessed through funded institutional purchases, with network development explaining the compatibility pressure behind them. Export permissions and customer authorization remain transaction-specific matters.
United Arab Emirates
Du reported that approximately 73.0% of its mobile traffic was carried over 5G networks in 2025. This is a stronger adoption indicator than simply reporting that a network is available. Those boundaries are important when translating connectivity evidence into a specialist market argument.
FMI forecasts UAE revenue rising from USD 15.8 million in 2026 to USD 41.1 million by 2036. Its 10.0% CAGR over 2026 to 2036 matches Saudi Arabia's displayed growth rate, while its global share moves from 5.0% to 5.8%. Identical forecast rates do not mean the two markets have the same procurement institutions, installed equipment or vendor relationships. By absolute increase, the United Arab Emirates ranks joint fourth with USD 25.3 million over the decade. In the IMSI catcher market, the United Arab Emirates grows 10.0% a year, 1.5 points above the global rate.
The commercial issue in the UAE is the useful life of equipment purchased into an advanced network setting. A buyer evaluating a replacement needs an offer with a defined support period and demonstrable compatibility, not a claim based only on a generation label. Du's disclosure supplies context for the pace of 5G use. FMI expects the forecast opportunity to be realized through specific authorized projects and their support obligations. Sales assumptions should therefore distinguish a customer's funded equipment requirement from the broader national digital-infrastructure narrative.
China
China's mobile network scale changes the commercial context for equipment renewal. The Ministry of Industry and Information Technology reported 4.8 million 5G base stations at the end of 2025. The same statistical release recorded 7.2 million 4G base stations. This simultaneous presence of network generations supports attention to compatibility across an evolving domestic infrastructure.
FMI forecasts Chinese IMSI catcher revenue of USD 31.6 million in 2026 and USD 75.1 million in 2036. The market advances at a 9.0% CAGR from 2026 to 2036, taking its global revenue share from 10.0% to 10.5%. This outlook implies expansion from a smaller revenue base than the United States despite China's much larger published cellular infrastructure figures. Network infrastructure and this specialist equipment category measure different economic activities. In the IMSI catcher market, China grows 9.0% a year, 0.5 points above the global rate.
The supplier question is therefore how closely an offer matches the buyer's actual equipment scope. A general national 5G statistic cannot validate a product claim or identify an authorized purchaser. Commercial assessment should distinguish domestic institutional demand, imported equipment and larger communications programs. Counting all mobile-security infrastructure as IMSI catcher revenue would overstate this market. Within the defined forecast, the principal opportunity lies in supported product renewal and additional authorized purchases as network configurations change. The ten-year projection does not disclose a supplier ranking or an assumed foreign-vendor allocation.
Brazil
Brazil's telecom transition is governed by a phased rollout timetable. Anatel's schedule, updated in September 2025, required service in municipalities of at least 500,000 inhabitants by July 2025 and those of at least 200,000 by July 2026. Later stages extend through 2029. They provide a concrete reason to consider equipment compatibility over several procurement periods.
FMI forecasts Brazilian IMSI catcher revenue of USD 12.6 million in 2026 and USD 30.0 million by 2036. The market grows at a 9.0% CAGR between 2026 and 2036, with global share rising from 4.0% to 4.2%. Brazil therefore offers a smaller absolute market than the United States or China while expanding faster than several established European markets. By absolute increase, Brazil ranks eighth with USD 17.4 million over the decade. Brazil's 2026 revenue ranks joint ninth of ten. The CAGR for Brazil is 9.0%, which runs 0.5 points above the 8.5% worldwide rate.
Judicial authorization remains important to the wider communications-interception setting. Brazil's Law 9,296 requires a competent judge's order for the covered interception used in criminal investigation and proceedings. Suppliers need to establish the actual authorized scope of a purchase. FMI sees the rollout schedule and institutional purchasing boundary as complementary considerations: network change explains technical renewal pressure, while lawful authority determines whether a particular project can proceed.
United States
The United States contributes 26.0% of global revenue in 2026, making it the largest national market in FMI's outlook. Revenue of USD 82.2 million is projected to reach USD 178.1 million by 2036. The 2026 to 2036 CAGR is 8.0%. This large starting base creates a meaningful replacement opportunity even though its growth rate is lower than those assigned to India and the two Gulf markets. The United States adds USD 95.9 million, ranking first for increase. In 2026 revenue terms, the United States is first of the ten countries.
The purchasing environment is shaped by explicit federal controls. DOJ policy addresses supervision, training and the treatment of information. For the covered criminal-investigation uses, it generally requires a warrant supported by probable cause, with defined exceptions. A supplier serving that environment needs to treat compliance functionality and documented limits as part of the product offer.
Congressional interest also continues. S. 2522 was introduced in the Senate on 29 July 2025 and referred to the Judiciary Committee. The cited record is the introduced bill, so its provisions are not treated here as enacted requirements. For purchasing departments, that distinction separates existing obligations from possible future changes. FMI's interpretation is that incumbent replacement demand remains important, while transparent contract scope reduces the risk of acquiring a package that exceeds an agency's authority or cannot be supported over its intended life.
Israel
Israel has two distinct roles in this assessment: a domestic demand market and a location for specialist suppliers. These should not be combined. FMI's country revenue is USD 15.8 million in 2026, rising to USD 34.2 million by 2036 at an 8.0% CAGR over 2026 to 2036. The country's share changes from 5.0% to 4.8%. Those values do not represent all exports by Israeli surveillance or defence companies. In the IMSI catcher market, Israel grows 8.0% a year, 0.5 points below the global rate.
The distinction matters because the Ministry of Defense reported USD 19.2 billion of total defence exports for 2025. Its release described government-to-government agreements of approximately USD 10.0 billion. These are broad defence figures. They demonstrate the scale of the national export sector but cannot substantiate an IMSI catcher market size, supplier share or contract award.
Export eligibility is a further boundary. DECA describes a control system based on the Defense Export Control Law and accompanying regulations. Its stated considerations include international commitments and human rights. For a specialist manufacturer, a global marketing presence is therefore different from permission to complete a sale to an individual destination. FMI's commercial reading is that export administration and a credible support arrangement affect the realizable opportunity. Buyers and investors should keep those perspectives separate when comparing Israeli suppliers with defence groups headquartered in other countries.
United Kingdom
Authorization and the treatment of collected material are central to the UK procurement setting. The Home Office's revised Equipment Interference Code of Practice came into force in June 2025. It addresses relevant public authorities and requirements under the Investigatory Powers Act, including necessity, proportionality and safeguards. The code is a framework for the activities within its scope.
FMI projects the UK market at USD 19.0 million in 2026, rising to USD 37.4 million in 2036. Growth of 7.0% CAGR over 2026 to 2036 places it below the global rate. Its share consequently moves from 6.0% to 5.2%. The outlook describes continuing spending in an established market, with a lower rate of expansion than the larger growth markets assessed here. In the IMSI catcher market, the United Kingdom's 7.0% CAGR sits 1.5 points below the global 8.5%. In the IMSI catcher market, the United Kingdom's 2026 revenue ranks fourth of ten.
The commercial issue is the completeness of an offer. Where material may be used in proceedings, the code emphasizes evidential integrity and the ability to explain its acquisition. Contract discussions therefore need to cover documentation and accountable handling alongside the equipment itself. A larger nominal feature list does not resolve those obligations. FMI expects suppliers with a clearly bounded offer and continuing support commitments to compete for renewal work. The forecast does not assume that a general increase in digital investigations automatically translates into proportionate hardware purchases.
Germany
Germany provides unusually specific public evidence of both use and intended replacement. In September 2025, the Bundestag reported 19 federal-police cases and 35 Federal Criminal Police Office measures during the first half of that year. These figures demonstrate actual use within the stated authorities.
Berlin's separate budget material described almost EUR 0.9 million for a planned 2025 upgrade and EUR 2.1 million for a planned 2026 successor system with a vehicle. It also said that an award for the successor had not yet been made at the time of the response. The commercial significance is the distinction between funds planned, equipment ordered and equipment delivered.
FMI forecasts USD 15.8 million of German market revenue in 2026 and USD 31.2 million by 2036. The 7.0% CAGR for 2026 to 2036 reduces its global share from 5.0% to 4.4%. This is consistent with a continuing renewal market whose relative weight declines as other countries expand faster. The public procurement example supports attention to integration and transition costs, while its scope remains local. Germany's wider demand cannot be obtained by multiplying Berlin's planned package by a count of police authorities. Germany records a USD 15.4 million increase, ninth of the ten. In the IMSI catcher market, Germany's revenue grows 2.0 times over the decade, against 2.3 times globally. Germany's 2026 revenue ranks joint fifth of ten.
Russia
Supply access is a central distinction in Russia's outlook. The European Commission's explanation of the May 2025 sanctions package added 31 companies to restrictions associated with support for Russia's military-industrial complex or sanctions circumvention. This is a dated example within a wider restrictive framework.
FMI projects Russian revenue at USD 12.6 million in 2026 and USD 22.7 million by 2036. Among the ten named countries, the 6.0% CAGR over 2026 to 2036 is the lowest. Its share of global revenue declines from 4.0% to 3.2%, and its 2036 revenue of USD 22.7 million is the smallest of the ten named countries. Russia adds USD 10.1 million, ranking last for increase. Russia and Brazil are level at USD 12.6 million in 2026, but Brazil reaches USD 30.0 million by 2036 against Russia's USD 22.7 million. From 2026 to 2036, revenue in Russia rises 1.8 times and global revenue 2.3 times. Russia grows at 6.0% a year, 2.5 points slower than the global rate. The gain of USD 10.1 million equals 2.5% of the global increase of USD 398.6 million.
FMI's interpretation is that the market needs a supply-constrained reading, with considerably less confidence in converting headline demand into a foreign vendor's addressable sales. The country projection should be considered separately from any named company's export opportunity. No alternative supply route or circumvention assumption is included in this assessment.
Who are the notable companies in the IMSI Catcher Market?
Notable companies in the IMSI Catcher Market include L3Harris, Rohde & Schwarz, Septier Communication, Shoghi Communications and Neosoft / NeoSoft AG.
Septier Communication and Shoghi Communications publicly present products for government and security customers. Septier describes both field and network-based offerings, while Shoghi identifies its mobile-locator product as intended for government agencies and law enforcement. These are manufacturer descriptions. They establish portfolio positioning, not independently measured sales or comparative effectiveness.
Rohde & Schwarz has a documented 5G monitoring and testing portfolio. This is relevant adjacent competence, but a general monitoring announcement is insufficient evidence of a current IMSI catcher contract. NeoSoft AG's GSMA exhibitor description emphasizes defence against malicious cellular infrastructure. Its defensive positioning should not be counted automatically as active collection equipment revenue.
The other two names require historical care. L3Harris was formed through the completed 2019 merger of Harris Corporation and L3 Technologies. Corporate scale does not establish present product availability within this narrow market. Gamma Group's surveillance-sector role is documented in historical records. The OECD record concerns Gamma International UK and a concluded conduct complaint, not a verified 2026 IMSI catcher catalogue. FMI therefore compares these names by documented role without assigning company market shares or treating every participant as a current direct competitor for the same tender.
Key Developments in the IMSI Catcher Market
- In March 2026, NIST finalized its white paper on concealed subscriber identifiers. The publication strengthens the evidence available for evaluating 5G privacy claims and their implications for equipment procurement.
Key Players in the IMSI Catcher Market
- L3Harris
- Rohde & Schwarz
- Septier Communication
- Shoghi Communications
- Neosoft / NeoSoft AG
- Gamma Group
IMSI Catcher Market Report Scope
Table 6: IMSI Catcher Market Report Scope
| Coverage field | Report scope |
|---|---|
| Market definition | Mobile-network surveillance systems sold to law enforcement, intelligence, defence and border-security agencies within authorized procurement arrangements. |
| Product boundary | Portable, handheld, vehicle-mounted, airborne and fixed equipment. Functionality differs by product and jurisdiction. |
| Exclusions | General telecom infrastructure, all-purpose network testing, defensive detection and unrelated intrusion software are not automatically counted as IMSI catcher sales. |
| Quantitative Units | USD million |
| Segmentation | Platform. Network Technology. End User. |
| Named countries | United States, China, India, United Kingdom, Israel, Germany, Saudi Arabia, United Arab Emirates, Russia and Brazil |
| Company coverage | L3Harris, Rohde & Schwarz, Septier Communication, Neosoft, Gamma Group and Shoghi Communications, with direct, adjacent and former roles distinguished. |
| Regions covered | North America, Latin America, Western Europe, Eastern Europe, East Asia, South Asia, Middle East and Rest of world aggregate |
Source: Future Market Insights analysis of the IMSI catcher market, 2026.
IMSI Catcher Market Research Methodology
The assessment combines FMI's quantitative outlook with secondary review of official telecommunications statistics, parliamentary procurement material, public policy and original company disclosures. Value, annual volume, segment and country figures are checked for consistent units and forecast periods. Competitive interpretation distinguishes current public product descriptions from adjacent capabilities and historical records. Planned budgets are not represented as completed awards, and broad corporate or defence revenues are not substituted for IMSI catcher market sales.
IMSI Catcher Market by Segments
IMSI Catcher Market segmented by Platform:
- Portable and Handheld
- Vehicle-Mounted
- Airborne and Fixed
IMSI Catcher Market segmented by Network Technology:
- 2G
- 3G
- 4G
- 5G
IMSI Catcher Market segmented by End User:
- Law Enforcement
- Intelligence and Defence
- Border and Homeland Security
IMSI Catcher Market by Region
- North America
- United States
- Latin America
- Brazil
- Western Europe
- United Kingdom
- Germany
- Eastern Europe
- Russia
- East Asia
- China
- South Asia
- India
- Middle East
- Israel
- Saudi Arabia
- United Arab Emirates
- Rest of world aggregate
Research Sources and Bibliography
- Anatel. (2025, September 12 update). Compromissos de Abrangência do Leilão do 5G. https://www.gov.br/anatel/pt-br/regulado/universalizacao/compromissos-do-leilao-do-5g
- Deutscher Bundestag. (2025, September 12). Einsatz sogenannter IMSI-Catcher. Parliamentary news, hib 421/2025. https://www.bundestag.de/presse/hib/kurzmeldungen-1108784
- Emirates Integrated Telecommunications Company, du. (2026). Integrated Annual Report 2025, market overview. Dubai Financial Market filing. https://feeds.dfm.ae/documents/2026/Mar/19/9569a4e2-7b46-4b32-86c1-d71e637ed2b6/Du%20Integrated%20Annual.pdf
- European Commission. (2025, May 20). EU adopts 17th package of sanctions against Russia. https://finance.ec.europa.eu/news/eu-adopts-17th-package-sanctions-against-russia-2025-05-20_en
- Government of India. (2024, as amended). Telecommunications (Procedures and Safeguards for Lawful Interception of Messages) Rules. India Code. Accessed 9 November 2026. https://upload.indiacode.nic.in/showfile?actid=AC_CEN_37_58_00002_202344_1721027001853&filename=telecommunications_%28procedures_and_safeguards_for_lawful_interception_of_messages%29_rules%2C_2024_%28as_amended%29_%282%29.pdf&type=rule
- GSMA, MWC Barcelona. (n.d.). NeoSoft AG exhibitor profile. Accessed 9 November 2026. https://www.mwcbarcelona.com/exhibitors/33819-neosoft-ag
- Israel Ministry of Defense. (2026). All-Time Defense Export Record: Israel Crosses the USD 19 Billion Threshold. 2025 export results. https://www.mod.gov.il/en/press-releases/press-room/all-time-defense-export-record-israel-crosses-the-19-billion-threshold
- Israel Ministry of Defense, Defense Export Controls Agency. (n.d.). Defense Export Control Policy and Defense Export Control Law. Accessed 9 November 2026. https://exportctrl.mod.gov.il/en
- L3Harris Technologies. (2019, July 1). L3Harris Technologies Merger Successfully Completed; Board of Directors, Leadership and Organization Structure Announced. https://investors.l3harris.com/news/news-details/2019/L3Harris-Technologies-Merger-Successfully-Completed-Board-of-Directors-Leadership-and-Organization-Structure-Announced-07-01-2019/default.aspx
- Ministry of Communications, India. (2025, December 11). Status of 5G Rollout. Press Information Bureau, release 2202384. https://www.pib.gov.in/PressReleseDetailm.aspx?PRID=2202384
- Ministry of Industry and Information Technology, China. (2026, January 29). 2025 Telecommunications Industry Statistical Bulletin. https://nmca.miit.gov.cn/zwgk/xysjtj/art/2026/art_b1f5a03762374affa434e666ec868d0c.html
- National Institute of Standards and Technology. (2026, March). Protecting Subscriber Identifiers with Subscription Concealed Identifier (SUCI): Applying 5G Cybersecurity and Privacy Capabilities. NIST CSWP 36A. https://doi.org/10.6028/NIST.CSWP.36A
- OECD. (n.d.). Supplying of surveillance equipment in Bahrain, concluded UK National Contact Point case concerning Gamma International UK. Accessed 9 November 2026. https://www.oecd.org/en/networks/national-contact-points-for-responsible-business-conduct/database/uk0034.html
- Presidency of Brazil. (1996, as amended). Law 9,296 of 24 July 1996, communications interception. Official ANTT legal repository. Accessed 9 November 2026. https://anttlegis.antt.gov.br/action/UrlPublicasAction.php?acao=abrirAtoPublico&cod_menu=7145&cod_modulo=420&num_ato=00009296&seq_ato=000&sgl_orgao=NI&sgl_tipo=LEI&vlr_ano=1996
- Rohde & Schwarz. (2025, February 12). Safeguard your network, enhance user experience: Rohde & Schwarz introduces comprehensive 5G solutions at MWC 2025.
- Septier Communication. (n.d.). Cellular Intelligence Solutions, corporate portfolio and markets. Accessed 9 November 2026. https://www.septier.com/
- Shoghi Communications. (n.d.). IMSI Catcher & Mobile Locator System, corporate product description. Accessed 9 November 2026. https://www.shoghicom.com/products/intelligence-surveillance-reconnaissance/cellular-monitoring/imsi-catcher--mobile-locator-system
- stc. (2026). Annual Report 2025, domestic infrastructure and population coverage. https://www.stc.com/content/dam/groupsites/en/pdf/stc2025-annual-report-en.pdf
- UK Home Office. (2025, June 6). Equipment Interference Code of Practice, accessible edition. https://www.gov.uk/government/publications/equipment-interference-code-of-practice--2/equipment-interference-code-of-practice-accessible--2
- US Congress, Senate. (2025, July 29). Cell-Site Simulator Warrant Act of 2025, S. 2522, introduced version. Government Publishing Office.
- US Department of Justice. (2015, September 3). Policy Guidance: Use of Cell-Site Simulator Technology.
- Abgeordnetenhaus Berlin. (2025, September). Interior and security budget responses, document iso19-0235-2-v, questions 184–185. Planned IMSI upgrade and SUPI successor acquisition.
Table of Content
- Key Takeaways
- Market Size and CAGR
- Top Growth Driver
- Fastest Growing Segment
- Leading Region
- Key Companies
- Emerging Opportunities
- Executive Summary
- Global Market Outlook
- Demand-side Trends
- Supply-side Trends
- Technology Roadmap Analysis
- Analysis and Recommendations
- Analyst Perspective (What is happening? Why now? What should investors know?)
- Key Questions Answered
- How large is the market?
- What is the CAGR?
- What are key trends?
- Which region dominates?
- Who are the leaders?
Read More...
- Market Overview
- Market Coverage / Taxonomy
- Market Definition / Scope / Limitations
- Research Methodology
- Chapter Orientation
- Analytical Lens and Working Hypotheses
- Market Structure, Signals, and Trend Drivers
- Benchmarking and Cross-market Comparability
- Market Sizing, Forecasting, and Opportunity Mapping
- Research Design and Evidence Framework
- Desk Research Programme (Secondary Evidence)
- Expert Input and Fieldwork (Primary Evidence)
- Tooling, Models, and Reference Databases
- Data Engineering and Model Build
- Quality Assurance and Audit Trail
- Market Background
- Market Dynamics (Drivers, Restraints, Opportunity, Trends)
- Scenario Forecast (Optimistic, Likely, Conservative)
- Impact Analysis
- AI Impact
- Sustainability Impact
- Regulatory Impact
- Technology Impact
- Consumer / Buyer Analysis
- Purchase Drivers
- Adoption Barriers
- Buyer Journey
- Opportunity Map Analysis
- Product Life Cycle Analysis
- Supply Chain Analysis
- Investment Feasibility Matrix
- Value Chain Analysis
- PESTLE and Porter's Analysis
- Regulatory Landscape
- Regional Parent Market Outlook
- Production and Consumption Statistics
- Import and Export Statistics
- Global Market Analysis and Forecast, 2021 to 2036
- Historical Market Size Value (USD Million) Analysis, 2021 to 2025
- Current and Future Market Size Value (USD Million) Projections, 2026 to 2036
- Y-o-Y Growth Trend Analysis
- Absolute $ Opportunity Analysis
- Global Market Pricing Analysis, 2021 to 2036
- Global Market Analysis and Forecast, By Platform, 2021 to 2036
- Introduction / Key Findings
- Historical Market Size Value (USD Million) Analysis By Platform, 2021 to 2025
- Current and Future Market Size Value (USD Million) Analysis and Forecast By Platform, 2026 to 2036
- Portable and Handheld
- Vehicle-Mounted
- Airborne and Fixed
- Y-o-Y Growth Trend Analysis By Platform, 2021 to 2025
- Absolute $ Opportunity Analysis By Platform, 2026 to 2036
- Global Market Analysis and Forecast, By Network Technology, 2021 to 2036
- Introduction / Key Findings
- Historical Market Size Value (USD Million) Analysis By Network Technology, 2021 to 2025
- Current and Future Market Size Value (USD Million) Analysis and Forecast By Network Technology, 2026 to 2036
- 2G
- 3G
- 4G
- 5G
- Y-o-Y Growth Trend Analysis By Network Technology, 2021 to 2025
- Absolute $ Opportunity Analysis By Network Technology, 2026 to 2036
- Global Market Analysis and Forecast, By End User, 2021 to 2036
- Introduction / Key Findings
- Historical Market Size Value (USD Million) Analysis By End User, 2021 to 2025
- Current and Future Market Size Value (USD Million) Analysis and Forecast By End User, 2026 to 2036
- Law Enforcement
- Intelligence and Defence
- Border and Homeland Security
- Y-o-Y Growth Trend Analysis By End User, 2021 to 2025
- Absolute $ Opportunity Analysis By End User, 2026 to 2036
- Global Market Analysis and Forecast, By Region, 2021 to 2036
- Introduction
- Historical Market Size Value (USD Million) Analysis By Region, 2021 to 2025
- Current Market Size Value (USD Million) Analysis and Forecast By Region, 2026 to 2036
- North America
- Latin America
- Western Europe
- Eastern Europe
- East Asia
- South Asia
- Middle East
- Market Attractiveness Analysis By Region
- North America Market Analysis and Forecast, By Country, 2021 to 2036
- Historical Market Size Value (USD Million) Trend Analysis By Market Taxonomy, 2021 to 2025
- Market Size Value (USD Million) Forecast By Market Taxonomy, 2026 to 2036
- By Country
- United States
- By Platform
- By Network Technology
- By End User
- By Country
- Market Attractiveness Analysis
- By Country
- By Platform
- By Network Technology
- By End User
- Key Takeaways
- Latin America Market Analysis and Forecast, By Country
- Historical Market Size Value (USD Million) Trend Analysis By Market Taxonomy, 2021 to 2025
- Market Size Value (USD Million) Forecast By Market Taxonomy, 2026 to 2036
- By Country
- Brazil
- By Platform
- By Network Technology
- By End User
- By Country
- Market Attractiveness Analysis
- By Country
- By Platform
- By Network Technology
- By End User
- Key Takeaways
- Western Europe Market Analysis and Forecast, By Country
- Historical Market Size Value (USD Million) Trend Analysis By Market Taxonomy, 2021 to 2025
- Market Size Value (USD Million) Forecast By Market Taxonomy, 2026 to 2036
- By Country
- United Kingdom
- Germany
- By Platform
- By Network Technology
- By End User
- By Country
- Market Attractiveness Analysis
- By Country
- By Platform
- By Network Technology
- By End User
- Key Takeaways
- Eastern Europe Market Analysis and Forecast, By Country
- Historical Market Size Value (USD Million) Trend Analysis By Market Taxonomy, 2021 to 2025
- Market Size Value (USD Million) Forecast By Market Taxonomy, 2026 to 2036
- By Country
- Russia
- By Platform
- By Network Technology
- By End User
- By Country
- Market Attractiveness Analysis
- By Country
- By Platform
- By Network Technology
- By End User
- Key Takeaways
- East Asia Market Analysis and Forecast, By Country
- Historical Market Size Value (USD Million) Trend Analysis By Market Taxonomy, 2021 to 2025
- Market Size Value (USD Million) Forecast By Market Taxonomy, 2026 to 2036
- By Country
- China
- By Platform
- By Network Technology
- By End User
- By Country
- Market Attractiveness Analysis
- By Country
- By Platform
- By Network Technology
- By End User
- Key Takeaways
- South Asia Market Analysis and Forecast, By Country
- Historical Market Size Value (USD Million) Trend Analysis By Market Taxonomy, 2021 to 2025
- Market Size Value (USD Million) Forecast By Market Taxonomy, 2026 to 2036
- By Country
- India
- By Platform
- By Network Technology
- By End User
- By Country
- Market Attractiveness Analysis
- By Country
- By Platform
- By Network Technology
- By End User
- Key Takeaways
- Middle East Market Analysis and Forecast, By Country
- Historical Market Size Value (USD Million) Trend Analysis By Market Taxonomy, 2021 to 2025
- Market Size Value (USD Million) Forecast By Market Taxonomy, 2026 to 2036
- By Country
- Israel
- Saudi Arabia
- United Arab Emirates
- Rest of world aggregate
- By Platform
- By Network Technology
- By End User
- By Country
- Market Attractiveness Analysis
- By Country
- By Platform
- By Network Technology
- By End User
- Key Takeaways
- Key Countries Market Analysis
- United States
- Pricing Analysis
- Market Share Analysis, 2025
- By Platform
- By Network Technology
- By End User
- Brazil
- Pricing Analysis
- Market Share Analysis, 2025
- By Platform
- By Network Technology
- By End User
- Germany
- Pricing Analysis
- Market Share Analysis, 2025
- By Platform
- By Network Technology
- By End User
- United Kingdom
- Pricing Analysis
- Market Share Analysis, 2025
- By Platform
- By Network Technology
- By End User
- India
- Pricing Analysis
- Market Share Analysis, 2025
- By Platform
- By Network Technology
- By End User
- China
- Pricing Analysis
- Market Share Analysis, 2025
- By Platform
- By Network Technology
- By End User
- Russia
- Pricing Analysis
- Market Share Analysis, 2025
- By Platform
- By Network Technology
- By End User
- Saudi Arabia
- Pricing Analysis
- Market Share Analysis, 2025
- By Platform
- By Network Technology
- By End User
- United Arab Emirates
- Pricing Analysis
- Market Share Analysis, 2025
- By Platform
- By Network Technology
- By End User
- Israel
- Pricing Analysis
- Market Share Analysis, 2025
- By Platform
- By Network Technology
- By End User
- United States
- Market Structure Analysis
- Competition Dashboard
- Competition Benchmarking
- Market Share Analysis of Top Players
- By Regional
- By Platform
- By Network Technology
- By End User
- Emerging Startups
- Innovation Benchmarking
- Competition Analysis
- Competition Deep Dive
- L3Harris
- Overview
- Product Portfolio
- Profitability by Market Segments
- Sales Footprint
- Strategy Overview
- Marketing Strategy
- Product Strategy
- Channel Strategy
- Rohde & Schwarz
- Septier Communication
- Neosoft / NeoSoft AG
- Gamma Group
- Shoghi Communications
- L3Harris
- Case Studies
- Success Stories
- Recent Developments
- Competition Deep Dive
- Assumptions & Acronyms Used
List of Tables
- Table 1: Global Market Value (USD Million) Forecast by Region, 2021 to 2036
- Table 2: Global Market Value (USD Million) Forecast by Platform, 2021 to 2036
- Table 3: Global Market Value (USD Million) Forecast by Network Technology, 2021 to 2036
- Table 4: Global Market Value (USD Million) Forecast by End User, 2021 to 2036
- Table 5: North America Market Value (USD Million) Forecast by Country, 2021 to 2036
- Table 6: North America Market Value (USD Million) Forecast by Platform, 2021 to 2036
- Table 7: North America Market Value (USD Million) Forecast by Network Technology, 2021 to 2036
- Table 8: North America Market Value (USD Million) Forecast by End User, 2021 to 2036
- Table 9: Latin America Market Value (USD Million) Forecast by Country, 2021 to 2036
- Table 10: Latin America Market Value (USD Million) Forecast by Platform, 2021 to 2036
- Table 11: Latin America Market Value (USD Million) Forecast by Network Technology, 2021 to 2036
- Table 12: Latin America Market Value (USD Million) Forecast by End User, 2021 to 2036
- Table 13: Western Europe Market Value (USD Million) Forecast by Country, 2021 to 2036
- Table 14: Western Europe Market Value (USD Million) Forecast by Platform, 2021 to 2036
- Table 15: Western Europe Market Value (USD Million) Forecast by Network Technology, 2021 to 2036
- Table 16: Western Europe Market Value (USD Million) Forecast by End User, 2021 to 2036
- Table 17: Eastern Europe Market Value (USD Million) Forecast by Country, 2021 to 2036
- Table 18: Eastern Europe Market Value (USD Million) Forecast by Platform, 2021 to 2036
- Table 19: Eastern Europe Market Value (USD Million) Forecast by Network Technology, 2021 to 2036
- Table 20: Eastern Europe Market Value (USD Million) Forecast by End User, 2021 to 2036
- Table 21: East Asia Market Value (USD Million) Forecast by Country, 2021 to 2036
- Table 22: East Asia Market Value (USD Million) Forecast by Platform, 2021 to 2036
- Table 23: East Asia Market Value (USD Million) Forecast by Network Technology, 2021 to 2036
- Table 24: East Asia Market Value (USD Million) Forecast by End User, 2021 to 2036
- Table 25: South Asia Market Value (USD Million) Forecast by Country, 2021 to 2036
- Table 26: South Asia Market Value (USD Million) Forecast by Platform, 2021 to 2036
- Table 27: South Asia Market Value (USD Million) Forecast by Network Technology, 2021 to 2036
- Table 28: South Asia Market Value (USD Million) Forecast by End User, 2021 to 2036
- Table 29: Middle East Market Value (USD Million) Forecast by Country, 2021 to 2036
- Table 30: Middle East Market Value (USD Million) Forecast by Platform, 2021 to 2036
- Table 31: Middle East Market Value (USD Million) Forecast by Network Technology, 2021 to 2036
- Table 32: Middle East Market Value (USD Million) Forecast by End User, 2021 to 2036
List of Figures
- Figure 1: Global Market Pricing Analysis
- Figure 2: Global Market Value (USD Million) Forecast 2021-2036
- Figure 3: Global Market Value Share and BPS Analysis by Platform, 2026 and 2036
- Figure 4: Global Market Y-o-Y Growth Comparison by Platform, 2026-2036
- Figure 5: Global Market Attractiveness Analysis by Platform
- Figure 6: Global Market Value Share and BPS Analysis by Network Technology, 2026 and 2036
- Figure 7: Global Market Y-o-Y Growth Comparison by Network Technology, 2026-2036
- Figure 8: Global Market Attractiveness Analysis by Network Technology
- Figure 9: Global Market Value Share and BPS Analysis by End User, 2026 and 2036
- Figure 10: Global Market Y-o-Y Growth Comparison by End User, 2026-2036
- Figure 11: Global Market Attractiveness Analysis by End User
- Figure 12: Global Market Value (USD Million) Share and BPS Analysis by Region, 2026 and 2036
- Figure 13: Global Market Y-o-Y Growth Comparison by Region, 2026-2036
- Figure 14: Global Market Attractiveness Analysis by Region
- Figure 15: North America Market Incremental Dollar Opportunity, 2026-2036
- Figure 16: Latin America Market Incremental Dollar Opportunity, 2026-2036
- Figure 17: Western Europe Market Incremental Dollar Opportunity, 2026-2036
- Figure 18: Eastern Europe Market Incremental Dollar Opportunity, 2026-2036
- Figure 19: East Asia Market Incremental Dollar Opportunity, 2026-2036
- Figure 20: South Asia Market Incremental Dollar Opportunity, 2026-2036
- Figure 21: Middle East Market Incremental Dollar Opportunity, 2026-2036
- Figure 22: North America Market Value Share and BPS Analysis by Country, 2026 and 2036
- Figure 23: North America Market Value Share and BPS Analysis by Platform, 2026 and 2036
- Figure 24: North America Market Y-o-Y Growth Comparison by Platform, 2026-2036
- Figure 25: North America Market Attractiveness Analysis by Platform
- Figure 26: North America Market Value Share and BPS Analysis by Network Technology, 2026 and 2036
- Figure 27: North America Market Y-o-Y Growth Comparison by Network Technology, 2026-2036
- Figure 28: North America Market Attractiveness Analysis by Network Technology
- Figure 29: North America Market Value Share and BPS Analysis by End User, 2026 and 2036
- Figure 30: North America Market Y-o-Y Growth Comparison by End User, 2026-2036
- Figure 31: North America Market Attractiveness Analysis by End User
- Figure 32: Latin America Market Value Share and BPS Analysis by Country, 2026 and 2036
- Figure 33: Latin America Market Value Share and BPS Analysis by Platform, 2026 and 2036
- Figure 34: Latin America Market Y-o-Y Growth Comparison by Platform, 2026-2036
- Figure 35: Latin America Market Attractiveness Analysis by Platform
- Figure 36: Latin America Market Value Share and BPS Analysis by Network Technology, 2026 and 2036
- Figure 37: Latin America Market Y-o-Y Growth Comparison by Network Technology, 2026-2036
- Figure 38: Latin America Market Attractiveness Analysis by Network Technology
- Figure 39: Latin America Market Value Share and BPS Analysis by End User, 2026 and 2036
- Figure 40: Latin America Market Y-o-Y Growth Comparison by End User, 2026-2036
- Figure 41: Latin America Market Attractiveness Analysis by End User
- Figure 42: Western Europe Market Value Share and BPS Analysis by Country, 2026 and 2036
- Figure 43: Western Europe Market Value Share and BPS Analysis by Platform, 2026 and 2036
- Figure 44: Western Europe Market Y-o-Y Growth Comparison by Platform, 2026-2036
- Figure 45: Western Europe Market Attractiveness Analysis by Platform
- Figure 46: Western Europe Market Value Share and BPS Analysis by Network Technology, 2026 and 2036
- Figure 47: Western Europe Market Y-o-Y Growth Comparison by Network Technology, 2026-2036
- Figure 48: Western Europe Market Attractiveness Analysis by Network Technology
- Figure 49: Western Europe Market Value Share and BPS Analysis by End User, 2026 and 2036
- Figure 50: Western Europe Market Y-o-Y Growth Comparison by End User, 2026-2036
- Figure 51: Western Europe Market Attractiveness Analysis by End User
- Figure 52: Eastern Europe Market Value Share and BPS Analysis by Country, 2026 and 2036
- Figure 53: Eastern Europe Market Value Share and BPS Analysis by Platform, 2026 and 2036
- Figure 54: Eastern Europe Market Y-o-Y Growth Comparison by Platform, 2026-2036
- Figure 55: Eastern Europe Market Attractiveness Analysis by Platform
- Figure 56: Eastern Europe Market Value Share and BPS Analysis by Network Technology, 2026 and 2036
- Figure 57: Eastern Europe Market Y-o-Y Growth Comparison by Network Technology, 2026-2036
- Figure 58: Eastern Europe Market Attractiveness Analysis by Network Technology
- Figure 59: Eastern Europe Market Value Share and BPS Analysis by End User, 2026 and 2036
- Figure 60: Eastern Europe Market Y-o-Y Growth Comparison by End User, 2026-2036
- Figure 61: Eastern Europe Market Attractiveness Analysis by End User
- Figure 62: East Asia Market Value Share and BPS Analysis by Country, 2026 and 2036
- Figure 63: East Asia Market Value Share and BPS Analysis by Platform, 2026 and 2036
- Figure 64: East Asia Market Y-o-Y Growth Comparison by Platform, 2026-2036
- Figure 65: East Asia Market Attractiveness Analysis by Platform
- Figure 66: East Asia Market Value Share and BPS Analysis by Network Technology, 2026 and 2036
- Figure 67: East Asia Market Y-o-Y Growth Comparison by Network Technology, 2026-2036
- Figure 68: East Asia Market Attractiveness Analysis by Network Technology
- Figure 69: East Asia Market Value Share and BPS Analysis by End User, 2026 and 2036
- Figure 70: East Asia Market Y-o-Y Growth Comparison by End User, 2026-2036
- Figure 71: East Asia Market Attractiveness Analysis by End User
- Figure 72: South Asia Market Value Share and BPS Analysis by Country, 2026 and 2036
- Figure 73: South Asia Market Value Share and BPS Analysis by Platform, 2026 and 2036
- Figure 74: South Asia Market Y-o-Y Growth Comparison by Platform, 2026-2036
- Figure 75: South Asia Market Attractiveness Analysis by Platform
- Figure 76: South Asia Market Value Share and BPS Analysis by Network Technology, 2026 and 2036
- Figure 77: South Asia Market Y-o-Y Growth Comparison by Network Technology, 2026-2036
- Figure 78: South Asia Market Attractiveness Analysis by Network Technology
- Figure 79: South Asia Market Value Share and BPS Analysis by End User, 2026 and 2036
- Figure 80: South Asia Market Y-o-Y Growth Comparison by End User, 2026-2036
- Figure 81: South Asia Market Attractiveness Analysis by End User
- Figure 82: Middle East Market Value Share and BPS Analysis by Country, 2026 and 2036
- Figure 83: Middle East Market Value Share and BPS Analysis by Platform, 2026 and 2036
- Figure 84: Middle East Market Y-o-Y Growth Comparison by Platform, 2026-2036
- Figure 85: Middle East Market Attractiveness Analysis by Platform
- Figure 86: Middle East Market Value Share and BPS Analysis by Network Technology, 2026 and 2036
- Figure 87: Middle East Market Y-o-Y Growth Comparison by Network Technology, 2026-2036
- Figure 88: Middle East Market Attractiveness Analysis by Network Technology
- Figure 89: Middle East Market Value Share and BPS Analysis by End User, 2026 and 2036
- Figure 90: Middle East Market Y-o-Y Growth Comparison by End User, 2026-2036
- Figure 91: Middle East Market Attractiveness Analysis by End User
- Figure 92: Global Market - Tier Structure Analysis
- Figure 93: Global Market - Company Share Analysis
Frequently Asked Questions
How big is the IMSI catcher market in 2026?
FMI estimates the market at USD 316.1 million in 2026, up from USD 290.0 million in 2025. It is forecast to reach USD 714.7 million by 2036 at a 8.5% CAGR.
Which platform leads the IMSI catcher market in 2026?
Portable and Handheld leads by platform with 38.0% in 2026. All other segments together hold 62.0%.
Which network technology and end user lead in 2026?
4G holds 35.0% by network technology and Law Enforcement holds 46.0% by end user in FMI's 2026 assessment.
Which market is forecast to grow fastest through 2036?
India, Saudi Arabia and United Arab Emirates tie for the highest forecast CAGR at 10.0% during 2026 to 2036, followed by China and Brazil at 9.0%.
Does a 5G product label establish universal functionality?
No. Network privacy capabilities and product support boundaries differ. NIST's 2026 paper describes concealed subscriber identifiers as an important privacy capability, making precise product claims commercially important.[2]
Preview the report firsthand - request a free sample
Get SampleGet the brochure for pricing and purchase details.
Get PDF
