Reports

- Global Locations -

Headquarters

Future Market Insights, Inc.

Christiana Corporate, 200
Continental Drive, Suite 401,
Newark, Delaware - 19713,
United States

T: +1-845-579-5705

Americas

Future Market Insights, Inc.

616 Corporate Way, Suite 2-9018,
Valley Cottage, NY 10989, United States

T: +1-347-918-3531

MEA

Future Market Insights

1602-6 Jumeirah Bay X2 Tower, Plot No: JLT-PH2-X2A,
Jumeirah Lakes Towers, Dubai,
United Arab Emirates

Europe

Future Market Insights

3rd Floor, 207 Regent Street,
W1B 3HH London
United Kingdom

T: + 44 (0) 20 8123 9659
D: +44 (0) 20 3287 4268

Asia Pacific

Future Market Insights

IndiaLand Global Tech Park, Unit UG-1, Behind Grand HighStreet, Phase 1, Hinjawadi, MH, Pune – 411057, India

Conversational AI Market Outlook

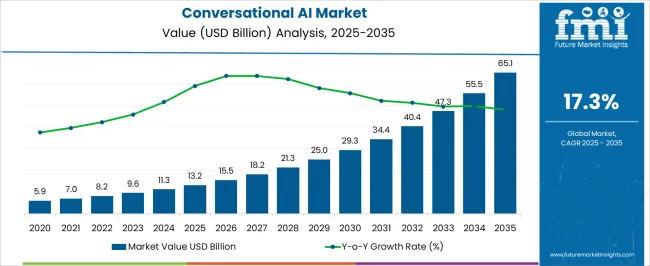
The conversational AI market is expected to develop at a staggering 17.3% CAGR between 2023 and 2033. The market is expected to grow from US$ 9.6 billion in 2023 to US$ 47.6 billion in 2033.

The primary factors escalating the market growth of conversational AI include rising demand for AI-powered customer support services, omnichannel implementation, and lower chatbot development costs. The rise in demand for AI-based Gartner chatbot solutions boosts market growth throughout the projection period.

The conversational AI industry is predicted to grow rapidly in the future years. With the growing desire for personalized and engaging customer experiences, organizations across all industries are recognizing the potential of Conversational AI solutions. To improve customer engagement and streamline processes.

Innovation Catalysts: Factors Fostering Conversational AI Advancements

  • Conversational AI is being driven by the increasing integration of AI chatbots in messaging services.
  • The growing emphasis on improving customer engagement and satisfaction boosts the Conversational AI market.
  • The rise of e-commerce and online shopping propels the adoption of conversational AI for sales and support.
  • Conversational AI is becoming more popular as smart devices and IoT-enabled applications proliferate.
  • Growing investments in AI and machine learning technologies are accelerating the conversational AI industry forward.
  • The market expansion for conversational AI is being fueled by the demand for effective and scalable customer service solutions.
Attribute Details
Conversational AI Market CAGR (2023 to 2033) 17.3%
Conversational AI Market HCAGR (2018 to 2022) 15.2%
Conversational AI Market Size - 2023 US$ 9.6 billion
Conversational AI Market Size - 2033 US$ 47.6 billion

Don't pay for what you don't need

Customize your report by selecting specific countries or regions and save 30%!

Conversational AI Reshaping the Market Dynamics

Increasing Customer Demand for Personalised Experiences

Businesses in a variety of industries are seeing the value of providing personalized and seamless consumer experiences. Conversational AI allows businesses to communicate with their customers in a more natural and personalized manner, resulting in greater adoption.

Natural Language Processing (NLP) and Machine Learning advancements

Breakthroughs in NLP algorithms and machine learning approaches have considerably increased conversational AI systems' ability. To interpret and respond to human language, boosting industry development.

Chatbots and Voice Assistants are Gaining Traction

Consumers are increasingly interested in voice assistants and chatbots. These conversational AI systems' simplicity and ease of use have accelerated their adoption in a variety of fields, including customer service, virtual assistants, and smart home devices.

Platforms for Messaging and Communication Expansion

Messaging apps and communication platforms like WhatsApp, Facebook Messenger, and Slack have become ingrained in people's daily lives. Integrating conversational AI capabilities into these platforms improves the user experience and offers up new avenues for businesses to communicate with customers.

Consumer Behaviour and Expectations are Changing

Customers are becoming more at ease interacting with AI-powered devices and have learned to demand personalized and efficient experiences. This shift in consumer behavior and expectations is leading businesses to employ conversational AI solutions to meet these demands.

Increasing Big Data and Cloud Computing Availability

Large amounts of data are now available, and advances in cloud computing infrastructure have laid a solid foundation for the development and deployment of conversational AI solutions. These technologies allow for the processing and analysis of massive amounts of data required for AI model training.

The Conversational AI Frontier: Discovering Untapped Market Potential

E-commerce Customization

By recognizing client preferences, offering product recommendations, and facilitating easy transactions, conversational AI allows personalized shopping experiences. There is a chance to develop AI-powered conversational interfaces that improve consumer engagement, conversion rates, and revenue growth.

Advisory Services in Finance

By providing personalized investment advice, budgeting assistance, and real-time financial information, conversational AI has the potential to disrupt the financial advisory profession. The market opportunity revolves around the development of AI-powered virtual advisors that cater to individual financial goals and deliver data-driven recommendations.

Assistance with Travel and Hospitality

Conversational AI has the potential to revolutionize the travel and hospitality industries by offering personalized suggestions, booking assistance, and real-time customer care. The market opportunity is to develop AI-powered travel concierges that improve client happiness, expedite bookings, and provide personalized travel experiences.

Virtual Assistants in Healthcare

Conversational AI can aid the healthcare business by adopting virtual assistants that can answer medical questions, book appointments, and provide basic healthcare counseling. The market opportunity is in creating HIPAA-compliant conversational AI technologies that improve patient care and streamline Administrative Processes.

Collaboration and Virtual meetings

With the advent of remote work comes an increased demand for AI-powered conversational interfaces that improve virtual meetings, simplify collaboration, and automate administrative tasks. The market opportunity entails developing intelligent virtual meeting assistants that help with communication, agenda management, and productivity.

Sudip Saha
Sudip Saha

Principal Consultant

Talk to Analyst

Find your sweet spots for generating winning opportunities in this market.

Addressing the Elephant in the Room: Restraints Faced by the Conversational AI Market

Concerns about Data Privacy and Security

Conversational AI is based on collecting and analyzing massive volumes of user data, which creates privacy and security problems. Stricter rules and customer fear may impede the market growth.

Concerns about Ethics and Bias

Conversational AI systems may display biases or discriminatory behavior unwittingly, mirroring the biases contained in the training data. Addressing these ethical considerations and guaranteeing justice in AI systems represents a big industry challenge.

Adoption and Resistance by Users

Due to a lack of familiarity, fears about job displacement, or a preference for human connection, some consumers may be hesitant to adopt conversational AI. It can be difficult to persuade people of the benefits and utility of conversational AI.

Dependence on Internet Access

To work properly, many conversational AI applications require a stable internet connection. In some areas, limited or unreliable internet access can stymie user adoption and usage.

Natural Language Understanding (NLU) is lacking

Conversational AI systems are built to recognize and respond to human language. Accurate and contextually relevant responses, on the other hand, might be difficult to achieve, leading to user annoyance and discontent.

Comparative View of the Adjacent Conversational AI Industry

Conversational AI Market:

Attributes Conversational AI Market
CAGR (From 2023 to 2033) 17.3%
Market Value (2023) US$ 9.6 billion
Growth Factor Increasing customer demand for personalized experiences.
Opportunity The increasing use of virtual assistants and chatbots.
Key Trends Increasing need for automation and cost savings in customer service.

Conversational Intelligence Software Market:

Attributes Conversational Intelligence Software Market
CAGR (From 2023 to 2033) 7.2%
Market Value (2023) US$ 23.11 billion
Growth Factor In customer care and assistance, there is an increasing demand for virtual assistants and chatbots.
Opportunity There is an increasing demand for personalized and engaging user experiences in digital apps.
Key Trends The adoption of AI and natural language processing technology is increasing.

Voice Recognition Market:

Attributes Voice Recognition Market
CAGR (From 2023 to 2033) 19.8%
Market Value (2023) US$ 6.30 billion
Growth Factor Voice-controlled gadgets and applications are becoming increasingly popular.
Opportunity Artificial intelligence and machine learning technologies are becoming more popular.
Key Trends There is an increasing demand for efficient and convenient human-machine interaction.

Get the data you need at a Fraction of the cost

Personalize your report by choosing insights you need
and save 40%!

Segmentation Outlook

Segment Component
Segment Name Solution
Segment Share 59.3%
Segment Type
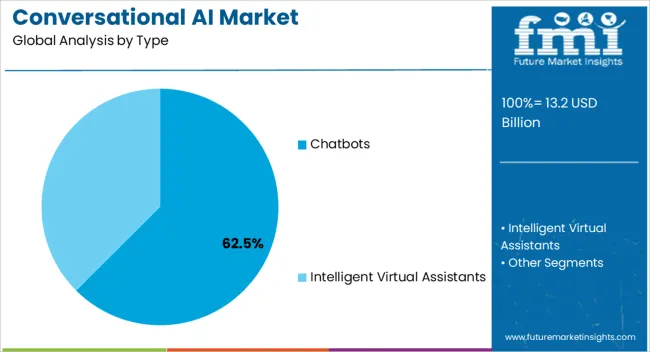
Segment Name Chatbots
Segment Share 63.2%

Exploring the Component Landscape in Conversational AI Market

Services may account for a significant market share by component, with a CAGR of 16.6%. The functionality of conversational AI solutions depends heavily on the services sector. Solution and service providers handle these services, which is a necessary step in deploying technology solutions.

Due to the expanding demand for better customer service across key industries including BFSI, media and entertainment, and travel, conversational AI solutions are becoming more and more in demand internationally.

Types of Conversational AI Solutions Shaping the Market

The chatbot sub-segment is anticipated to generate the most income by type over the projection period. The popularity of chatbots, which offer 24/7 customer support and enhance the customer experience, is a key factor in the sub-segment's quick growth.

Many industries, including finance, government, retail & eCommerce, travel & hospitality, and telecommunications, have shifted their focus to promptly responding to customer inquiries.

Escalating Transformation across Enterprises: Exploring the Adoption of Conversational AI by Large Enterprises and SMEs

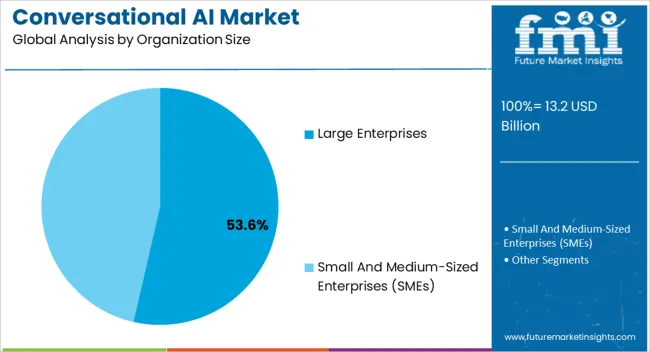
Large organizations and small and medium-sized enterprises (SMEs) are both in great demand in the conversational AI industry, albeit for different reasons. Large organizations, with their large resources and established customer bases, frequently seek advanced conversational AI solutions. To improve customer experience, automate operations, and boost operational efficiency. They have the resources to invest in strong and customized conversational AI systems.

SMEs are quickly recognizing the advantages of conversational AI in improving customer interactions, growing operations, and obtaining a competitive advantage. With more inexpensive and scalable solutions becoming available, SMEs are embracing Conversational AI to improve customer service, optimize sales processes, and expand their reach.

Overall, while large organizations may have a higher demand in terms of total numbers, SMEs are fast adopting conversational AI. Due to its potential to level the playing field and uncover new prospects for economic growth.

Choosing the Path: Deployment Modes Shaping the Conversational AI Industry

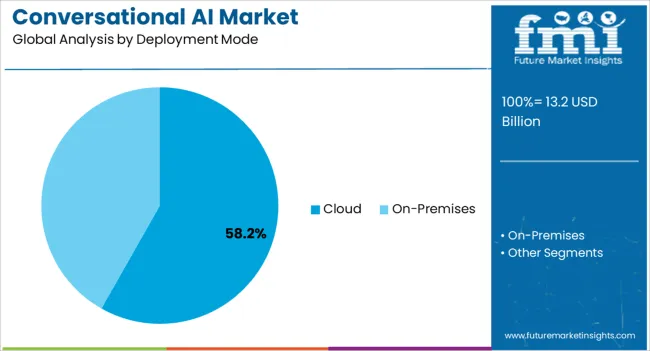
The deployment mode sector in the conversational AI market may be split into two groups: cloud and on-premises. The cloud deployment technique is currently in great demand and is flourishing on the market. Numerous benefits, including scalability, flexibility, ease of installation, and cost-effectiveness, are provided by cloud-based conversational AI solutions.

They do away with the requirement for complex infrastructure setup and upkeep, enabling organizations to benefit from conversational AI without making significant upfront investments. A simplified and interconnected ecosystem is made possible by cloud deployment's seamless connectivity with other cloud-based apps and services. The market for conversational AI is expanding as a result of the growing acceptance of the cloud deployment strategy.

Transforming Industries: Vertical Applications Driving the Conversational AI Market

The Banking, Finance Services, and Insurance (BFSI) industry has a strong demand for conversational AI solutions among the verticals mentioned in the Conversational AI market. This industry has a high demand for quick customer service, and personalized financial advice, and secures transactional processes.

Conversational AI technology allows virtual assistants and chatbots to address client inquiries, provide real-time financial analytics, help with account management, and provide personalized suggestions. With rising client expectations for seamless digital experiences and around-the-clock help, the BFSI sector recognizes the importance of conversational AI. In improving customer engagement, operational efficiency, and overall customer happiness.

Regional Outlook

Countries 2023 Value Share in Global Market
North America 30.5%
Europe 24.3%
Countries 2023 Value Share in Global Market
United States 21.1%
Germany 10.4%
Japan 7.5%
Australia 2.6%
Countries CAGR
China 16.5%
India 19.2%
United Kingdom 18.2%

Navigating the Conversational AI Frontier: Unleashing the Potential of North America's Market

When it comes to the adoption of conversational AI, North America is at the forefront. Key technology businesses, widespread internet use, and sophisticated infrastructure all support market expansion. In particular, conversational AI has been widely adopted across industries in the United States. The area is known for its dedication to innovation, with numerous businesses and academic institutions spearheading developments in conversational AI technology.

Revolutionizing Europe: The Conversational AI Market's Rise to Prominence

Another important region in the conversational AI business in Europe. Adoption is rising significantly in nations like the United Kingdom, Germany, France, and the Nordic nations. In the region, conversational AI is widely employed to improve customer experience and streamline operations in customer-centric industries including retail, banking, and telecoms. Governments in Europe have supported the advancement of AI technology, creating a favorable climate for the market for conversational AI to expand.

Transforming Communication: Unleashing the Potential of Conversational AI in the Asia Pacific

The conversational AI market is expanding quickly in the Asia Pacific area. Key contributors to this expansion include South Korea, China, Japan, India, and other nations. A big population, expanding smartphone penetration, and more digitalization across industries are factors promoting adoption. For instance, large IT companies in China are significantly investing in conversational AI, and the sector is seeing tremendous advancements in chatbots and voice assistants. Additionally, the region offers prospects for conversational AI applications in industries including banking, healthcare, and e-commerce.

Who are the Key Competitors in the Conversational AI Market?

With a sizable conversational AI market share, these firms are concentrating on growing their consumer base in new countries. These businesses are making use of strategic collaboration initiatives to grow their market share and profits.

Mid-size and smaller businesses, on the other hand, are expanding their market presence. By gaining new contracts and entering new markets, thanks to technical developments and product innovations.

Recent Advancements:

Date March 2021
Company Google Cloud
Details Google Cloud announced the general availability of Vertex AI, a managed machine learning (ML) platform that allows companies to accelerate the deployment and maintenance of artificial intelligence (AI) models.
Date April 2021
Company Microsoft
Details Microsoft announced the acquisition of an AI-based technology company, Nuance Communications, for US$ 19.7 billion in an all-cash transaction. The acquisition of Nuance expand Microsoft’s capabilities in voice recognition and transcription technology
Date September 202
Company Astro
Details Astro is a new and different kind of robot, one that’s designed to help customers with a range of tasks such as home monitoring and keeping in touch with family.
Date January 2020
Company AWS
Details AWS made Amazon Lex chatbot integration available in Amazon Connect in the Asia Pacific (Sydney) AWS region. Amazon Lex chatbots can assist users in changing passwords, bringing up requested account balances, and scheduling an appointment by vocalizing a prompt.

Key Players

  • Google
  • Microsoft
  • IBM
  • AWS
  • Baidu
  • Oracle
  • SAP
  • FIS
  • Artificial Solutions
  • Kore.ai
  • Conversica
  • Inbenta
  • Creative Virtual
  • SoundHound
  • Avaamo
  • Haptik
  • Solvvy
  • MindMeld
  • Kasisto
  • Gupshup

Key Segments

By Component:

  • Solution
  • Services
    • Training and Consulting Services
    • System Integration and Implementation Services
    • Support and Maintenance Services

By Type:

  • Chatbots
  • Intelligent Virtual Assistants

By Deployment Mode:

  • Cloud
  • On-Premises

By Organization Size:

  • Large Enterprises
  • Small and Medium-Sized Enterprises (SMEs)

By Mode of Integration:

  • Web Based
  • App Based
  • Telephonic

By Technology

  • Machine Learning and Deep Learning
  • Natural Language Processing
  • Automatic Speech Recognition

By Business Function:

  • Sales
  • Finance
  • HR
  • Operations
  • IT Service Management

By Vertical:

  • Banking Finance Services and Insurance
  • Healthcare and Life Sciences
  • IT and Telecom
  • Retail and eCommerce
  • Travel and Hospitality
  • Media and Entertainment
  • Automotive
  • Others (Government, Education, Energy and Utilities, and Manufacturing)

By Region:

  • North America
  • Latin America
  • Europe
  • Asia Pacific
  • The Middle East and Africa(MEA)

Frequently Asked Questions

What is the Present Market Value in 2023?

The market in 2023 is valued at US$ 9.6 billion.

How was the Historical Performance of the Market?

The market secured a 15.2% CAGR from 2018 to 2022.

Which is the Top Type Segment?

Chatbots remain the most preferred.

What is the Estimated Market Value of the United States Market in 2033?

By 2033, the United States is estimated to reach US$ 47.6 billion in 2033.

Who are the Leading Industry Players?

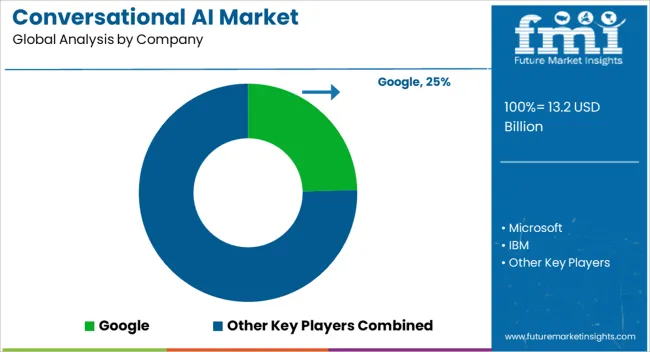
Google, Microsoft, and IBM are the leading industry players.

Table of Content

1. Executive Summary

    1.1. Global Market Outlook

    1.2. Demand-side Trends

    1.3. Supply-side Trends

    1.4. Technology Roadmap Analysis

    1.5. Analysis and Recommendations

2. Market Overview

    2.1. Market Coverage / Taxonomy

    2.2. Market Definition / Scope / Limitations

3. Market Background

    3.1. Market Dynamics

        3.1.1. Drivers

        3.1.2. Restraints

        3.1.3. Opportunity

        3.1.4. Trends

    3.2. Scenario Forecast

        3.2.1. Demand in Optimistic Scenario

        3.2.2. Demand in Likely Scenario

        3.2.3. Demand in Conservative Scenario

    3.3. Opportunity Map Analysis

    3.4. Investment Feasibility Matrix

    3.5. PESTLE and Porter’s Analysis

    3.6. Regulatory Landscape

        3.6.1. By Key Regions

        3.6.2. By Key Countries

    3.7. Regional Parent Market Outlook

4. Global Market Analysis 2018 to 2022 and Forecast, 2023 to 2033

    4.1. Historical Market Size Value (US$ Million) Analysis, 2018 to 2022

    4.2. Current and Future Market Size Value (US$ Million) Projections, 2023 to 2033

        4.2.1. Y-o-Y Growth Trend Analysis

        4.2.2. Absolute $ Opportunity Analysis

5. Global Market Analysis 2018 to 2022 and Forecast 2023 to 2033, By Component

    5.1. Introduction / Key Findings

    5.2. Historical Market Size Value (US$ Million) Analysis By Component, 2018 to 2022

    5.3. Current and Future Market Size Value (US$ Million) Analysis and Forecast By Component, 2023 to 2033

        5.3.1. Solution

        5.3.2. Services

            5.3.2.1. Training and Consulting Services

            5.3.2.2. System Integration and Implementation Services

            5.3.2.3. Support and Maintenance Services

    5.4. Y-o-Y Growth Trend Analysis By Component, 2018 to 2022

    5.5. Absolute $ Opportunity Analysis By Component, 2023 to 2033

6. Global Market Analysis 2018 to 2022 and Forecast 2023 to 2033, By Type

    6.1. Introduction / Key Findings

    6.2. Historical Market Size Value (US$ Million) Analysis By Type, 2018 to 2022

    6.3. Current and Future Market Size Value (US$ Million) Analysis and Forecast By Type, 2023 to 2033

        6.3.1. Chatbots

        6.3.2. Intelligent Virtual Assistants

    6.4. Y-o-Y Growth Trend Analysis By Type, 2018 to 2022

    6.5. Absolute $ Opportunity Analysis By Type, 2023 to 2033

7. Global Market Analysis 2018 to 2022 and Forecast 2023 to 2033, By Deployment Mode

    7.1. Introduction / Key Findings

    7.2. Historical Market Size Value (US$ Million) Analysis By Deployment Mode, 2018 to 2022

    7.3. Current and Future Market Size Value (US$ Million) Analysis and Forecast By Deployment Mode, 2023 to 2033

        7.3.1. Cloud

        7.3.2. On-Premises

    7.4. Y-o-Y Growth Trend Analysis By Deployment Mode, 2018 to 2022

    7.5. Absolute $ Opportunity Analysis By Deployment Mode, 2023 to 2033

8. Global Market Analysis 2018 to 2022 and Forecast 2023 to 2033, By Organization Size

    8.1. Introduction / Key Findings

    8.2. Historical Market Size Value (US$ Million) Analysis By Organization Size, 2018 to 2022

    8.3. Current and Future Market Size Value (US$ Million) Analysis and Forecast By Organization Size, 2023 to 2033

        8.3.1. Large Enterprises

        8.3.2. Small and Medium-Sized Enterprises (SMEs)

    8.4. Y-o-Y Growth Trend Analysis By Organization Size, 2018 to 2022

    8.5. Absolute $ Opportunity Analysis By Organization Size, 2023 to 2033

9. Global Market Analysis 2018 to 2022 and Forecast 2023 to 2033, By Mode of Integration

    9.1. Introduction / Key Findings

    9.2. Historical Market Size Value (US$ Million) Analysis By Mode of Integration, 2018 to 2022

    9.3. Current and Future Market Size Value (US$ Million) Analysis and Forecast By Mode of Integration, 2023 to 2033

        9.3.1. Web-Based

        9.3.2. App-based

        9.3.3. Telephonic

    9.4. Y-o-Y Growth Trend Analysis By Mode of Integration, 2018 to 2022

    9.5. Absolute $ Opportunity Analysis By Mode of Integration, 2023 to 2033

10. Global Market Analysis 2018 to 2022 and Forecast 2023 to 2033, By Technology

    10.1. Introduction / Key Findings

    10.2. Historical Market Size Value (US$ Million) Analysis By Technology, 2018 to 2022

    10.3. Current and Future Market Size Value (US$ Million) Analysis and Forecast By Technology, 2023 to 2033

        10.3.1. Machine Learning and Deep Learning

        10.3.2. Natural Language Processing

        10.3.3. Automatic Speech Recognition

    10.4. Y-o-Y Growth Trend Analysis By Technology, 2018 to 2022

    10.5. Absolute $ Opportunity Analysis By Technology, 2023 to 2033

11. Global Market Analysis 2018 to 2022 and Forecast 2023 to 2033, By Vertical

    11.1. Introduction / Key Findings

    11.2. Historical Market Size Value (US$ Million) Analysis By Vertical, 2018 to 2022

    11.3. Current and Future Market Size Value (US$ Million) Analysis and Forecast By Vertical, 2023 to 2033

        11.3.1. BFSI

        11.3.2. Healthcare and Life Sciences

        11.3.3. IT and Telecom

        11.3.4. Retail and eCommerce

        11.3.5. Travel and Hospitality

        11.3.6. Media and Entertainment

        11.3.7. Automotive

        11.3.8. Others

    11.4. Y-o-Y Growth Trend Analysis By Vertical, 2018 to 2022

    11.5. Absolute $ Opportunity Analysis By Vertical, 2023 to 2033

12. Global Market Analysis 2018 to 2022 and Forecast 2023 to 2033, By Region

    12.1. Introduction

    12.2. Historical Market Size Value (US$ Million) Analysis By Region, 2018 to 2022

    12.3. Current Market Size Value (US$ Million) Analysis and Forecast By Region, 2023 to 2033

        12.3.1. North America

        12.3.2. Latin America

        12.3.3. Europe

        12.3.4. South Asia

        12.3.5. East Asia

        12.3.6. Oceania

        12.3.7. MEA

    12.4. Market Attractiveness Analysis By Region

13. North America Market Analysis 2018 to 2022 and Forecast 2023 to 2033, By Country

    13.1. Historical Market Size Value (US$ Million) Trend Analysis By Market Taxonomy, 2018 to 2022

    13.2. Market Size Value (US$ Million) Forecast By Market Taxonomy, 2023 to 2033

        13.2.1. By Country

            13.2.1.1. The USA

            13.2.1.2. Canada

        13.2.2. By Component

        13.2.3. By Type

        13.2.4. By Deployment Mode

        13.2.5. By Organization Size

        13.2.6. By Mode of Integration

        13.2.7. By Technology

        13.2.8. By Vertical

    13.3. Market Attractiveness Analysis

        13.3.1. By Country

        13.3.2. By Component

        13.3.3. By Type

        13.3.4. By Deployment Mode

        13.3.5. By Organization Size

        13.3.6. By Mode of Integration

        13.3.7. By Technology

        13.3.8. By Vertical

    13.4. Key Takeaways

14. Latin America Market Analysis 2018 to 2022 and Forecast 2023 to 2033, By Country

    14.1. Historical Market Size Value (US$ Million) Trend Analysis By Market Taxonomy, 2018 to 2022

    14.2. Market Size Value (US$ Million) Forecast By Market Taxonomy, 2023 to 2033

        14.2.1. By Country

            14.2.1.1. Brazil

            14.2.1.2. Mexico

            14.2.1.3. Rest of Latin America

        14.2.2. By Component

        14.2.3. By Type

        14.2.4. By Deployment Mode

        14.2.5. By Organization Size

        14.2.6. By Mode of Integration

        14.2.7. By Technology

        14.2.8. By Vertical

    14.3. Market Attractiveness Analysis

        14.3.1. By Country

        14.3.2. By Component

        14.3.3. By Type

        14.3.4. By Deployment Mode

        14.3.5. By Organization Size

        14.3.6. By Mode of Integration

        14.3.7. By Technology

        14.3.8. By Vertical

    14.4. Key Takeaways

15. Europe Market Analysis 2018 to 2022 and Forecast 2023 to 2033, By Country

    15.1. Historical Market Size Value (US$ Million) Trend Analysis By Market Taxonomy, 2018 to 2022

    15.2. Market Size Value (US$ Million) Forecast By Market Taxonomy, 2023 to 2033

        15.2.1. By Country

            15.2.1.1. Germany

            15.2.1.2. United Kingdom

            15.2.1.3. France

            15.2.1.4. Spain

            15.2.1.5. Italy

            15.2.1.6. Rest of Europe

        15.2.2. By Component

        15.2.3. By Type

        15.2.4. By Deployment Mode

        15.2.5. By Organization Size

        15.2.6. By Mode of Integration

        15.2.7. By Technology

        15.2.8. By Vertical

    15.3. Market Attractiveness Analysis

        15.3.1. By Country

        15.3.2. By Component

        15.3.3. By Type

        15.3.4. By Deployment Mode

        15.3.5. By Organization Size

        15.3.6. By Mode of Integration

        15.3.7. By Technology

        15.3.8. By Vertical

    15.4. Key Takeaways

16. South Asia Market Analysis 2018 to 2022 and Forecast 2023 to 2033, By Country

    16.1. Historical Market Size Value (US$ Million) Trend Analysis By Market Taxonomy, 2018 to 2022

    16.2. Market Size Value (US$ Million) Forecast By Market Taxonomy, 2023 to 2033

        16.2.1. By Country

            16.2.1.1. India

            16.2.1.2. Malaysia

            16.2.1.3. Singapore

            16.2.1.4. Thailand

            16.2.1.5. Rest of South Asia

        16.2.2. By Component

        16.2.3. By Type

        16.2.4. By Deployment Mode

        16.2.5. By Organization Size

        16.2.6. By Mode of Integration

        16.2.7. By Technology

        16.2.8. By Vertical

    16.3. Market Attractiveness Analysis

        16.3.1. By Country

        16.3.2. By Component

        16.3.3. By Type

        16.3.4. By Deployment Mode

        16.3.5. By Organization Size

        16.3.6. By Mode of Integration

        16.3.7. By Technology

        16.3.8. By Vertical

    16.4. Key Takeaways

17. East Asia Market Analysis 2018 to 2022 and Forecast 2023 to 2033, By Country

    17.1. Historical Market Size Value (US$ Million) Trend Analysis By Market Taxonomy, 2018 to 2022

    17.2. Market Size Value (US$ Million) Forecast By Market Taxonomy, 2023 to 2033

        17.2.1. By Country

            17.2.1.1. China

            17.2.1.2. Japan

            17.2.1.3. South Korea

        17.2.2. By Component

        17.2.3. By Type

        17.2.4. By Deployment Mode

        17.2.5. By Organization Size

        17.2.6. By Mode of Integration

        17.2.7. By Technology

        17.2.8. By Vertical

    17.3. Market Attractiveness Analysis

        17.3.1. By Country

        17.3.2. By Component

        17.3.3. By Type

        17.3.4. By Deployment Mode

        17.3.5. By Organization Size

        17.3.6. By Mode of Integration

        17.3.7. By Technology

        17.3.8. By Vertical

    17.4. Key Takeaways

18. Oceania Market Analysis 2018 to 2022 and Forecast 2023 to 2033, By Country

    18.1. Historical Market Size Value (US$ Million) Trend Analysis By Market Taxonomy, 2018 to 2022

    18.2. Market Size Value (US$ Million) Forecast By Market Taxonomy, 2023 to 2033

        18.2.1. By Country

            18.2.1.1. Australia

            18.2.1.2. New Zealand

        18.2.2. By Component

        18.2.3. By Type

        18.2.4. By Deployment Mode

        18.2.5. By Organization Size

        18.2.6. By Mode of Integration

        18.2.7. By Technology

        18.2.8. By Vertical

    18.3. Market Attractiveness Analysis

        18.3.1. By Country

        18.3.2. By Component

        18.3.3. By Type

        18.3.4. By Deployment Mode

        18.3.5. By Organization Size

        18.3.6. By Mode of Integration

        18.3.7. By Technology

        18.3.8. By Vertical

    18.4. Key Takeaways

19. MEA Market Analysis 2018 to 2022 and Forecast 2023 to 2033, By Country

    19.1. Historical Market Size Value (US$ Million) Trend Analysis By Market Taxonomy, 2018 to 2022

    19.2. Market Size Value (US$ Million) Forecast By Market Taxonomy, 2023 to 2033

        19.2.1. By Country

            19.2.1.1. GCC Countries

            19.2.1.2. South Africa

            19.2.1.3. Israel

            19.2.1.4. Rest of MEA

        19.2.2. By Component

        19.2.3. By Type

        19.2.4. By Deployment Mode

        19.2.5. By Organization Size

        19.2.6. By Mode of Integration

        19.2.7. By Technology

        19.2.8. By Vertical

    19.3. Market Attractiveness Analysis

        19.3.1. By Country

        19.3.2. By Component

        19.3.3. By Type

        19.3.4. By Deployment Mode

        19.3.5. By Organization Size

        19.3.6. By Mode of Integration

        19.3.7. By Technology

        19.3.8. By Vertical

    19.4. Key Takeaways

20. Key Countries Market Analysis

    20.1. USA

        20.1.1. Pricing Analysis

        20.1.2. Market Share Analysis, 2022

            20.1.2.1. By Component

            20.1.2.2. By Type

            20.1.2.3. By Deployment Mode

            20.1.2.4. By Organization Size

            20.1.2.5. By Mode of Integration

            20.1.2.6. By Technology

            20.1.2.7. By Vertical

    20.2. Canada

        20.2.1. Pricing Analysis

        20.2.2. Market Share Analysis, 2022

            20.2.2.1. By Component

            20.2.2.2. By Type

            20.2.2.3. By Deployment Mode

            20.2.2.4. By Organization Size

            20.2.2.5. By Mode of Integration

            20.2.2.6. By Technology

            20.2.2.7. By Vertical

    20.3. Brazil

        20.3.1. Pricing Analysis

        20.3.2. Market Share Analysis, 2022

            20.3.2.1. By Component

            20.3.2.2. By Type

            20.3.2.3. By Deployment Mode

            20.3.2.4. By Organization Size

            20.3.2.5. By Mode of Integration

            20.3.2.6. By Technology

            20.3.2.7. By Vertical

    20.4. Mexico

        20.4.1. Pricing Analysis

        20.4.2. Market Share Analysis, 2022

            20.4.2.1. By Component

            20.4.2.2. By Type

            20.4.2.3. By Deployment Mode

            20.4.2.4. By Organization Size

            20.4.2.5. By Mode of Integration

            20.4.2.6. By Technology

            20.4.2.7. By Vertical

    20.5. Germany

        20.5.1. Pricing Analysis

        20.5.2. Market Share Analysis, 2022

            20.5.2.1. By Component

            20.5.2.2. By Type

            20.5.2.3. By Deployment Mode

            20.5.2.4. By Organization Size

            20.5.2.5. By Mode of Integration

            20.5.2.6. By Technology

            20.5.2.7. By Vertical

    20.6. United Kingdom

        20.6.1. Pricing Analysis

        20.6.2. Market Share Analysis, 2022

            20.6.2.1. By Component

            20.6.2.2. By Type

            20.6.2.3. By Deployment Mode

            20.6.2.4. By Organization Size

            20.6.2.5. By Mode of Integration

            20.6.2.6. By Technology

            20.6.2.7. By Vertical

    20.7. France

        20.7.1. Pricing Analysis

        20.7.2. Market Share Analysis, 2022

            20.7.2.1. By Component

            20.7.2.2. By Type

            20.7.2.3. By Deployment Mode

            20.7.2.4. By Organization Size

            20.7.2.5. By Mode of Integration

            20.7.2.6. By Technology

            20.7.2.7. By Vertical

    20.8. Spain

        20.8.1. Pricing Analysis

        20.8.2. Market Share Analysis, 2022

            20.8.2.1. By Component

            20.8.2.2. By Type

            20.8.2.3. By Deployment Mode

            20.8.2.4. By Organization Size

            20.8.2.5. By Mode of Integration

            20.8.2.6. By Technology

            20.8.2.7. By Vertical

    20.9. Italy

        20.9.1. Pricing Analysis

        20.9.2. Market Share Analysis, 2022

            20.9.2.1. By Component

            20.9.2.2. By Type

            20.9.2.3. By Deployment Mode

            20.9.2.4. By Organization Size

            20.9.2.5. By Mode of Integration

            20.9.2.6. By Technology

            20.9.2.7. By Vertical

    20.10. India

        20.10.1. Pricing Analysis

        20.10.2. Market Share Analysis, 2022

            20.10.2.1. By Component

            20.10.2.2. By Type

            20.10.2.3. By Deployment Mode

            20.10.2.4. By Organization Size

            20.10.2.5. By Mode of Integration

            20.10.2.6. By Technology

            20.10.2.7. By Vertical

    20.11. Malaysia

        20.11.1. Pricing Analysis

        20.11.2. Market Share Analysis, 2022

            20.11.2.1. By Component

            20.11.2.2. By Type

            20.11.2.3. By Deployment Mode

            20.11.2.4. By Organization Size

            20.11.2.5. By Mode of Integration

            20.11.2.6. By Technology

            20.11.2.7. By Vertical

    20.12. Singapore

        20.12.1. Pricing Analysis

        20.12.2. Market Share Analysis, 2022

            20.12.2.1. By Component

            20.12.2.2. By Type

            20.12.2.3. By Deployment Mode

            20.12.2.4. By Organization Size

            20.12.2.5. By Mode of Integration

            20.12.2.6. By Technology

            20.12.2.7. By Vertical

    20.13. Thailand

        20.13.1. Pricing Analysis

        20.13.2. Market Share Analysis, 2022

            20.13.2.1. By Component

            20.13.2.2. By Type

            20.13.2.3. By Deployment Mode

            20.13.2.4. By Organization Size

            20.13.2.5. By Mode of Integration

            20.13.2.6. By Technology

            20.13.2.7. By Vertical

    20.14. China

        20.14.1. Pricing Analysis

        20.14.2. Market Share Analysis, 2022

            20.14.2.1. By Component

            20.14.2.2. By Type

            20.14.2.3. By Deployment Mode

            20.14.2.4. By Organization Size

            20.14.2.5. By Mode of Integration

            20.14.2.6. By Technology

            20.14.2.7. By Vertical

    20.15. Japan

        20.15.1. Pricing Analysis

        20.15.2. Market Share Analysis, 2022

            20.15.2.1. By Component

            20.15.2.2. By Type

            20.15.2.3. By Deployment Mode

            20.15.2.4. By Organization Size

            20.15.2.5. By Mode of Integration

            20.15.2.6. By Technology

            20.15.2.7. By Vertical

    20.16. South Korea

        20.16.1. Pricing Analysis

        20.16.2. Market Share Analysis, 2022

            20.16.2.1. By Component

            20.16.2.2. By Type

            20.16.2.3. By Deployment Mode

            20.16.2.4. By Organization Size

            20.16.2.5. By Mode of Integration

            20.16.2.6. By Technology

            20.16.2.7. By Vertical

    20.17. Australia

        20.17.1. Pricing Analysis

        20.17.2. Market Share Analysis, 2022

            20.17.2.1. By Component

            20.17.2.2. By Type

            20.17.2.3. By Deployment Mode

            20.17.2.4. By Organization Size

            20.17.2.5. By Mode of Integration

            20.17.2.6. By Technology

            20.17.2.7. By Vertical

    20.18. New Zealand

        20.18.1. Pricing Analysis

        20.18.2. Market Share Analysis, 2022

            20.18.2.1. By Component

            20.18.2.2. By Type

            20.18.2.3. By Deployment Mode

            20.18.2.4. By Organization Size

            20.18.2.5. By Mode of Integration

            20.18.2.6. By Technology

            20.18.2.7. By Vertical

    20.19. GCC Countries

        20.19.1. Pricing Analysis

        20.19.2. Market Share Analysis, 2022

            20.19.2.1. By Component

            20.19.2.2. By Type

            20.19.2.3. By Deployment Mode

            20.19.2.4. By Organization Size

            20.19.2.5. By Mode of Integration

            20.19.2.6. By Technology

            20.19.2.7. By Vertical

    20.20. South Africa

        20.20.1. Pricing Analysis

        20.20.2. Market Share Analysis, 2022

            20.20.2.1. By Component

            20.20.2.2. By Type

            20.20.2.3. By Deployment Mode

            20.20.2.4. By Organization Size

            20.20.2.5. By Mode of Integration

            20.20.2.6. By Technology

            20.20.2.7. By Vertical

    20.21. Israel

        20.21.1. Pricing Analysis

        20.21.2. Market Share Analysis, 2022

            20.21.2.1. By Component

            20.21.2.2. By Type

            20.21.2.3. By Deployment Mode

            20.21.2.4. By Organization Size

            20.21.2.5. By Mode of Integration

            20.21.2.6. By Technology

            20.21.2.7. By Vertical

21. Market Structure Analysis

    21.1. Competition Dashboard

    21.2. Competition Benchmarking

    21.3. Market Share Analysis of Top Players

        21.3.1. By Regional

        21.3.2. By Component

        21.3.3. By Type

        21.3.4. By Deployment Mode

        21.3.5. By Organization Size

        21.3.6. By Mode of Integration

        21.3.7. By Technology

        21.3.8. By Vertical

22. Competition Analysis

    22.1. Competition Deep Dive

        22.1.1. Google

            22.1.1.1. Overview

            22.1.1.2. Product Portfolio

            22.1.1.3. Profitability by Market Segments

            22.1.1.4. Sales Footprint

            22.1.1.5. Strategy Overview

                22.1.1.5.1. Marketing Strategy

        22.1.2. Microsoft

            22.1.2.1. Overview

            22.1.2.2. Product Portfolio

            22.1.2.3. Profitability by Market Segments

            22.1.2.4. Sales Footprint

            22.1.2.5. Strategy Overview

                22.1.2.5.1. Marketing Strategy

        22.1.3. IBM

            22.1.3.1. Overview

            22.1.3.2. Product Portfolio

            22.1.3.3. Profitability by Market Segments

            22.1.3.4. Sales Footprint

            22.1.3.5. Strategy Overview

                22.1.3.5.1. Marketing Strategy

        22.1.4. AWS

            22.1.4.1. Overview

            22.1.4.2. Product Portfolio

            22.1.4.3. Profitability by Market Segments

            22.1.4.4. Sales Footprint

            22.1.4.5. Strategy Overview

                22.1.4.5.1. Marketing Strategy

        22.1.5. Baidu

            22.1.5.1. Overview

            22.1.5.2. Product Portfolio

            22.1.5.3. Profitability by Market Segments

            22.1.5.4. Sales Footprint

            22.1.5.5. Strategy Overview

                22.1.5.5.1. Marketing Strategy

        22.1.6. Oracle

            22.1.6.1. Overview

            22.1.6.2. Product Portfolio

            22.1.6.3. Profitability by Market Segments

            22.1.6.4. Sales Footprint

            22.1.6.5. Strategy Overview

                22.1.6.5.1. Marketing Strategy

        22.1.7. SAP

            22.1.7.1. Overview

            22.1.7.2. Product Portfolio

            22.1.7.3. Profitability by Market Segments

            22.1.7.4. Sales Footprint

            22.1.7.5. Strategy Overview

                22.1.7.5.1. Marketing Strategy

        22.1.8. FIS

            22.1.8.1. Overview

            22.1.8.2. Product Portfolio

            22.1.8.3. Profitability by Market Segments

            22.1.8.4. Sales Footprint

            22.1.8.5. Strategy Overview

                22.1.8.5.1. Marketing Strategy

        22.1.9. Artificial Solutions

            22.1.9.1. Overview

            22.1.9.2. Product Portfolio

            22.1.9.3. Profitability by Market Segments

            22.1.9.4. Sales Footprint

            22.1.9.5. Strategy Overview

                22.1.9.5.1. Marketing Strategy

        22.1.10. Kore.ai

            22.1.10.1. Overview

            22.1.10.2. Product Portfolio

            22.1.10.3. Profitability by Market Segments

            22.1.10.4. Sales Footprint

            22.1.10.5. Strategy Overview

                22.1.10.5.1. Marketing Strategy

        22.1.11. Conversica

            22.1.11.1. Overview

            22.1.11.2. Product Portfolio

            22.1.11.3. Profitability by Market Segments

            22.1.11.4. Sales Footprint

            22.1.11.5. Strategy Overview

                22.1.11.5.1. Marketing Strategy

        22.1.12. Inbenta

            22.1.12.1. Overview

            22.1.12.2. Product Portfolio

            22.1.12.3. Profitability by Market Segments

            22.1.12.4. Sales Footprint

            22.1.12.5. Strategy Overview

                22.1.12.5.1. Marketing Strategy

        22.1.13. Creative Virtual

            22.1.13.1. Overview

            22.1.13.2. Product Portfolio

            22.1.13.3. Profitability by Market Segments

            22.1.13.4. Sales Footprint

            22.1.13.5. Strategy Overview

                22.1.13.5.1. Marketing Strategy

        22.1.14. SoundHound

            22.1.14.1. Overview

            22.1.14.2. Product Portfolio

            22.1.14.3. Profitability by Market Segments

            22.1.14.4. Sales Footprint

            22.1.14.5. Strategy Overview

                22.1.14.5.1. Marketing Strategy

        22.1.15. Avaamo

            22.1.15.1. Overview

            22.1.15.2. Product Portfolio

            22.1.15.3. Profitability by Market Segments

            22.1.15.4. Sales Footprint

            22.1.15.5. Strategy Overview

                22.1.15.5.1. Marketing Strategy

        22.1.16. Haptik

            22.1.16.1. Overview

            22.1.16.2. Product Portfolio

            22.1.16.3. Profitability by Market Segments

            22.1.16.4. Sales Footprint

            22.1.16.5. Strategy Overview

                22.1.16.5.1. Marketing Strategy

        22.1.17. Solvvy

            22.1.17.1. Overview

            22.1.17.2. Product Portfolio

            22.1.17.3. Profitability by Market Segments

            22.1.17.4. Sales Footprint

            22.1.17.5. Strategy Overview

                22.1.17.5.1. Marketing Strategy

        22.1.18. MindMeld

            22.1.18.1. Overview

            22.1.18.2. Product Portfolio

            22.1.18.3. Profitability by Market Segments

            22.1.18.4. Sales Footprint

            22.1.18.5. Strategy Overview

                22.1.18.5.1. Marketing Strategy

        22.1.19. Kasisto

            22.1.19.1. Overview

            22.1.19.2. Product Portfolio

            22.1.19.3. Profitability by Market Segments

            22.1.19.4. Sales Footprint

            22.1.19.5. Strategy Overview

                22.1.19.5.1. Marketing Strategy

        22.1.20. Gupshup

            22.1.20.1. Overview

            22.1.20.2. Product Portfolio

            22.1.20.3. Profitability by Market Segments

            22.1.20.4. Sales Footprint

            22.1.20.5. Strategy Overview

                22.1.20.5.1. Marketing Strategy

23. Assumptions & Acronyms Used

24. Research Methodology

Don't pay for what you don't need

Customize your report by selecting specific countries or regions and save 30%!

List of Tables

Table 1: Global Market Value (US$ Million) Forecast by Region, 2018 to 2033

Table 2: Global Market Value (US$ Million) Forecast by Component, 2018 to 2033

Table 3: Global Market Value (US$ Million) Forecast by Type, 2018 to 2033

Table 4: Global Market Value (US$ Million) Forecast by Deployment Mode, 2018 to 2033

Table 5: Global Market Value (US$ Million) Forecast by Organization Size, 2018 to 2033

Table 6: Global Market Value (US$ Million) Forecast by Mode of Integration, 2018 to 2033

Table 7: Global Market Value (US$ Million) Forecast by Technology, 2018 to 2033

Table 8: Global Market Value (US$ Million) Forecast by Vertical, 2018 to 2033

Table 9: North America Market Value (US$ Million) Forecast by Country, 2018 to 2033

Table 10: North America Market Value (US$ Million) Forecast by Component, 2018 to 2033

Table 11: North America Market Value (US$ Million) Forecast by Type, 2018 to 2033

Table 12: North America Market Value (US$ Million) Forecast by Deployment Mode, 2018 to 2033

Table 13: North America Market Value (US$ Million) Forecast by Organization Size, 2018 to 2033

Table 14: North America Market Value (US$ Million) Forecast by Mode of Integration, 2018 to 2033

Table 15: North America Market Value (US$ Million) Forecast by Technology, 2018 to 2033

Table 16: North America Market Value (US$ Million) Forecast by Vertical, 2018 to 2033

Table 17: Latin America Market Value (US$ Million) Forecast by Country, 2018 to 2033

Table 18: Latin America Market Value (US$ Million) Forecast by Component, 2018 to 2033

Table 19: Latin America Market Value (US$ Million) Forecast by Type, 2018 to 2033

Table 20: Latin America Market Value (US$ Million) Forecast by Deployment Mode, 2018 to 2033

Table 21: Latin America Market Value (US$ Million) Forecast by Organization Size, 2018 to 2033

Table 22: Latin America Market Value (US$ Million) Forecast by Mode of Integration, 2018 to 2033

Table 23: Latin America Market Value (US$ Million) Forecast by Technology, 2018 to 2033

Table 24: Latin America Market Value (US$ Million) Forecast by Vertical, 2018 to 2033

Table 25: Europe Market Value (US$ Million) Forecast by Country, 2018 to 2033

Table 26: Europe Market Value (US$ Million) Forecast by Component, 2018 to 2033

Table 27: Europe Market Value (US$ Million) Forecast by Type, 2018 to 2033

Table 28: Europe Market Value (US$ Million) Forecast by Deployment Mode, 2018 to 2033

Table 29: Europe Market Value (US$ Million) Forecast by Organization Size, 2018 to 2033

Table 30: Europe Market Value (US$ Million) Forecast by Mode of Integration, 2018 to 2033

Table 31: Europe Market Value (US$ Million) Forecast by Technology, 2018 to 2033

Table 32: Europe Market Value (US$ Million) Forecast by Vertical, 2018 to 2033

Table 33: South Asia Market Value (US$ Million) Forecast by Country, 2018 to 2033

Table 34: South Asia Market Value (US$ Million) Forecast by Component, 2018 to 2033

Table 35: South Asia Market Value (US$ Million) Forecast by Type, 2018 to 2033

Table 36: South Asia Market Value (US$ Million) Forecast by Deployment Mode, 2018 to 2033

Table 37: South Asia Market Value (US$ Million) Forecast by Organization Size, 2018 to 2033

Table 38: South Asia Market Value (US$ Million) Forecast by Mode of Integration, 2018 to 2033

Table 39: South Asia Market Value (US$ Million) Forecast by Technology, 2018 to 2033

Table 40: South Asia Market Value (US$ Million) Forecast by Vertical, 2018 to 2033

Table 41: East Asia Market Value (US$ Million) Forecast by Country, 2018 to 2033

Table 42: East Asia Market Value (US$ Million) Forecast by Component, 2018 to 2033

Table 43: East Asia Market Value (US$ Million) Forecast by Type, 2018 to 2033

Table 44: East Asia Market Value (US$ Million) Forecast by Deployment Mode, 2018 to 2033

Table 45: East Asia Market Value (US$ Million) Forecast by Organization Size, 2018 to 2033

Table 46: East Asia Market Value (US$ Million) Forecast by Mode of Integration, 2018 to 2033

Table 47: East Asia Market Value (US$ Million) Forecast by Technology, 2018 to 2033

Table 48: East Asia Market Value (US$ Million) Forecast by Vertical, 2018 to 2033

Table 49: Oceania Market Value (US$ Million) Forecast by Country, 2018 to 2033

Table 50: Oceania Market Value (US$ Million) Forecast by Component, 2018 to 2033

Table 51: Oceania Market Value (US$ Million) Forecast by Type, 2018 to 2033

Table 52: Oceania Market Value (US$ Million) Forecast by Deployment Mode, 2018 to 2033

Table 53: Oceania Market Value (US$ Million) Forecast by Organization Size, 2018 to 2033

Table 54: Oceania Market Value (US$ Million) Forecast by Mode of Integration, 2018 to 2033

Table 55: Oceania Market Value (US$ Million) Forecast by Technology, 2018 to 2033

Table 56: Oceania Market Value (US$ Million) Forecast by Vertical, 2018 to 2033

Table 57: MEA Market Value (US$ Million) Forecast by Country, 2018 to 2033

Table 58: MEA Market Value (US$ Million) Forecast by Component, 2018 to 2033

Table 59: MEA Market Value (US$ Million) Forecast by Type, 2018 to 2033

Table 60: MEA Market Value (US$ Million) Forecast by Deployment Mode, 2018 to 2033

Table 61: MEA Market Value (US$ Million) Forecast by Organization Size, 2018 to 2033

Table 62: MEA Market Value (US$ Million) Forecast by Mode of Integration, 2018 to 2033

Table 63: MEA Market Value (US$ Million) Forecast by Technology, 2018 to 2033

Table 64: MEA Market Value (US$ Million) Forecast by Vertical, 2018 to 2033
Sudip Saha
Sudip Saha

Principal Consultant

Talk to Analyst

Find your sweet spots for generating winning opportunities in this market.

List of Charts

Figure 1: Global Market Value (US$ Million) by Component, 2023 to 2033

Figure 2: Global Market Value (US$ Million) by Type, 2023 to 2033

Figure 3: Global Market Value (US$ Million) by Deployment Mode, 2023 to 2033

Figure 4: Global Market Value (US$ Million) by Organization Size, 2023 to 2033

Figure 5: Global Market Value (US$ Million) by Mode of Integration, 2023 to 2033

Figure 6: Global Market Value (US$ Million) by Technology, 2023 to 2033

Figure 7: Global Market Value (US$ Million) by Vertical, 2023 to 2033

Figure 8: Global Market Value (US$ Million) by Region, 2023 to 2033

Figure 9: Global Market Value (US$ Million) Analysis by Region, 2018 to 2033

Figure 10: Global Market Value Share (%) and BPS Analysis by Region, 2023 to 2033

Figure 11: Global Market Y-o-Y Growth (%) Projections by Region, 2023 to 2033

Figure 12: Global Market Value (US$ Million) Analysis by Component, 2018 to 2033

Figure 13: Global Market Value Share (%) and BPS Analysis by Component, 2023 to 2033

Figure 14: Global Market Y-o-Y Growth (%) Projections by Component, 2023 to 2033

Figure 15: Global Market Value (US$ Million) Analysis by Type, 2018 to 2033

Figure 16: Global Market Value Share (%) and BPS Analysis by Type, 2023 to 2033

Figure 17: Global Market Y-o-Y Growth (%) Projections by Type, 2023 to 2033

Figure 18: Global Market Value (US$ Million) Analysis by Deployment Mode, 2018 to 2033

Figure 19: Global Market Value Share (%) and BPS Analysis by Deployment Mode, 2023 to 2033

Figure 20: Global Market Y-o-Y Growth (%) Projections by Deployment Mode, 2023 to 2033

Figure 21: Global Market Value (US$ Million) Analysis by Organization Size, 2018 to 2033

Figure 22: Global Market Value Share (%) and BPS Analysis by Organization Size, 2023 to 2033

Figure 23: Global Market Y-o-Y Growth (%) Projections by Organization Size, 2023 to 2033

Figure 24: Global Market Value (US$ Million) Analysis by Mode of Integration, 2018 to 2033

Figure 25: Global Market Value Share (%) and BPS Analysis by Mode of Integration, 2023 to 2033

Figure 26: Global Market Y-o-Y Growth (%) Projections by Mode of Integration, 2023 to 2033

Figure 27: Global Market Value (US$ Million) Analysis by Technology, 2018 to 2033

Figure 28: Global Market Value Share (%) and BPS Analysis by Technology, 2023 to 2033

Figure 29: Global Market Y-o-Y Growth (%) Projections by Technology, 2023 to 2033

Figure 30: Global Market Value (US$ Million) Analysis by Vertical, 2018 to 2033

Figure 31: Global Market Value Share (%) and BPS Analysis by Vertical, 2023 to 2033

Figure 32: Global Market Y-o-Y Growth (%) Projections by Vertical, 2023 to 2033

Figure 33: Global Market Attractiveness by Component, 2023 to 2033

Figure 34: Global Market Attractiveness by Type, 2023 to 2033

Figure 35: Global Market Attractiveness by Deployment Mode, 2023 to 2033

Figure 36: Global Market Attractiveness by Organization Size, 2023 to 2033

Figure 37: Global Market Attractiveness by Mode of Integration, 2023 to 2033

Figure 38: Global Market Attractiveness by Technology, 2023 to 2033

Figure 39: Global Market Attractiveness by Vertical, 2023 to 2033

Figure 40: Global Market Attractiveness by Region, 2023 to 2033

Figure 41: North America Market Value (US$ Million) by Component, 2023 to 2033

Figure 42: North America Market Value (US$ Million) by Type, 2023 to 2033

Figure 43: North America Market Value (US$ Million) by Deployment Mode, 2023 to 2033

Figure 44: North America Market Value (US$ Million) by Organization Size, 2023 to 2033

Figure 45: North America Market Value (US$ Million) by Mode of Integration, 2023 to 2033

Figure 46: North America Market Value (US$ Million) by Technology, 2023 to 2033

Figure 47: North America Market Value (US$ Million) by Vertical, 2023 to 2033

Figure 48: North America Market Value (US$ Million) by Country, 2023 to 2033

Figure 49: North America Market Value (US$ Million) Analysis by Country, 2018 to 2033

Figure 50: North America Market Value Share (%) and BPS Analysis by Country, 2023 to 2033

Figure 51: North America Market Y-o-Y Growth (%) Projections by Country, 2023 to 2033

Figure 52: North America Market Value (US$ Million) Analysis by Component, 2018 to 2033

Figure 53: North America Market Value Share (%) and BPS Analysis by Component, 2023 to 2033

Figure 54: North America Market Y-o-Y Growth (%) Projections by Component, 2023 to 2033

Figure 55: North America Market Value (US$ Million) Analysis by Type, 2018 to 2033

Figure 56: North America Market Value Share (%) and BPS Analysis by Type, 2023 to 2033

Figure 57: North America Market Y-o-Y Growth (%) Projections by Type, 2023 to 2033

Figure 58: North America Market Value (US$ Million) Analysis by Deployment Mode, 2018 to 2033

Figure 59: North America Market Value Share (%) and BPS Analysis by Deployment Mode, 2023 to 2033

Figure 60: North America Market Y-o-Y Growth (%) Projections by Deployment Mode, 2023 to 2033

Figure 61: North America Market Value (US$ Million) Analysis by Organization Size, 2018 to 2033

Figure 62: North America Market Value Share (%) and BPS Analysis by Organization Size, 2023 to 2033

Figure 63: North America Market Y-o-Y Growth (%) Projections by Organization Size, 2023 to 2033

Figure 64: North America Market Value (US$ Million) Analysis by Mode of Integration, 2018 to 2033

Figure 65: North America Market Value Share (%) and BPS Analysis by Mode of Integration, 2023 to 2033

Figure 66: North America Market Y-o-Y Growth (%) Projections by Mode of Integration, 2023 to 2033

Figure 67: North America Market Value (US$ Million) Analysis by Technology, 2018 to 2033

Figure 68: North America Market Value Share (%) and BPS Analysis by Technology, 2023 to 2033

Figure 69: North America Market Y-o-Y Growth (%) Projections by Technology, 2023 to 2033

Figure 70: North America Market Value (US$ Million) Analysis by Vertical, 2018 to 2033

Figure 71: North America Market Value Share (%) and BPS Analysis by Vertical, 2023 to 2033

Figure 72: North America Market Y-o-Y Growth (%) Projections by Vertical, 2023 to 2033

Figure 73: North America Market Attractiveness by Component, 2023 to 2033

Figure 74: North America Market Attractiveness by Type, 2023 to 2033

Figure 75: North America Market Attractiveness by Deployment Mode, 2023 to 2033

Figure 76: North America Market Attractiveness by Organization Size, 2023 to 2033

Figure 77: North America Market Attractiveness by Mode of Integration, 2023 to 2033

Figure 78: North America Market Attractiveness by Technology, 2023 to 2033

Figure 79: North America Market Attractiveness by Vertical, 2023 to 2033

Figure 80: North America Market Attractiveness by Country, 2023 to 2033

Figure 81: Latin America Market Value (US$ Million) by Component, 2023 to 2033

Figure 82: Latin America Market Value (US$ Million) by Type, 2023 to 2033

Figure 83: Latin America Market Value (US$ Million) by Deployment Mode, 2023 to 2033

Figure 84: Latin America Market Value (US$ Million) by Organization Size, 2023 to 2033

Figure 85: Latin America Market Value (US$ Million) by Mode of Integration, 2023 to 2033

Figure 86: Latin America Market Value (US$ Million) by Technology, 2023 to 2033

Figure 87: Latin America Market Value (US$ Million) by Vertical, 2023 to 2033

Figure 88: Latin America Market Value (US$ Million) by Country, 2023 to 2033

Figure 89: Latin America Market Value (US$ Million) Analysis by Country, 2018 to 2033

Figure 90: Latin America Market Value Share (%) and BPS Analysis by Country, 2023 to 2033

Figure 91: Latin America Market Y-o-Y Growth (%) Projections by Country, 2023 to 2033

Figure 92: Latin America Market Value (US$ Million) Analysis by Component, 2018 to 2033

Figure 93: Latin America Market Value Share (%) and BPS Analysis by Component, 2023 to 2033

Figure 94: Latin America Market Y-o-Y Growth (%) Projections by Component, 2023 to 2033

Figure 95: Latin America Market Value (US$ Million) Analysis by Type, 2018 to 2033

Figure 96: Latin America Market Value Share (%) and BPS Analysis by Type, 2023 to 2033

Figure 97: Latin America Market Y-o-Y Growth (%) Projections by Type, 2023 to 2033

Figure 98: Latin America Market Value (US$ Million) Analysis by Deployment Mode, 2018 to 2033

Figure 99: Latin America Market Value Share (%) and BPS Analysis by Deployment Mode, 2023 to 2033

Figure 100: Latin America Market Y-o-Y Growth (%) Projections by Deployment Mode, 2023 to 2033

Figure 101: Latin America Market Value (US$ Million) Analysis by Organization Size, 2018 to 2033

Figure 102: Latin America Market Value Share (%) and BPS Analysis by Organization Size, 2023 to 2033

Figure 103: Latin America Market Y-o-Y Growth (%) Projections by Organization Size, 2023 to 2033

Figure 104: Latin America Market Value (US$ Million) Analysis by Mode of Integration, 2018 to 2033

Figure 105: Latin America Market Value Share (%) and BPS Analysis by Mode of Integration, 2023 to 2033

Figure 106: Latin America Market Y-o-Y Growth (%) Projections by Mode of Integration, 2023 to 2033

Figure 107: Latin America Market Value (US$ Million) Analysis by Technology, 2018 to 2033

Figure 108: Latin America Market Value Share (%) and BPS Analysis by Technology, 2023 to 2033

Figure 109: Latin America Market Y-o-Y Growth (%) Projections by Technology, 2023 to 2033

Figure 110: Latin America Market Value (US$ Million) Analysis by Vertical, 2018 to 2033

Figure 111: Latin America Market Value Share (%) and BPS Analysis by Vertical, 2023 to 2033

Figure 112: Latin America Market Y-o-Y Growth (%) Projections by Vertical, 2023 to 2033

Figure 113: Latin America Market Attractiveness by Component, 2023 to 2033

Figure 114: Latin America Market Attractiveness by Type, 2023 to 2033

Figure 115: Latin America Market Attractiveness by Deployment Mode, 2023 to 2033

Figure 116: Latin America Market Attractiveness by Organization Size, 2023 to 2033

Figure 117: Latin America Market Attractiveness by Mode of Integration, 2023 to 2033

Figure 118: Latin America Market Attractiveness by Technology, 2023 to 2033

Figure 119: Latin America Market Attractiveness by Vertical, 2023 to 2033

Figure 120: Latin America Market Attractiveness by Country, 2023 to 2033

Figure 121: Europe Market Value (US$ Million) by Component, 2023 to 2033

Figure 122: Europe Market Value (US$ Million) by Type, 2023 to 2033

Figure 123: Europe Market Value (US$ Million) by Deployment Mode, 2023 to 2033

Figure 124: Europe Market Value (US$ Million) by Organization Size, 2023 to 2033

Figure 125: Europe Market Value (US$ Million) by Mode of Integration, 2023 to 2033

Figure 126: Europe Market Value (US$ Million) by Technology, 2023 to 2033

Figure 127: Europe Market Value (US$ Million) by Vertical, 2023 to 2033

Figure 128: Europe Market Value (US$ Million) by Country, 2023 to 2033

Figure 129: Europe Market Value (US$ Million) Analysis by Country, 2018 to 2033

Figure 130: Europe Market Value Share (%) and BPS Analysis by Country, 2023 to 2033

Figure 131: Europe Market Y-o-Y Growth (%) Projections by Country, 2023 to 2033

Figure 132: Europe Market Value (US$ Million) Analysis by Component, 2018 to 2033

Figure 133: Europe Market Value Share (%) and BPS Analysis by Component, 2023 to 2033

Figure 134: Europe Market Y-o-Y Growth (%) Projections by Component, 2023 to 2033

Figure 135: Europe Market Value (US$ Million) Analysis by Type, 2018 to 2033

Figure 136: Europe Market Value Share (%) and BPS Analysis by Type, 2023 to 2033

Figure 137: Europe Market Y-o-Y Growth (%) Projections by Type, 2023 to 2033

Figure 138: Europe Market Value (US$ Million) Analysis by Deployment Mode, 2018 to 2033

Figure 139: Europe Market Value Share (%) and BPS Analysis by Deployment Mode, 2023 to 2033

Figure 140: Europe Market Y-o-Y Growth (%) Projections by Deployment Mode, 2023 to 2033

Figure 141: Europe Market Value (US$ Million) Analysis by Organization Size, 2018 to 2033

Figure 142: Europe Market Value Share (%) and BPS Analysis by Organization Size, 2023 to 2033

Figure 143: Europe Market Y-o-Y Growth (%) Projections by Organization Size, 2023 to 2033

Figure 144: Europe Market Value (US$ Million) Analysis by Mode of Integration, 2018 to 2033

Figure 145: Europe Market Value Share (%) and BPS Analysis by Mode of Integration, 2023 to 2033

Figure 146: Europe Market Y-o-Y Growth (%) Projections by Mode of Integration, 2023 to 2033

Figure 147: Europe Market Value (US$ Million) Analysis by Technology, 2018 to 2033

Figure 148: Europe Market Value Share (%) and BPS Analysis by Technology, 2023 to 2033

Figure 149: Europe Market Y-o-Y Growth (%) Projections by Technology, 2023 to 2033

Figure 150: Europe Market Value (US$ Million) Analysis by Vertical, 2018 to 2033

Figure 151: Europe Market Value Share (%) and BPS Analysis by Vertical, 2023 to 2033

Figure 152: Europe Market Y-o-Y Growth (%) Projections by Vertical, 2023 to 2033

Figure 153: Europe Market Attractiveness by Component, 2023 to 2033

Figure 154: Europe Market Attractiveness by Type, 2023 to 2033

Figure 155: Europe Market Attractiveness by Deployment Mode, 2023 to 2033

Figure 156: Europe Market Attractiveness by Organization Size, 2023 to 2033

Figure 157: Europe Market Attractiveness by Mode of Integration, 2023 to 2033

Figure 158: Europe Market Attractiveness by Technology, 2023 to 2033

Figure 159: Europe Market Attractiveness by Vertical, 2023 to 2033

Figure 160: Europe Market Attractiveness by Country, 2023 to 2033

Figure 161: South Asia Market Value (US$ Million) by Component, 2023 to 2033

Figure 162: South Asia Market Value (US$ Million) by Type, 2023 to 2033

Figure 163: South Asia Market Value (US$ Million) by Deployment Mode, 2023 to 2033

Figure 164: South Asia Market Value (US$ Million) by Organization Size, 2023 to 2033

Figure 165: South Asia Market Value (US$ Million) by Mode of Integration, 2023 to 2033

Figure 166: South Asia Market Value (US$ Million) by Technology, 2023 to 2033

Figure 167: South Asia Market Value (US$ Million) by Vertical, 2023 to 2033

Figure 168: South Asia Market Value (US$ Million) by Country, 2023 to 2033

Figure 169: South Asia Market Value (US$ Million) Analysis by Country, 2018 to 2033

Figure 170: South Asia Market Value Share (%) and BPS Analysis by Country, 2023 to 2033

Figure 171: South Asia Market Y-o-Y Growth (%) Projections by Country, 2023 to 2033

Figure 172: South Asia Market Value (US$ Million) Analysis by Component, 2018 to 2033

Figure 173: South Asia Market Value Share (%) and BPS Analysis by Component, 2023 to 2033

Figure 174: South Asia Market Y-o-Y Growth (%) Projections by Component, 2023 to 2033

Figure 175: South Asia Market Value (US$ Million) Analysis by Type, 2018 to 2033

Figure 176: South Asia Market Value Share (%) and BPS Analysis by Type, 2023 to 2033

Figure 177: South Asia Market Y-o-Y Growth (%) Projections by Type, 2023 to 2033

Figure 178: South Asia Market Value (US$ Million) Analysis by Deployment Mode, 2018 to 2033

Figure 179: South Asia Market Value Share (%) and BPS Analysis by Deployment Mode, 2023 to 2033

Figure 180: South Asia Market Y-o-Y Growth (%) Projections by Deployment Mode, 2023 to 2033

Figure 181: South Asia Market Value (US$ Million) Analysis by Organization Size, 2018 to 2033

Figure 182: South Asia Market Value Share (%) and BPS Analysis by Organization Size, 2023 to 2033

Figure 183: South Asia Market Y-o-Y Growth (%) Projections by Organization Size, 2023 to 2033

Figure 184: South Asia Market Value (US$ Million) Analysis by Mode of Integration, 2018 to 2033

Figure 185: South Asia Market Value Share (%) and BPS Analysis by Mode of Integration, 2023 to 2033

Figure 186: South Asia Market Y-o-Y Growth (%) Projections by Mode of Integration, 2023 to 2033

Figure 187: South Asia Market Value (US$ Million) Analysis by Technology, 2018 to 2033

Figure 188: South Asia Market Value Share (%) and BPS Analysis by Technology, 2023 to 2033

Figure 189: South Asia Market Y-o-Y Growth (%) Projections by Technology, 2023 to 2033

Figure 190: South Asia Market Value (US$ Million) Analysis by Vertical, 2018 to 2033

Figure 191: South Asia Market Value Share (%) and BPS Analysis by Vertical, 2023 to 2033

Figure 192: South Asia Market Y-o-Y Growth (%) Projections by Vertical, 2023 to 2033

Figure 193: South Asia Market Attractiveness by Component, 2023 to 2033

Figure 194: South Asia Market Attractiveness by Type, 2023 to 2033

Figure 195: South Asia Market Attractiveness by Deployment Mode, 2023 to 2033

Figure 196: South Asia Market Attractiveness by Organization Size, 2023 to 2033

Figure 197: South Asia Market Attractiveness by Mode of Integration, 2023 to 2033

Figure 198: South Asia Market Attractiveness by Technology, 2023 to 2033

Figure 199: South Asia Market Attractiveness by Vertical, 2023 to 2033

Figure 200: South Asia Market Attractiveness by Country, 2023 to 2033

Figure 201: East Asia Market Value (US$ Million) by Component, 2023 to 2033

Figure 202: East Asia Market Value (US$ Million) by Type, 2023 to 2033

Figure 203: East Asia Market Value (US$ Million) by Deployment Mode, 2023 to 2033

Figure 204: East Asia Market Value (US$ Million) by Organization Size, 2023 to 2033

Figure 205: East Asia Market Value (US$ Million) by Mode of Integration, 2023 to 2033

Figure 206: East Asia Market Value (US$ Million) by Technology, 2023 to 2033

Figure 207: East Asia Market Value (US$ Million) by Vertical, 2023 to 2033

Figure 208: East Asia Market Value (US$ Million) by Country, 2023 to 2033

Figure 209: East Asia Market Value (US$ Million) Analysis by Country, 2018 to 2033

Figure 210: East Asia Market Value Share (%) and BPS Analysis by Country, 2023 to 2033

Figure 211: East Asia Market Y-o-Y Growth (%) Projections by Country, 2023 to 2033

Figure 212: East Asia Market Value (US$ Million) Analysis by Component, 2018 to 2033

Figure 213: East Asia Market Value Share (%) and BPS Analysis by Component, 2023 to 2033

Figure 214: East Asia Market Y-o-Y Growth (%) Projections by Component, 2023 to 2033

Figure 215: East Asia Market Value (US$ Million) Analysis by Type, 2018 to 2033

Figure 216: East Asia Market Value Share (%) and BPS Analysis by Type, 2023 to 2033

Figure 217: East Asia Market Y-o-Y Growth (%) Projections by Type, 2023 to 2033

Figure 218: East Asia Market Value (US$ Million) Analysis by Deployment Mode, 2018 to 2033

Figure 219: East Asia Market Value Share (%) and BPS Analysis by Deployment Mode, 2023 to 2033

Figure 220: East Asia Market Y-o-Y Growth (%) Projections by Deployment Mode, 2023 to 2033

Figure 221: East Asia Market Value (US$ Million) Analysis by Organization Size, 2018 to 2033

Figure 222: East Asia Market Value Share (%) and BPS Analysis by Organization Size, 2023 to 2033

Figure 223: East Asia Market Y-o-Y Growth (%) Projections by Organization Size, 2023 to 2033

Figure 224: East Asia Market Value (US$ Million) Analysis by Mode of Integration, 2018 to 2033

Figure 225: East Asia Market Value Share (%) and BPS Analysis by Mode of Integration, 2023 to 2033

Figure 226: East Asia Market Y-o-Y Growth (%) Projections by Mode of Integration, 2023 to 2033

Figure 227: East Asia Market Value (US$ Million) Analysis by Technology, 2018 to 2033

Figure 228: East Asia Market Value Share (%) and BPS Analysis by Technology, 2023 to 2033

Figure 229: East Asia Market Y-o-Y Growth (%) Projections by Technology, 2023 to 2033

Figure 230: East Asia Market Value (US$ Million) Analysis by Vertical, 2018 to 2033

Figure 231: East Asia Market Value Share (%) and BPS Analysis by Vertical, 2023 to 2033

Figure 232: East Asia Market Y-o-Y Growth (%) Projections by Vertical, 2023 to 2033

Figure 233: East Asia Market Attractiveness by Component, 2023 to 2033

Figure 234: East Asia Market Attractiveness by Type, 2023 to 2033

Figure 235: East Asia Market Attractiveness by Deployment Mode, 2023 to 2033

Figure 236: East Asia Market Attractiveness by Organization Size, 2023 to 2033

Figure 237: East Asia Market Attractiveness by Mode of Integration, 2023 to 2033

Figure 238: East Asia Market Attractiveness by Technology, 2023 to 2033

Figure 239: East Asia Market Attractiveness by Vertical, 2023 to 2033

Figure 240: East Asia Market Attractiveness by Country, 2023 to 2033

Figure 241: Oceania Market Value (US$ Million) by Component, 2023 to 2033

Figure 242: Oceania Market Value (US$ Million) by Type, 2023 to 2033

Figure 243: Oceania Market Value (US$ Million) by Deployment Mode, 2023 to 2033

Figure 244: Oceania Market Value (US$ Million) by Organization Size, 2023 to 2033

Figure 245: Oceania Market Value (US$ Million) by Mode of Integration, 2023 to 2033

Figure 246: Oceania Market Value (US$ Million) by Technology, 2023 to 2033

Figure 247: Oceania Market Value (US$ Million) by Vertical, 2023 to 2033

Figure 248: Oceania Market Value (US$ Million) by Country, 2023 to 2033

Figure 249: Oceania Market Value (US$ Million) Analysis by Country, 2018 to 2033

Figure 250: Oceania Market Value Share (%) and BPS Analysis by Country, 2023 to 2033

Figure 251: Oceania Market Y-o-Y Growth (%) Projections by Country, 2023 to 2033

Figure 252: Oceania Market Value (US$ Million) Analysis by Component, 2018 to 2033

Figure 253: Oceania Market Value Share (%) and BPS Analysis by Component, 2023 to 2033

Figure 254: Oceania Market Y-o-Y Growth (%) Projections by Component, 2023 to 2033

Figure 255: Oceania Market Value (US$ Million) Analysis by Type, 2018 to 2033

Figure 256: Oceania Market Value Share (%) and BPS Analysis by Type, 2023 to 2033

Figure 257: Oceania Market Y-o-Y Growth (%) Projections by Type, 2023 to 2033

Figure 258: Oceania Market Value (US$ Million) Analysis by Deployment Mode, 2018 to 2033

Figure 259: Oceania Market Value Share (%) and BPS Analysis by Deployment Mode, 2023 to 2033

Figure 260: Oceania Market Y-o-Y Growth (%) Projections by Deployment Mode, 2023 to 2033

Figure 261: Oceania Market Value (US$ Million) Analysis by Organization Size, 2018 to 2033

Figure 262: Oceania Market Value Share (%) and BPS Analysis by Organization Size, 2023 to 2033

Figure 263: Oceania Market Y-o-Y Growth (%) Projections by Organization Size, 2023 to 2033

Figure 264: Oceania Market Value (US$ Million) Analysis by Mode of Integration, 2018 to 2033

Figure 265: Oceania Market Value Share (%) and BPS Analysis by Mode of Integration, 2023 to 2033

Figure 266: Oceania Market Y-o-Y Growth (%) Projections by Mode of Integration, 2023 to 2033

Figure 267: Oceania Market Value (US$ Million) Analysis by Technology, 2018 to 2033

Figure 268: Oceania Market Value Share (%) and BPS Analysis by Technology, 2023 to 2033

Figure 269: Oceania Market Y-o-Y Growth (%) Projections by Technology, 2023 to 2033

Figure 270: Oceania Market Value (US$ Million) Analysis by Vertical, 2018 to 2033

Figure 271: Oceania Market Value Share (%) and BPS Analysis by Vertical, 2023 to 2033

Figure 272: Oceania Market Y-o-Y Growth (%) Projections by Vertical, 2023 to 2033

Figure 273: Oceania Market Attractiveness by Component, 2023 to 2033

Figure 274: Oceania Market Attractiveness by Type, 2023 to 2033

Figure 275: Oceania Market Attractiveness by Deployment Mode, 2023 to 2033

Figure 276: Oceania Market Attractiveness by Organization Size, 2023 to 2033

Figure 277: Oceania Market Attractiveness by Mode of Integration, 2023 to 2033

Figure 278: Oceania Market Attractiveness by Technology, 2023 to 2033

Figure 279: Oceania Market Attractiveness by Vertical, 2023 to 2033

Figure 280: Oceania Market Attractiveness by Country, 2023 to 2033

Figure 281: MEA Market Value (US$ Million) by Component, 2023 to 2033

Figure 282: MEA Market Value (US$ Million) by Type, 2023 to 2033

Figure 283: MEA Market Value (US$ Million) by Deployment Mode, 2023 to 2033

Figure 284: MEA Market Value (US$ Million) by Organization Size, 2023 to 2033

Figure 285: MEA Market Value (US$ Million) by Mode of Integration, 2023 to 2033

Figure 286: MEA Market Value (US$ Million) by Technology, 2023 to 2033

Figure 287: MEA Market Value (US$ Million) by Vertical, 2023 to 2033

Figure 288: MEA Market Value (US$ Million) by Country, 2023 to 2033

Figure 289: MEA Market Value (US$ Million) Analysis by Country, 2018 to 2033

Figure 290: MEA Market Value Share (%) and BPS Analysis by Country, 2023 to 2033

Figure 291: MEA Market Y-o-Y Growth (%) Projections by Country, 2023 to 2033

Figure 292: MEA Market Value (US$ Million) Analysis by Component, 2018 to 2033

Figure 293: MEA Market Value Share (%) and BPS Analysis by Component, 2023 to 2033

Figure 294: MEA Market Y-o-Y Growth (%) Projections by Component, 2023 to 2033

Figure 295: MEA Market Value (US$ Million) Analysis by Type, 2018 to 2033

Figure 296: MEA Market Value Share (%) and BPS Analysis by Type, 2023 to 2033

Figure 297: MEA Market Y-o-Y Growth (%) Projections by Type, 2023 to 2033

Figure 298: MEA Market Value (US$ Million) Analysis by Deployment Mode, 2018 to 2033

Figure 299: MEA Market Value Share (%) and BPS Analysis by Deployment Mode, 2023 to 2033

Figure 300: MEA Market Y-o-Y Growth (%) Projections by Deployment Mode, 2023 to 2033

Figure 301: MEA Market Value (US$ Million) Analysis by Organization Size, 2018 to 2033

Figure 302: MEA Market Value Share (%) and BPS Analysis by Organization Size, 2023 to 2033

Figure 303: MEA Market Y-o-Y Growth (%) Projections by Organization Size, 2023 to 2033

Figure 304: MEA Market Value (US$ Million) Analysis by Mode of Integration, 2018 to 2033

Figure 305: MEA Market Value Share (%) and BPS Analysis by Mode of Integration, 2023 to 2033

Figure 306: MEA Market Y-o-Y Growth (%) Projections by Mode of Integration, 2023 to 2033

Figure 307: MEA Market Value (US$ Million) Analysis by Technology, 2018 to 2033

Figure 308: MEA Market Value Share (%) and BPS Analysis by Technology, 2023 to 2033

Figure 309: MEA Market Y-o-Y Growth (%) Projections by Technology, 2023 to 2033

Figure 310: MEA Market Value (US$ Million) Analysis by Vertical, 2018 to 2033

Figure 311: MEA Market Value Share (%) and BPS Analysis by Vertical, 2023 to 2033

Figure 312: MEA Market Y-o-Y Growth (%) Projections by Vertical, 2023 to 2033

Figure 313: MEA Market Attractiveness by Component, 2023 to 2033

Figure 314: MEA Market Attractiveness by Type, 2023 to 2033

Figure 315: MEA Market Attractiveness by Deployment Mode, 2023 to 2033

Figure 316: MEA Market Attractiveness by Organization Size, 2023 to 2033

Figure 317: MEA Market Attractiveness by Mode of Integration, 2023 to 2033

Figure 318: MEA Market Attractiveness by Technology, 2023 to 2033

Figure 319: MEA Market Attractiveness by Vertical, 2023 to 2033

Figure 320: MEA Market Attractiveness by Country, 2023 to 2033

Recommendations

Technology

Conversational Marketing Software Market

Published : August 2023

Technology

Voice Over LTE (VOLTE) And Voice Over Wi-Fi Market

Published : November 2022

Explore Technology Insights

View Reports