Reports

- Global Locations -

Headquarters

Future Market Insights, Inc.

Christiana Corporate, 200
Continental Drive, Suite 401,
Newark, Delaware - 19713,
United States

T: +1-845-579-5705

Americas

Future Market Insights, Inc.

616 Corporate Way, Suite 2-9018,
Valley Cottage, NY 10989, United States

T: +1-347-918-3531

MEA

Future Market Insights

1602-6 Jumeirah Bay X2 Tower, Plot No: JLT-PH2-X2A,
Jumeirah Lakes Towers, Dubai,
United Arab Emirates

Europe

Future Market Insights

3rd Floor, 207 Regent Street,
W1B 3HH London
United Kingdom

T: + 44 (0) 20 8123 9659
D: +44 (0) 20 3287 4268

Asia Pacific

Future Market Insights

IndiaLand Global Tech Park, Unit UG-1, Behind Grand HighStreet, Phase 1, Hinjawadi, MH, Pune – 411057, India

Conversational Marketing Software Market Outlook (2023 to 2033)

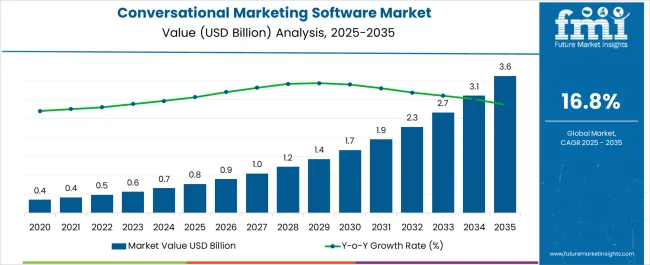
The global conversational marketing software is predicted to be valued at around US$ 553.1 million in 2023. With a projected CAGR of 17.7% for the next ten years, the market is likely to reach a valuation of nearly US$ 2.83 billion by the end of 2033.

Attribute Details
Conversational Marketing Software Market Size (2022) US$ 476.4 million
Conversational Marketing Software Market Size (2023) US$ 553.1 million
Projected Market Value (2033) US$ 2.83 billion
Global Market Growth Rate (2023 to 2033) 17.7% CAGR
North America Market Share (2023) 27.6%
North America Growth Rate (2023 to 2033) 17% CAGR
United States Growth Rate (2023 to 2033) 17.2% CAGR
Key Companies Profiled
  • Drift
  • Snaps
  • Verloop
  • iAdvize
  • LiveWorld
  • Automat
  • Intercom
  • HubSpot
  • Conversica
  • Saleswhale
  • Whisbi
  • Slaask
  • Audiense
  • Spectrm
  • Zoovu

Don't pay for what you don't need

Customize your report by selecting specific countries or regions and save 30%!

Sales Analysis of Conversational Marketing Software Market from 2018 to 2022 Vs. Market Outlook for 2023 to 2033

Future Market Insights reveals that conversational marketing software revenues increased from US$ 266.3 million in 2018 to US$ 476.4 million in 2022. With an absolute dollar opportunity of US$ 553.1 million between 2023 and 2033, the market is projected to reach a valuation of US$ 2.83 billion by 2033.

More than 80% of B2B sales involve complicated buying scenarios, and 60% of purchases involve four or more parties. Knowledgeable customers demand efficiency, simplicity, and top-notch service at every stage of the customer lifecycle, from initial contact to product installation. The transition to a digital-first economy and rising competition across all industries make it more challenging than ever to sell, market, and provide efficient customer service. Therefore, with the advent of conversational marketing software, the online buying process has been changed indefinitely. Conversational marketing software provides users with a customizable experience and generates customer satisfaction, and growth in the customer base, thereby increasing the revenue of the businesses.

What factors are leading to growth in the conversational marketing software market?

The continuous innovation in sales and marketing platforms is driving the need for conversational marketing software to keep up with the competitors. Furthermore, the need to constantly be with the customer while they make purchase decisions is another key factor driving the requirement for conversational marketing tools.

A business recognizes that building a strong relationship with the consumer is crucial to selling or growing a product, and it has been proven as a successful way to use marketing to drive user engagement. Therefore, various consumer brands are leveraging conversational marketing technology to identify known or unknown buyers from different social networks or product websites.

In addition, conversational marketing strategies have developed a customer-centered purchasing process by utilizing intelligent chatbots and customized messaging to interact with leads in real-time. The automated conversation marketing strategy helps companies convert leads more quickly, which makes it simpler for customers to contact the firm through their preferred channel.

Sudip Saha
Sudip Saha

Principal Consultant

Talk to Analyst

Find your sweet spots for generating winning opportunities in this market.

How artificial intelligence is empowering conversational marketing tools?

Conversational AI has transformed the way brands connect, interact and engage with customers. AI through machine learning, natural language processing, automatic speech recognition, and text-to-speech elements, interacts with customers through chatbots and voice bots and enhances their experience. Another key advantage of AI is that it offers consistent experience across all channels. It solves the problem of waiting for hours to connect with an executive to resolve the query and plugs the gap by offering fast response. Conversational AI will progress toward utilizing voice-based support as chatbot technology develops. Since customer satisfaction encourages recurring business as well as optimising an organization's revenue, conversational AI has been shown to be a cost-effective technology.

In light of this, conversational marketing software has a substantial market potential and is anticipated to grow rapidly during the forecast period. According to the survey conducted by Drift and Heinz Marketing, it was observed that 82% of the respondents found that AI-powered conversational marketing helped the sales and marketing strategy.

Region-wise Insights

What is the market outlook for conversational marketing software in Asia-Pacific?

Asia-Pacific provides a lucrative growth option for the development of conversational marketing software. Around 42% of businesses surveyed in Asia-Pacific declared that they have implemented chatbots as a form of customer service automation or are in the process of implanting them in the near future. A huge portion of customer relations is still managed by staff while there is still significant space for the growth of conversational marketing software in the APAC market.

To successfully adopt automation in their businesses, they need to incorporate a human layer into the conversational chatbots to facilitate a friendly interaction with the users and make them comfortable talking to an AI bot. To move forward, companies involved in providing conversational marketing tools have already secured their footprint in Asia-Pacific. For instance, Verloop.io and tech Access Asia entered into strategic partnership to gain access to Verloop.io’s conversational AI platform across the Middle East, LEVANT, and Pakistan and build delightful support experiences without any hassle.
Get the data you need at a Fraction of the cost

Personalize your report by choosing insights you need
and save 40%!

Country-wise Insights

How is the market for conversational marketing software shaping up in the United States?

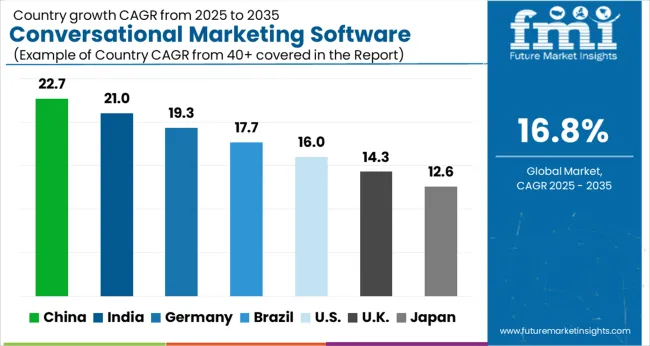
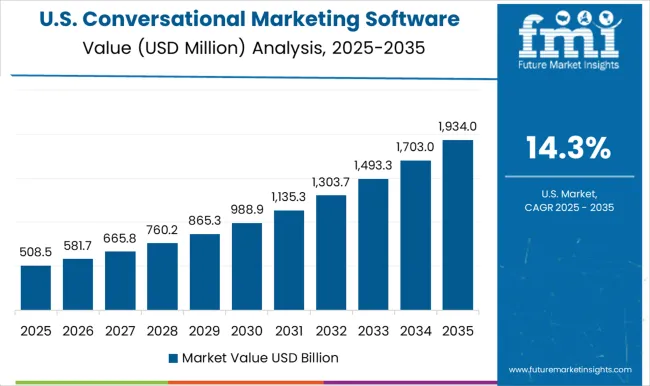
Conversational marketing software in the United States is projected to be valued at US$ 843.8 million by 2033. Revenue through conversational marketing software flourished at a CAGR of 31.4% during 2018 to 2022. Growth in the market is attributed to a rise in the number of enterprises and the presence of a large number of vendors providing conversational marketing solutions. For instance, iAdvize expanded its presence in the United States in the sales and marketing domains to secure its footprint in the United States. The expected growth rate in conversational marketing software in the United States is estimated at 17.2% CAGR over the forecasted period. It is projected that the United States will become a market with an absolute dollar opportunity growth of US$ 671.4 million by 2033.

Category-wise Insights

What is the market outlook for cloud-based conversational marketing software?

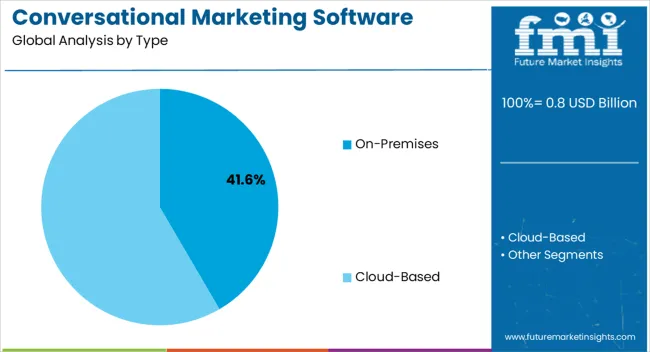
Revenue through cloud-based conversational software grew at a CAGR of 31.6% during 2018 to 2022. The anticipated growth rate in cloud-based conversational marketing software is estimated at 17.1% CAGR over the forecasted period. Cloud platforms are cost-effective as enterprises don’t require to set up and own computing infrastructure. It allows the software to co-exist remotely and therefore key companies involved in the conversational marketing software market have transitioned to cloud-based platforms.

How conversational marketing software has maintained a significant influence among large enterprises?

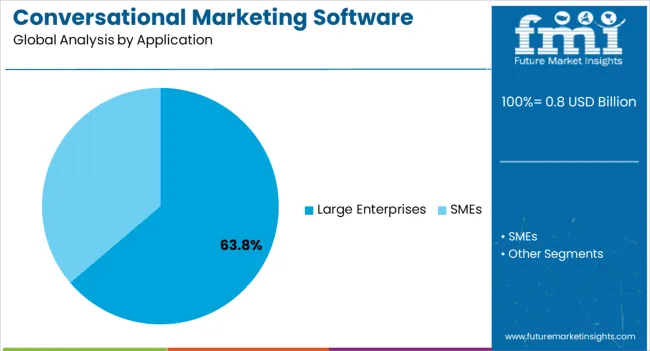
In terms of application, conversational marketing software witnessed immense growth in large enterprises. Revenue through large enterprises grew at 31.2% CAGR during 2018 to 2022. Various automated customer support channels are investing in large enterprises to expand their reach in the conversational marketing software market.

For instance, Verloop, a customer support automation platform collaborated with more than 5,000 brands globally including Decathlon, Adani Capital, and DSP mutual funds. With rapidly changing consumer behavior, large brands are focussed on enriching their customer support experience by adopting conversational marketing tools. The anticipated growth rate of the conversational marketing software revenue through large enterprises during the forecast period is estimated at 16.6% CAGR.
Competitive Landscape

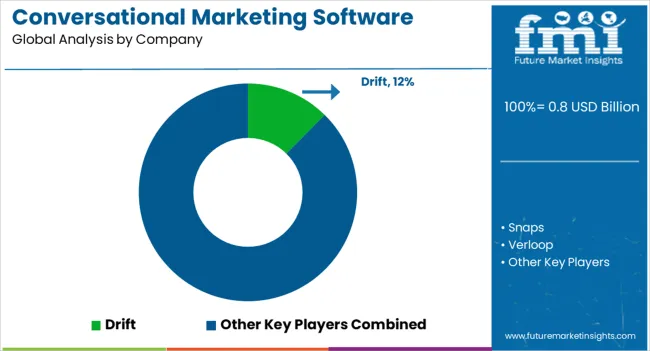
on collaborating with social media networks to deploy advanced customer support experience. The key companies operating in the conversational marketing software market include Drift, Snaps, Verloop, iAdvize, LiveWorld, Automat, Intercom, HubSpot, Conversica, Saleswhale, Whisbi, Slaask, Audiense, Spectrm, and Zoovu.

Some of the recent developments by key providers of conversational marketing software market are as follows:

  • January 2023: Drift confirmed the purchase of Drift Engage, a conversational marketing platform for sales and marketing teams.
  • February 2023: HubSpot introduced a new edition of its Conversational Marketing platform, with new capabilities for lead scoring, automation, and reporting.
  • March 2023: Dialogflow revealed the launch of its new Dialogflow Essentials plan, an additional inexpensive solution for small enterprises.

Similarly, recent developments related to companies involved in conversational marketing software have been tracked by the team at Future Market Insights, which is available in the full report.

Key Segments Covered in Conversational Marketing Software Industry Survey

Conversational Marketing Software Market by Type:

  • On-Premises
  • Cloud-Based

Conversational Marketing Software Market by Application:

  • Large Enterprises
  • SMEs

Conversational Marketing Software Market by Region:

  • North America
  • Latin America
  • Europe
  • South Asia
  • East Asia
  • Oceania
  • Middle East & Africa

Frequently Asked Questions

How Big is the Conversational Marketing Software Market?

The industry is valued at US$ 553.1 million in 2023.

Who are the Key Conversational Marketing Software Market Players?

Drift, Snaps, and Verloop are key industry players.

Which Industry is the Key Consumer of the Conversational Marketing Software?

Marketing software is the key consumer.

How Big Will the Conversational Marketing Software Market by 2033?

The industry is estimated to reach US$ 2.83 billion by 2033.

What is the Conversational Marketing Software Market CAGR for 2033?

The conversational marketing software market CAGR for 2033 is 17.7%.

Table of Content

1. Executive Summary

    1.1. Global Market Outlook

    1.2. Demand-side Trends

    1.3. Supply-side Trends

    1.4. Technology Roadmap Analysis

    1.5. Analysis and Recommendations

2. Market Overview

    2.1. Market Coverage / Taxonomy

    2.2. Market Definition / Scope / Limitations

3. Market Background

    3.1. Market Dynamics

        3.1.1. Drivers

        3.1.2. Restraints

        3.1.3. Opportunity

        3.1.4. Trends

    3.2. Scenario Forecast

        3.2.1. Demand in Optimistic Scenario

        3.2.2. Demand in Likely Scenario

        3.2.3. Demand in Conservative Scenario

    3.3. Opportunity Map Analysis

    3.4. Investment Feasibility Matrix

    3.5. PESTLE and Porter’s Analysis

    3.6. Regulatory Landscape

        3.6.1. By Key Regions

        3.6.2. By Key Countries

    3.7. Regional Parent Market Outlook

4. Global Market Analysis 2018 to 2022 and Forecast, 2023 to 2033

    4.1. Historical Market Size Value (US$ Million) Analysis, 2018 to 2022

    4.2. Current and Future Market Size Value (US$ Million) Projections, 2023 to 2033

        4.2.1. Y-o-Y Growth Trend Analysis

        4.2.2. Absolute $ Opportunity Analysis

5. Global Market Analysis 2018 to 2022 and Forecast 2023 to 2033, By Type

    5.1. Introduction / Key Findings

    5.2. Historical Market Size Value (US$ Million) Analysis By Type, 2018 to 2022

    5.3. Current and Future Market Size Value (US$ Million) Analysis and Forecast By Type, 2023 to 2033

        5.3.1. On-Premises

        5.3.2. Cloud-Based

    5.4. Y-o-Y Growth Trend Analysis By Type, 2018 to 2022

    5.5. Absolute $ Opportunity Analysis By Type, 2023 to 2033

6. Global Market Analysis 2018 to 2022 and Forecast 2023 to 2033, By Application

    6.1. Introduction / Key Findings

    6.2. Historical Market Size Value (US$ Million) Analysis By Application, 2018 to 2022

    6.3. Current and Future Market Size Value (US$ Million) Analysis and Forecast By Application, 2023 to 2033

        6.3.1. Large Enterprises

        6.3.2. SMEs

    6.4. Y-o-Y Growth Trend Analysis By Application, 2018 to 2022

    6.5. Absolute $ Opportunity Analysis By Application, 2023 to 2033

7. Global Market Analysis 2018 to 2022 and Forecast 2023 to 2033, By Region

    7.1. Introduction

    7.2. Historical Market Size Value (US$ Million) Analysis By Region, 2018 to 2022

    7.3. Current Market Size Value (US$ Million) Analysis and Forecast By Region, 2023 to 2033

        7.3.1. North America

        7.3.2. Latin America

        7.3.3. Western Europe

        7.3.4. Eastern Europe

        7.3.5. South Asia and Pacific

        7.3.6. East Asia

        7.3.7. Middle East and Africa

    7.4. Market Attractiveness Analysis By Region

8. North America Market Analysis 2018 to 2022 and Forecast 2023 to 2033, By Country

    8.1. Historical Market Size Value (US$ Million) Trend Analysis By Market Taxonomy, 2018 to 2022

    8.2. Market Size Value (US$ Million) Forecast By Market Taxonomy, 2023 to 2033

        8.2.1. By Country

            8.2.1.1. The USA

            8.2.1.2. Canada

        8.2.2. By Type

        8.2.3. By Application

    8.3. Market Attractiveness Analysis

        8.3.1. By Country

        8.3.2. By Type

        8.3.3. By Application

    8.4. Key Takeaways

9. Latin America Market Analysis 2018 to 2022 and Forecast 2023 to 2033, By Country

    9.1. Historical Market Size Value (US$ Million) Trend Analysis By Market Taxonomy, 2018 to 2022

    9.2. Market Size Value (US$ Million) Forecast By Market Taxonomy, 2023 to 2033

        9.2.1. By Country

            9.2.1.1. Brazil

            9.2.1.2. Mexico

            9.2.1.3. Rest of Latin America

        9.2.2. By Type

        9.2.3. By Application

    9.3. Market Attractiveness Analysis

        9.3.1. By Country

        9.3.2. By Type

        9.3.3. By Application

    9.4. Key Takeaways

10. Western Europe Market Analysis 2018 to 2022 and Forecast 2023 to 2033, By Country

    10.1. Historical Market Size Value (US$ Million) Trend Analysis By Market Taxonomy, 2018 to 2022

    10.2. Market Size Value (US$ Million) Forecast By Market Taxonomy, 2023 to 2033

        10.2.1. By Country

            10.2.1.1. Germany

            10.2.1.2. United Kingdom

            10.2.1.3. France

            10.2.1.4. Spain

            10.2.1.5. Italy

            10.2.1.6. Rest of Western Europe

        10.2.2. By Type

        10.2.3. By Application

    10.3. Market Attractiveness Analysis

        10.3.1. By Country

        10.3.2. By Type

        10.3.3. By Application

    10.4. Key Takeaways

11. Eastern Europe Market Analysis 2018 to 2022 and Forecast 2023 to 2033, By Country

    11.1. Historical Market Size Value (US$ Million) Trend Analysis By Market Taxonomy, 2018 to 2022

    11.2. Market Size Value (US$ Million) Forecast By Market Taxonomy, 2023 to 2033

        11.2.1. By Country

            11.2.1.1. Poland

            11.2.1.2. Russia

            11.2.1.3. Czech Republic

            11.2.1.4. Romania

            11.2.1.5. Rest of Eastern Europe

        11.2.2. By Type

        11.2.3. By Application

    11.3. Market Attractiveness Analysis

        11.3.1. By Country

        11.3.2. By Type

        11.3.3. By Application

    11.4. Key Takeaways

12. South Asia and Pacific Market Analysis 2018 to 2022 and Forecast 2023 to 2033, By Country

    12.1. Historical Market Size Value (US$ Million) Trend Analysis By Market Taxonomy, 2018 to 2022

    12.2. Market Size Value (US$ Million) Forecast By Market Taxonomy, 2023 to 2033

        12.2.1. By Country

            12.2.1.1. India

            12.2.1.2. Bangladesh

            12.2.1.3. Australia

            12.2.1.4. New Zealand

            12.2.1.5. Rest of South Asia and Pacific

        12.2.2. By Type

        12.2.3. By Application

    12.3. Market Attractiveness Analysis

        12.3.1. By Country

        12.3.2. By Type

        12.3.3. By Application

    12.4. Key Takeaways

13. East Asia Market Analysis 2018 to 2022 and Forecast 2023 to 2033, By Country

    13.1. Historical Market Size Value (US$ Million) Trend Analysis By Market Taxonomy, 2018 to 2022

    13.2. Market Size Value (US$ Million) Forecast By Market Taxonomy, 2023 to 2033

        13.2.1. By Country

            13.2.1.1. China

            13.2.1.2. Japan

            13.2.1.3. South Korea

        13.2.2. By Type

        13.2.3. By Application

    13.3. Market Attractiveness Analysis

        13.3.1. By Country

        13.3.2. By Type

        13.3.3. By Application

    13.4. Key Takeaways

14. Middle East and Africa Market Analysis 2018 to 2022 and Forecast 2023 to 2033, By Country

    14.1. Historical Market Size Value (US$ Million) Trend Analysis By Market Taxonomy, 2018 to 2022

    14.2. Market Size Value (US$ Million) Forecast By Market Taxonomy, 2023 to 2033

        14.2.1. By Country

            14.2.1.1. GCC Countries

            14.2.1.2. South Africa

            14.2.1.3. Israel

            14.2.1.4. Rest of MEA

        14.2.2. By Type

        14.2.3. By Application

    14.3. Market Attractiveness Analysis

        14.3.1. By Country

        14.3.2. By Type

        14.3.3. By Application

    14.4. Key Takeaways

15. Key Countries Market Analysis

    15.1. USA

        15.1.1. Pricing Analysis

        15.1.2. Market Share Analysis, 2022

            15.1.2.1. By Type

            15.1.2.2. By Application

    15.2. Canada

        15.2.1. Pricing Analysis

        15.2.2. Market Share Analysis, 2022

            15.2.2.1. By Type

            15.2.2.2. By Application

    15.3. Brazil

        15.3.1. Pricing Analysis

        15.3.2. Market Share Analysis, 2022

            15.3.2.1. By Type

            15.3.2.2. By Application

    15.4. Mexico

        15.4.1. Pricing Analysis

        15.4.2. Market Share Analysis, 2022

            15.4.2.1. By Type

            15.4.2.2. By Application

    15.5. Germany

        15.5.1. Pricing Analysis

        15.5.2. Market Share Analysis, 2022

            15.5.2.1. By Type

            15.5.2.2. By Application

    15.6. United Kingdom

        15.6.1. Pricing Analysis

        15.6.2. Market Share Analysis, 2022

            15.6.2.1. By Type

            15.6.2.2. By Application

    15.7. France

        15.7.1. Pricing Analysis

        15.7.2. Market Share Analysis, 2022

            15.7.2.1. By Type

            15.7.2.2. By Application

    15.8. Spain

        15.8.1. Pricing Analysis

        15.8.2. Market Share Analysis, 2022

            15.8.2.1. By Type

            15.8.2.2. By Application

    15.9. Italy

        15.9.1. Pricing Analysis

        15.9.2. Market Share Analysis, 2022

            15.9.2.1. By Type

            15.9.2.2. By Application

    15.10. Poland

        15.10.1. Pricing Analysis

        15.10.2. Market Share Analysis, 2022

            15.10.2.1. By Type

            15.10.2.2. By Application

    15.11. Russia

        15.11.1. Pricing Analysis

        15.11.2. Market Share Analysis, 2022

            15.11.2.1. By Type

            15.11.2.2. By Application

    15.12. Czech Republic

        15.12.1. Pricing Analysis

        15.12.2. Market Share Analysis, 2022

            15.12.2.1. By Type

            15.12.2.2. By Application

    15.13. Romania

        15.13.1. Pricing Analysis

        15.13.2. Market Share Analysis, 2022

            15.13.2.1. By Type

            15.13.2.2. By Application

    15.14. India

        15.14.1. Pricing Analysis

        15.14.2. Market Share Analysis, 2022

            15.14.2.1. By Type

            15.14.2.2. By Application

    15.15. Bangladesh

        15.15.1. Pricing Analysis

        15.15.2. Market Share Analysis, 2022

            15.15.2.1. By Type

            15.15.2.2. By Application

    15.16. Australia

        15.16.1. Pricing Analysis

        15.16.2. Market Share Analysis, 2022

            15.16.2.1. By Type

            15.16.2.2. By Application

    15.17. New Zealand

        15.17.1. Pricing Analysis

        15.17.2. Market Share Analysis, 2022

            15.17.2.1. By Type

            15.17.2.2. By Application

    15.18. China

        15.18.1. Pricing Analysis

        15.18.2. Market Share Analysis, 2022

            15.18.2.1. By Type

            15.18.2.2. By Application

    15.19. Japan

        15.19.1. Pricing Analysis

        15.19.2. Market Share Analysis, 2022

            15.19.2.1. By Type

            15.19.2.2. By Application

    15.20. South Korea

        15.20.1. Pricing Analysis

        15.20.2. Market Share Analysis, 2022

            15.20.2.1. By Type

            15.20.2.2. By Application

    15.21. GCC Countries

        15.21.1. Pricing Analysis

        15.21.2. Market Share Analysis, 2022

            15.21.2.1. By Type

            15.21.2.2. By Application

    15.22. South Africa

        15.22.1. Pricing Analysis

        15.22.2. Market Share Analysis, 2022

            15.22.2.1. By Type

            15.22.2.2. By Application

    15.23. Israel

        15.23.1. Pricing Analysis

        15.23.2. Market Share Analysis, 2022

            15.23.2.1. By Type

            15.23.2.2. By Application

16. Market Structure Analysis

    16.1. Competition Dashboard

    16.2. Competition Benchmarking

    16.3. Market Share Analysis of Top Players

        16.3.1. By Regional

        16.3.2. By Type

        16.3.3. By Application

17. Competition Analysis

    17.1. Competition Deep Dive

        17.1.1. Drift

            17.1.1.1. Overview

            17.1.1.2. Product Portfolio

            17.1.1.3. Profitability by Market Segments

            17.1.1.4. Sales Footprint

            17.1.1.5. Strategy Overview

                17.1.1.5.1. Marketing Strategy

        17.1.2. Snaps

            17.1.2.1. Overview

            17.1.2.2. Product Portfolio

            17.1.2.3. Profitability by Market Segments

            17.1.2.4. Sales Footprint

            17.1.2.5. Strategy Overview

                17.1.2.5.1. Marketing Strategy

        17.1.3. Verloop

            17.1.3.1. Overview

            17.1.3.2. Product Portfolio

            17.1.3.3. Profitability by Market Segments

            17.1.3.4. Sales Footprint

            17.1.3.5. Strategy Overview

                17.1.3.5.1. Marketing Strategy

        17.1.4. iAdvize

            17.1.4.1. Overview

            17.1.4.2. Product Portfolio

            17.1.4.3. Profitability by Market Segments

            17.1.4.4. Sales Footprint

            17.1.4.5. Strategy Overview

                17.1.4.5.1. Marketing Strategy

        17.1.5. LiveWorld

            17.1.5.1. Overview

            17.1.5.2. Product Portfolio

            17.1.5.3. Profitability by Market Segments

            17.1.5.4. Sales Footprint

            17.1.5.5. Strategy Overview

                17.1.5.5.1. Marketing Strategy

        17.1.6. Automat

            17.1.6.1. Overview

            17.1.6.2. Product Portfolio

            17.1.6.3. Profitability by Market Segments

            17.1.6.4. Sales Footprint

            17.1.6.5. Strategy Overview

                17.1.6.5.1. Marketing Strategy

        17.1.7. Intercom

            17.1.7.1. Overview

            17.1.7.2. Product Portfolio

            17.1.7.3. Profitability by Market Segments

            17.1.7.4. Sales Footprint

            17.1.7.5. Strategy Overview

                17.1.7.5.1. Marketing Strategy

        17.1.8. HubSpot

            17.1.8.1. Overview

            17.1.8.2. Product Portfolio

            17.1.8.3. Profitability by Market Segments

            17.1.8.4. Sales Footprint

            17.1.8.5. Strategy Overview

                17.1.8.5.1. Marketing Strategy

        17.1.9. Conversica

            17.1.9.1. Overview

            17.1.9.2. Product Portfolio

            17.1.9.3. Profitability by Market Segments

            17.1.9.4. Sales Footprint

            17.1.9.5. Strategy Overview

                17.1.9.5.1. Marketing Strategy

        17.1.10. Saleswhale

            17.1.10.1. Overview

            17.1.10.2. Product Portfolio

            17.1.10.3. Profitability by Market Segments

            17.1.10.4. Sales Footprint

            17.1.10.5. Strategy Overview

                17.1.10.5.1. Marketing Strategy

        17.1.11. Whisbi

            17.1.11.1. Overview

            17.1.11.2. Product Portfolio

            17.1.11.3. Profitability by Market Segments

            17.1.11.4. Sales Footprint

            17.1.11.5. Strategy Overview

                17.1.11.5.1. Marketing Strategy

        17.1.12. Slaask

            17.1.12.1. Overview

            17.1.12.2. Product Portfolio

            17.1.12.3. Profitability by Market Segments

            17.1.12.4. Sales Footprint

            17.1.12.5. Strategy Overview

                17.1.12.5.1. Marketing Strategy

        17.1.13. Audiense

            17.1.13.1. Overview

            17.1.13.2. Product Portfolio

            17.1.13.3. Profitability by Market Segments

            17.1.13.4. Sales Footprint

            17.1.13.5. Strategy Overview

                17.1.13.5.1. Marketing Strategy

        17.1.14. Spectrm

            17.1.14.1. Overview

            17.1.14.2. Product Portfolio

            17.1.14.3. Profitability by Market Segments

            17.1.14.4. Sales Footprint

            17.1.14.5. Strategy Overview

                17.1.14.5.1. Marketing Strategy

        17.1.15. Zoovu

            17.1.15.1. Overview

            17.1.15.2. Product Portfolio

            17.1.15.3. Profitability by Market Segments

            17.1.15.4. Sales Footprint

            17.1.15.5. Strategy Overview

                17.1.15.5.1. Marketing Strategy

18. Assumptions & Acronyms Used

19. Research Methodology

Don't pay for what you don't need

Customize your report by selecting specific countries or regions and save 30%!

List of Tables

Table 1: Global Market Value (US$ Million) Forecast by Region, 2018 to 2033

Table 2: Global Market Value (US$ Million) Forecast by Type, 2018 to 2033

Table 3: Global Market Value (US$ Million) Forecast by Application, 2018 to 2033

Table 4: North America Market Value (US$ Million) Forecast by Country, 2018 to 2033

Table 5: North America Market Value (US$ Million) Forecast by Type, 2018 to 2033

Table 6: North America Market Value (US$ Million) Forecast by Application, 2018 to 2033

Table 7: Latin America Market Value (US$ Million) Forecast by Country, 2018 to 2033

Table 8: Latin America Market Value (US$ Million) Forecast by Type, 2018 to 2033

Table 9: Latin America Market Value (US$ Million) Forecast by Application, 2018 to 2033

Table 10: Western Europe Market Value (US$ Million) Forecast by Country, 2018 to 2033

Table 11: Western Europe Market Value (US$ Million) Forecast by Type, 2018 to 2033

Table 12: Western Europe Market Value (US$ Million) Forecast by Application, 2018 to 2033

Table 13: Eastern Europe Market Value (US$ Million) Forecast by Country, 2018 to 2033

Table 14: Eastern Europe Market Value (US$ Million) Forecast by Type, 2018 to 2033

Table 15: Eastern Europe Market Value (US$ Million) Forecast by Application, 2018 to 2033

Table 16: South Asia and Pacific Market Value (US$ Million) Forecast by Country, 2018 to 2033

Table 17: South Asia and Pacific Market Value (US$ Million) Forecast by Type, 2018 to 2033

Table 18: South Asia and Pacific Market Value (US$ Million) Forecast by Application, 2018 to 2033

Table 19: East Asia Market Value (US$ Million) Forecast by Country, 2018 to 2033

Table 20: East Asia Market Value (US$ Million) Forecast by Type, 2018 to 2033

Table 21: East Asia Market Value (US$ Million) Forecast by Application, 2018 to 2033

Table 22: Middle East and Africa Market Value (US$ Million) Forecast by Country, 2018 to 2033

Table 23: Middle East and Africa Market Value (US$ Million) Forecast by Type, 2018 to 2033

Table 24: Middle East and Africa Market Value (US$ Million) Forecast by Application, 2018 to 2033
Sudip Saha
Sudip Saha

Principal Consultant

Talk to Analyst

Find your sweet spots for generating winning opportunities in this market.

List of Charts

Figure 1: Global Market Value (US$ Million) by Type, 2023 to 2033

Figure 2: Global Market Value (US$ Million) by Application, 2023 to 2033

Figure 3: Global Market Value (US$ Million) by Region, 2023 to 2033

Figure 4: Global Market Value (US$ Million) Analysis by Region, 2018 to 2033

Figure 5: Global Market Value Share (%) and BPS Analysis by Region, 2023 to 2033

Figure 6: Global Market Y-o-Y Growth (%) Projections by Region, 2023 to 2033

Figure 7: Global Market Value (US$ Million) Analysis by Type, 2018 to 2033

Figure 8: Global Market Value Share (%) and BPS Analysis by Type, 2023 to 2033

Figure 9: Global Market Y-o-Y Growth (%) Projections by Type, 2023 to 2033

Figure 10: Global Market Value (US$ Million) Analysis by Application, 2018 to 2033

Figure 11: Global Market Value Share (%) and BPS Analysis by Application, 2023 to 2033

Figure 12: Global Market Y-o-Y Growth (%) Projections by Application, 2023 to 2033

Figure 13: Global Market Attractiveness by Type, 2023 to 2033

Figure 14: Global Market Attractiveness by Application, 2023 to 2033

Figure 15: Global Market Attractiveness by Region, 2023 to 2033

Figure 16: North America Market Value (US$ Million) by Type, 2023 to 2033

Figure 17: North America Market Value (US$ Million) by Application, 2023 to 2033

Figure 18: North America Market Value (US$ Million) by Country, 2023 to 2033

Figure 19: North America Market Value (US$ Million) Analysis by Country, 2018 to 2033

Figure 20: North America Market Value Share (%) and BPS Analysis by Country, 2023 to 2033

Figure 21: North America Market Y-o-Y Growth (%) Projections by Country, 2023 to 2033

Figure 22: North America Market Value (US$ Million) Analysis by Type, 2018 to 2033

Figure 23: North America Market Value Share (%) and BPS Analysis by Type, 2023 to 2033

Figure 24: North America Market Y-o-Y Growth (%) Projections by Type, 2023 to 2033

Figure 25: North America Market Value (US$ Million) Analysis by Application, 2018 to 2033

Figure 26: North America Market Value Share (%) and BPS Analysis by Application, 2023 to 2033

Figure 27: North America Market Y-o-Y Growth (%) Projections by Application, 2023 to 2033

Figure 28: North America Market Attractiveness by Type, 2023 to 2033

Figure 29: North America Market Attractiveness by Application, 2023 to 2033

Figure 30: North America Market Attractiveness by Country, 2023 to 2033

Figure 31: Latin America Market Value (US$ Million) by Type, 2023 to 2033

Figure 32: Latin America Market Value (US$ Million) by Application, 2023 to 2033

Figure 33: Latin America Market Value (US$ Million) by Country, 2023 to 2033

Figure 34: Latin America Market Value (US$ Million) Analysis by Country, 2018 to 2033

Figure 35: Latin America Market Value Share (%) and BPS Analysis by Country, 2023 to 2033

Figure 36: Latin America Market Y-o-Y Growth (%) Projections by Country, 2023 to 2033

Figure 37: Latin America Market Value (US$ Million) Analysis by Type, 2018 to 2033

Figure 38: Latin America Market Value Share (%) and BPS Analysis by Type, 2023 to 2033

Figure 39: Latin America Market Y-o-Y Growth (%) Projections by Type, 2023 to 2033

Figure 40: Latin America Market Value (US$ Million) Analysis by Application, 2018 to 2033

Figure 41: Latin America Market Value Share (%) and BPS Analysis by Application, 2023 to 2033

Figure 42: Latin America Market Y-o-Y Growth (%) Projections by Application, 2023 to 2033

Figure 43: Latin America Market Attractiveness by Type, 2023 to 2033

Figure 44: Latin America Market Attractiveness by Application, 2023 to 2033

Figure 45: Latin America Market Attractiveness by Country, 2023 to 2033

Figure 46: Western Europe Market Value (US$ Million) by Type, 2023 to 2033

Figure 47: Western Europe Market Value (US$ Million) by Application, 2023 to 2033

Figure 48: Western Europe Market Value (US$ Million) by Country, 2023 to 2033

Figure 49: Western Europe Market Value (US$ Million) Analysis by Country, 2018 to 2033

Figure 50: Western Europe Market Value Share (%) and BPS Analysis by Country, 2023 to 2033

Figure 51: Western Europe Market Y-o-Y Growth (%) Projections by Country, 2023 to 2033

Figure 52: Western Europe Market Value (US$ Million) Analysis by Type, 2018 to 2033

Figure 53: Western Europe Market Value Share (%) and BPS Analysis by Type, 2023 to 2033

Figure 54: Western Europe Market Y-o-Y Growth (%) Projections by Type, 2023 to 2033

Figure 55: Western Europe Market Value (US$ Million) Analysis by Application, 2018 to 2033

Figure 56: Western Europe Market Value Share (%) and BPS Analysis by Application, 2023 to 2033

Figure 57: Western Europe Market Y-o-Y Growth (%) Projections by Application, 2023 to 2033

Figure 58: Western Europe Market Attractiveness by Type, 2023 to 2033

Figure 59: Western Europe Market Attractiveness by Application, 2023 to 2033

Figure 60: Western Europe Market Attractiveness by Country, 2023 to 2033

Figure 61: Eastern Europe Market Value (US$ Million) by Type, 2023 to 2033

Figure 62: Eastern Europe Market Value (US$ Million) by Application, 2023 to 2033

Figure 63: Eastern Europe Market Value (US$ Million) by Country, 2023 to 2033

Figure 64: Eastern Europe Market Value (US$ Million) Analysis by Country, 2018 to 2033

Figure 65: Eastern Europe Market Value Share (%) and BPS Analysis by Country, 2023 to 2033

Figure 66: Eastern Europe Market Y-o-Y Growth (%) Projections by Country, 2023 to 2033

Figure 67: Eastern Europe Market Value (US$ Million) Analysis by Type, 2018 to 2033

Figure 68: Eastern Europe Market Value Share (%) and BPS Analysis by Type, 2023 to 2033

Figure 69: Eastern Europe Market Y-o-Y Growth (%) Projections by Type, 2023 to 2033

Figure 70: Eastern Europe Market Value (US$ Million) Analysis by Application, 2018 to 2033

Figure 71: Eastern Europe Market Value Share (%) and BPS Analysis by Application, 2023 to 2033

Figure 72: Eastern Europe Market Y-o-Y Growth (%) Projections by Application, 2023 to 2033

Figure 73: Eastern Europe Market Attractiveness by Type, 2023 to 2033

Figure 74: Eastern Europe Market Attractiveness by Application, 2023 to 2033

Figure 75: Eastern Europe Market Attractiveness by Country, 2023 to 2033

Figure 76: South Asia and Pacific Market Value (US$ Million) by Type, 2023 to 2033

Figure 77: South Asia and Pacific Market Value (US$ Million) by Application, 2023 to 2033

Figure 78: South Asia and Pacific Market Value (US$ Million) by Country, 2023 to 2033

Figure 79: South Asia and Pacific Market Value (US$ Million) Analysis by Country, 2018 to 2033

Figure 80: South Asia and Pacific Market Value Share (%) and BPS Analysis by Country, 2023 to 2033

Figure 81: South Asia and Pacific Market Y-o-Y Growth (%) Projections by Country, 2023 to 2033

Figure 82: South Asia and Pacific Market Value (US$ Million) Analysis by Type, 2018 to 2033

Figure 83: South Asia and Pacific Market Value Share (%) and BPS Analysis by Type, 2023 to 2033

Figure 84: South Asia and Pacific Market Y-o-Y Growth (%) Projections by Type, 2023 to 2033

Figure 85: South Asia and Pacific Market Value (US$ Million) Analysis by Application, 2018 to 2033

Figure 86: South Asia and Pacific Market Value Share (%) and BPS Analysis by Application, 2023 to 2033

Figure 87: South Asia and Pacific Market Y-o-Y Growth (%) Projections by Application, 2023 to 2033

Figure 88: South Asia and Pacific Market Attractiveness by Type, 2023 to 2033

Figure 89: South Asia and Pacific Market Attractiveness by Application, 2023 to 2033

Figure 90: South Asia and Pacific Market Attractiveness by Country, 2023 to 2033

Figure 91: East Asia Market Value (US$ Million) by Type, 2023 to 2033

Figure 92: East Asia Market Value (US$ Million) by Application, 2023 to 2033

Figure 93: East Asia Market Value (US$ Million) by Country, 2023 to 2033

Figure 94: East Asia Market Value (US$ Million) Analysis by Country, 2018 to 2033

Figure 95: East Asia Market Value Share (%) and BPS Analysis by Country, 2023 to 2033

Figure 96: East Asia Market Y-o-Y Growth (%) Projections by Country, 2023 to 2033

Figure 97: East Asia Market Value (US$ Million) Analysis by Type, 2018 to 2033

Figure 98: East Asia Market Value Share (%) and BPS Analysis by Type, 2023 to 2033

Figure 99: East Asia Market Y-o-Y Growth (%) Projections by Type, 2023 to 2033

Figure 100: East Asia Market Value (US$ Million) Analysis by Application, 2018 to 2033

Figure 101: East Asia Market Value Share (%) and BPS Analysis by Application, 2023 to 2033

Figure 102: East Asia Market Y-o-Y Growth (%) Projections by Application, 2023 to 2033

Figure 103: East Asia Market Attractiveness by Type, 2023 to 2033

Figure 104: East Asia Market Attractiveness by Application, 2023 to 2033

Figure 105: East Asia Market Attractiveness by Country, 2023 to 2033

Figure 106: Middle East and Africa Market Value (US$ Million) by Type, 2023 to 2033

Figure 107: Middle East and Africa Market Value (US$ Million) by Application, 2023 to 2033

Figure 108: Middle East and Africa Market Value (US$ Million) by Country, 2023 to 2033

Figure 109: Middle East and Africa Market Value (US$ Million) Analysis by Country, 2018 to 2033

Figure 110: Middle East and Africa Market Value Share (%) and BPS Analysis by Country, 2023 to 2033

Figure 111: Middle East and Africa Market Y-o-Y Growth (%) Projections by Country, 2023 to 2033

Figure 112: Middle East and Africa Market Value (US$ Million) Analysis by Type, 2018 to 2033

Figure 113: Middle East and Africa Market Value Share (%) and BPS Analysis by Type, 2023 to 2033

Figure 114: Middle East and Africa Market Y-o-Y Growth (%) Projections by Type, 2023 to 2033

Figure 115: Middle East and Africa Market Value (US$ Million) Analysis by Application, 2018 to 2033

Figure 116: Middle East and Africa Market Value Share (%) and BPS Analysis by Application, 2023 to 2033

Figure 117: Middle East and Africa Market Y-o-Y Growth (%) Projections by Application, 2023 to 2033

Figure 118: Middle East and Africa Market Attractiveness by Type, 2023 to 2033

Figure 119: Middle East and Africa Market Attractiveness by Application, 2023 to 2033

Figure 120: Middle East and Africa Market Attractiveness by Country, 2023 to 2033

Recommendations

Technology

Conversational Commerce Market

Published : March 2024

Technology

Conversational AI Market

Published : May 2023

Explore Technology Insights

View Reports

Conversational Marketing Software Market