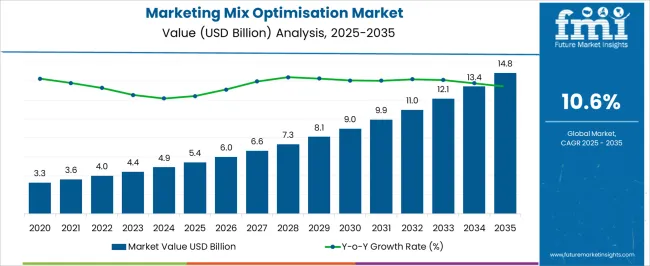
The Marketing Mix Optimisation Market is estimated to be valued at USD 5.4 billion in 2025 and is projected to reach USD 14.8 billion by 2035, registering a compound annual growth rate (CAGR) of 10.6% over the forecast period.
| Metric | Value |
|---|---|
| Marketing Mix Optimisation Market Estimated Value in (2025 E) | USD 5.4 billion |
| Marketing Mix Optimisation Market Forecast Value in (2035 F) | USD 14.8 billion |
| Forecast CAGR (2025 to 2035) | 10.6% |
The marketing mix optimisation market is witnessing accelerated growth as enterprises increasingly rely on data-driven decision-making to enhance return on marketing investments. The demand is being driven by the growing complexity of omnichannel consumer journeys, where businesses require advanced tools to allocate budgets effectively across digital, traditional, and emerging platforms.
Cloud-based deployment and AI-powered analytics are enabling faster processing of large data volumes, offering real-time insights that allow marketers to adjust campaigns dynamically. This shift is being reinforced by rising competition in consumer-facing industries, where efficiency in targeting and personalization is becoming a strategic necessity.
Investments in predictive analytics, machine learning, and automated reporting are further enhancing the capabilities of marketing mix platforms, positioning them as critical enablers for improving efficiency and accountability As enterprises aim to optimize campaign effectiveness while reducing waste, the market is set to experience robust adoption across industries, with future growth strongly supported by digital transformation initiatives and the integration of advanced analytics into marketing operations.
The marketing mix optimisation market is segmented by deployment, application, and geographic regions. By deployment, marketing mix optimisation market is divided into Cloud and On-premises. In terms of application, marketing mix optimisation market is classified into Retail & consumer goods, Media & entertainment, BFSI, Healthcare, IT & telecom, and Others. Regionally, the industrying mix optimisation industry is classified into North America, Latin America, Western Europe, Eastern Europe, Balkan & Baltic Countries, Russia & Belarus, Central Asia, East Asia, South Asia & Pacific, and the Middle East & Africa.
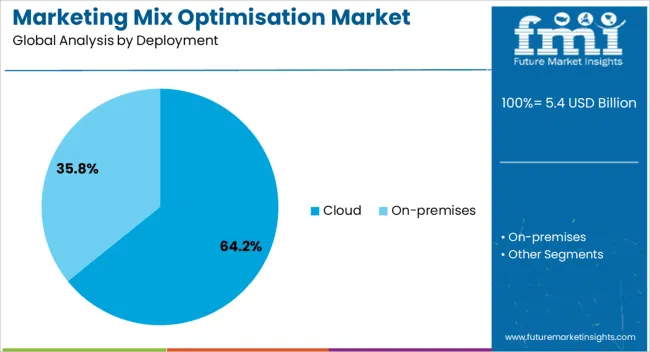
The cloud deployment segment is projected to hold 64.2% of the marketing mix optimisation market revenue share in 2025, making it the leading deployment type. This dominance is being supported by the scalability, flexibility, and cost efficiency offered by cloud platforms, which are essential for businesses dealing with vast and rapidly changing datasets. Cloud-based solutions enable organizations to centralize data from multiple channels and geographic locations, improving collaboration and decision-making across distributed teams.
The ability to provide real-time analytics, faster deployment cycles, and seamless integration with third-party applications is further reinforcing adoption. Security advancements and compliance with global data protection standards are increasing confidence in cloud adoption, particularly among large enterprises and multinational corporations.
The subscription-based pricing models associated with cloud services are also making advanced marketing mix tools accessible to mid-sized firms, broadening the customer base As businesses continue to prioritize agility and scalability, the cloud deployment model is expected to remain the preferred choice, driving significant revenue contribution to the overall market.
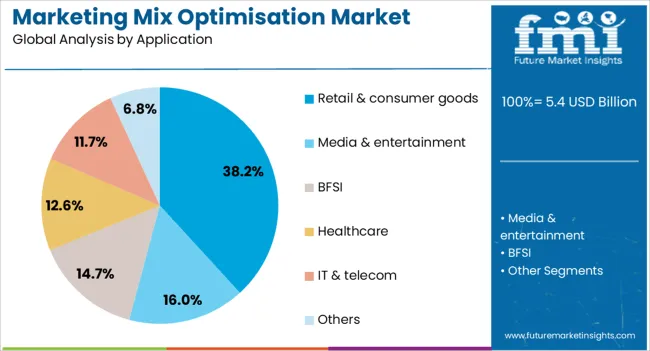
The retail and consumer goods segment is anticipated to account for 38.2% of the marketing mix optimisation market revenue share in 2025, establishing itself as the leading application segment. This leadership is being reinforced by the sector’s reliance on precise consumer insights to manage competitive pressures and changing buyer behaviors.
Companies in retail and consumer goods are increasingly leveraging marketing mix optimisation to measure the effectiveness of promotional campaigns, optimize pricing strategies, and allocate budgets across digital and traditional media. The ability to track real-time sales data and consumer interactions enables retailers to adjust campaigns dynamically, improving conversion rates and customer loyalty.
Rising adoption of e-commerce and omnichannel retail strategies is further driving demand for tools that can provide a holistic view of marketing performance across touchpoints With consumer preferences shifting rapidly and competition intensifying, retail and consumer goods companies are expected to remain the highest adopters of marketing mix optimisation, ensuring sustained revenue leadership in this segment.
Marketing mix optimisation or marketing mix modeling is a method that is used for the statistical analysis of the various advertising and marketing efforts done on a products performance in the market. The key elements of marketing mix modeling are product, promotion, distribution and the pricing, each of these elements are analyzed closely before finalizing the suitable model for marketing a particular product.
The marketing mix modeling allows quantifying the sales and revenue generated by the marketing done on a particular product. It also allows planning the strategies for marketing of particular product or marketing service in an optimized manner.
The shift of global markets to the emerging regions such as, China, India, Brazil and Russia and the established markets being on the threshold of saturation, manufacturers are looking forward to establish markets in the emerging regions with low investments and high return on investment.
With various big organizations adapting the marketing mix modeling for optimized marketing of their products, the global market for marketing mix modeling will register a healthy growth rate by the end of forecast period.
The global marketing mix modeling market is primarily driven by the demand for efficient marketing strategies by organizations including the fortune 500 companies, which will help minimizing the lump sum investments in marketing of a particular product and give high return of investment to the companies in terms of marketing costs by increasing the sales for that particular product.
The implementation of marketing mix modeling helps in achieving the targeted goals of the company and benefits the organization as a whole. Somehow, there are some challenges related to the marketing mix modeling which might restrain the growth of the market.
Some of the challenges includes, unstandardized measurement of the market, lack of transparency in the modeling methods among others, which makes difficult to narrow down actual predictions.
The global marketing mix modeling market is segmented based on approach for marketing mix modeling and region. Based on the approach used for marketing mix modeling, the marketing mix modeling market can be segmented into OLS (Ordinary Least Square) regression approach and Constraint regression approach.
Based on the geographic regions, global automotive seating systems marketing market is segmented into seven key market segments namely North America, Latin America, Western Europe, Eastern Europe, Asia Pacific, Japan, and Middle East & Africa. The marketing mix modeling being a new concept it is being adapted globally in the established as well as the emerging markets.
The global trend of big manufacturers and markets shifting the business to Latin America, Asia-Pacific and Eastern Europe markets to tap the growth opportunities in these markets are fostering the growth of marketing mix modeling market in the aforementioned regions as well as in the established markets of North American and Western Europe.
Some of the major players identified in the global marketing mix modeling market includes, Wipro Limited, Polaris Research, Decision Analyst, Inc., The Nielsen Company, Analytic Partners, Inc., Ninah and ThinkVine.com among others.
The research report presents a comprehensive assessment of the market and contains thoughtful insights, facts, historical data, and statistically supported and industry-validated market data. It also contains projections using a suitable set of assumptions and methodologies. The research report provides analysis and information according to categories such as market segments, geographies, types, technology and applications.
The report is a compilation of first-hand information, qualitative and quantitative assessment by industry analysts, inputs from industry experts and industry participants across the value chain. The report provides in-depth analysis of parent market trends, macro-economic indicators and governing factors along with market attractiveness as per segments. The report also maps the qualitative impact of various market factors on market segments and geographies.
| Country | CAGR |
|---|---|
| China | 14.3% |
| India | 13.3% |
| Germany | 12.2% |
| France | 11.1% |
| UK | 10.1% |
| USA | 9.0% |
| Brazil | 8.0% |
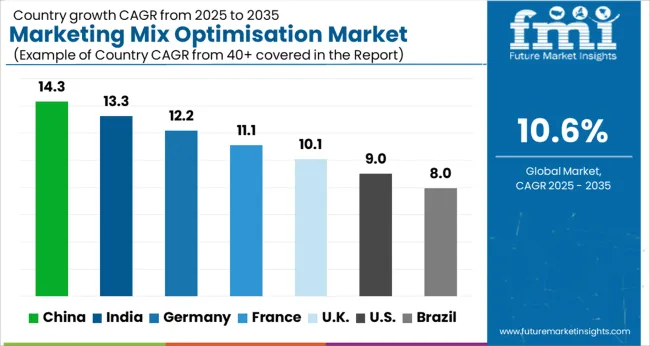
The Marketing Mix Optimisation Market is expected to register a CAGR of 10.6% during the forecast period, exhibiting varied country level momentum. China leads with the highest CAGR of 14.3%, followed by India at 13.3%. Developed markets such as Germany, France, and the UK continue to expand steadily, while the USA is likely to grow at consistent rates. Brazil posts the lowest CAGR at 8.0%, yet still underscores a broadly positive trajectory for the global Marketing Mix Optimisation Market. In 2024, Germany held a dominant revenue in the Western Europe market and is expected to grow with a CAGR of 12.2%. The USA Marketing Mix Optimisation Market is estimated to be valued at USD 2.0 billion in 2025 and is anticipated to reach a valuation of USD 4.7 billion by 2035. Sales are projected to rise at a CAGR of 9.0% over the forecast period between 2025 and 2035. While Japan and South Korea markets are estimated to be valued at USD 253.8 million and USD 166.9 million respectively in 2025.
| Item | Value |
|---|---|
| Quantitative Units | USD 5.4 Billion |
| Deployment | Cloud and On-premises |
| Application | Retail & consumer goods, Media & entertainment, BFSI, Healthcare, IT & telecom, and Others |
| Regions Covered | North America, Europe, Asia-Pacific, Latin America, Middle East & Africa |
| Country Covered | United States, Canada, Germany, France, United Kingdom, China, Japan, India, Brazil, South Africa |
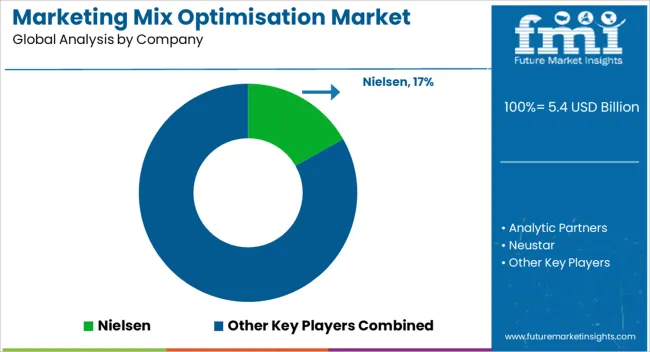
| Key Companies Profiled | Nielsen, Analytic Partners, Neustar, Gain Theory, Marketing Evolution, Ipsos MMA, Merkle, Ekimetrics, IRI, and ThinkVine |
The global marketing mix optimisation market is estimated to be valued at USD 5.4 billion in 2025.
The market size for the marketing mix optimisation market is projected to reach USD 14.8 billion by 2035.
The marketing mix optimisation market is expected to grow at a 10.6% CAGR between 2025 and 2035.
The key product types in marketing mix optimisation market are cloud and on-premises.
In terms of application, retail & consumer goods segment to command 38.2% share in the marketing mix optimisation market in 2025.
Explore Similar Insights

Thank you!
You will receive an email from our Business Development Manager. Please be sure to check your SPAM/JUNK folder too.
Chat With
MaRIA