The Referral Marketing Software Market is estimated to be valued at USD 506.1 million in 2025 and is projected to reach USD 1764.3 million by 2035, registering a compound annual growth rate (CAGR) of 13.3% over the forecast period.
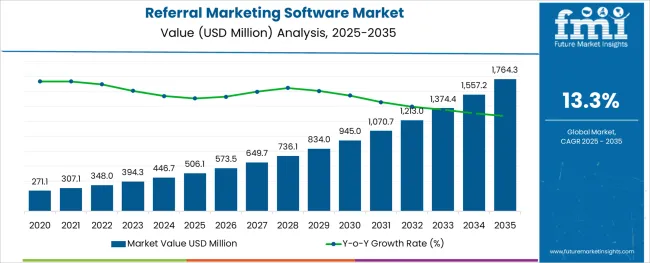
The referral marketing software market is witnessing significant acceleration as businesses increasingly leverage peer-driven strategies to acquire and retain customers in a competitive digital landscape. The shift toward zero-party data, combined with growing skepticism around traditional advertising, has strengthened the appeal of customer advocacy tools. Referral platforms are being integrated with CRM, loyalty, and e-commerce ecosystems, enabling seamless campaign execution and tracking.
Real-time analytics, fraud prevention algorithms, and automated reward distribution have enhanced ROI visibility, making referral marketing software a preferred choice among data-driven marketers. Cloud-native architecture is facilitating rapid deployment and scalability across global marketing operations.
Enterprises are also prioritizing personalization and omnichannel delivery to tailor referral experiences, improving conversion rates and customer lifetime value. As organizations aim to reduce customer acquisition costs while building brand trust, the demand for intelligent, automated, and privacy-compliant referral platforms is set to rise sharply, particularly in sectors with high digital transaction volumes.
The market is segmented by Deployment, Enterprise Size, and Industry and region. By Deployment, the market is divided into Cloud-Based and Web-based. In terms of Enterprise Size, the market is classified into Large Enterprises and Small and Medium Enterprises. Based on Industry, the market is segmented into BFSI, Retail, E-commerce, Education, Hospitality, and Others. Regionally, the market is classified into North America, Latin America, Western Europe, Eastern Europe, Balkan & Baltic Countries, Russia & Belarus, Central Asia, East Asia, South Asia & Pacific, and the Middle East & Africa.
The market is segmented by Deployment, Enterprise Size, and Industry and region. By Deployment, the market is divided into Cloud-Based and Web-based. In terms of Enterprise Size, the market is classified into Large Enterprises and Small and Medium Enterprises. Based on Industry, the market is segmented into BFSI, Retail, E-commerce, Education, Hospitality, and Others. Regionally, the market is classified into North America, Latin America, Western Europe, Eastern Europe, Balkan & Baltic Countries, Russia & Belarus, Central Asia, East Asia, South Asia & Pacific, and the Middle East & Africa.
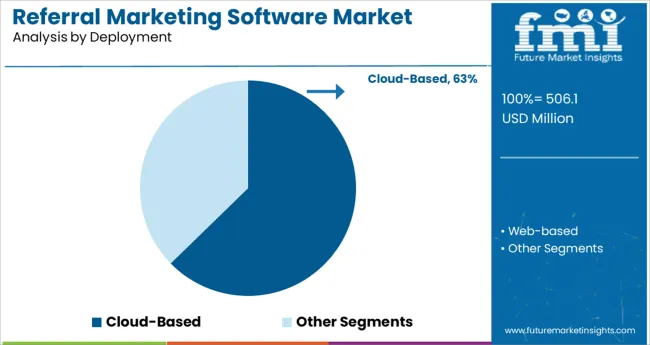
The cloud based deployment segment is projected to hold 62.7% of the total revenue share in 2025, establishing it as the dominant deployment model. This leadership is attributed to the platform’s scalability, remote accessibility, and ease of integration with marketing and sales automation systems.
Cloud based solutions have become essential for executing and managing multi-region referral campaigns that demand real-time updates and centralized analytics. Their ability to support agile testing, versioning, and API-first connectivity has driven widespread adoption, particularly among enterprises seeking faster go-to-market execution.
The reduced infrastructure burden and subscription-based pricing models have further supported penetration across both established and emerging markets. As marketing operations continue shifting toward digital-first frameworks, cloud deployment is expected to remain the preferred mode for referral software platforms.
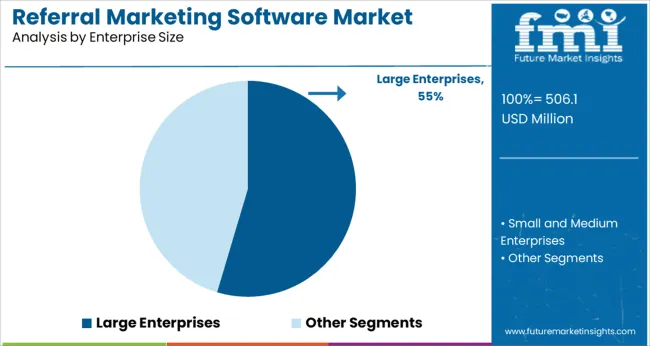
The large enterprises segment is expected to contribute 54.6% of market revenue in 2025, making it the leading enterprise size category in the referral marketing software market. This dominance stems from the ability of large enterprises to run sophisticated referral programs at scale, supported by dedicated marketing teams, large customer bases, and robust IT infrastructure.
Their strategic focus on customer advocacy, loyalty reinforcement, and acquisition cost reduction has led to deeper investment in referral platforms with AI-powered targeting, customizable incentives, and advanced attribution models. Furthermore, integration capabilities with enterprise CRM and customer engagement platforms have facilitated real-time decision making and performance optimization.
As competition intensifies and organic growth becomes more critical, large enterprises are expected to expand their usage of referral marketing software as a core part of their digital acquisition strategy.
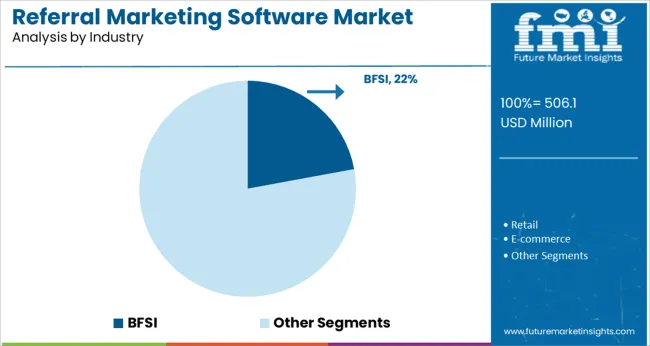
Within the industry segmentation, the BFSI sector is projected to account for 22.1% of total revenue in 2025, marking it as the leading vertical in the referral marketing software market. This prominence is driven by the sector’s heavy emphasis on trust, credibility, and personalized relationship-building, which aligns well with referral-driven customer acquisition.
Financial service providers have leveraged referral platforms to promote savings accounts, loans, insurance products, and investment services by incentivizing existing customers to refer new ones. The integration of referral workflows with mobile apps, digital wallets, and online banking platforms has improved engagement and conversion.
Strict compliance requirements in the BFSI sector have also led to the adoption of referral tools that provide detailed audit trails, consent management, and fraud prevention. The need to improve customer retention, enhance digital onboarding, and reduce paid media dependency has cemented referral marketing as a key strategic tool for financial institutions.
According to research, people who are referred to a product by a friend are 4 times as likely to buy a product, with word of mouth influencing a 54% increase in marketing efficiency. Referral marketing is preferred because it helps companies build a customer base and an interconnected referral network. It is also cost-effective for marketing since money is spent only on actual new conversions. Further, B2B Referral Marketing Software showed better retention rates, at around 37%.
Companies are increasingly switching over to automated referral marketing processes over manual ones. Referral marketing software can help automate manual processes so that companies can focus on optimizing their referral programs and figuring out what is working best for them. This software also helps with integration with other systems, such as with referral marketing platforms on which they sell products, or even integration with other vendor's sites.
Dropbox, an online storage and file transfer service provider, ran a program that did not run on monetary rewards but was still massively successful, showing an initial growth of 3900% in 15 months, going from 100k to 4 Million users in 2008 to 2010 period. The program rewarded existing customers for every contact referred, with additional space. Those on the Basic Membership can earn 500 MB each time, up to 16 GB; while those on the Plus and Professional Memberships can earn up to 32 GB total, equated to 1 GB per contact.
Harry’s, a mail-order-based shaving brand, ran a hugely successful pre-launch referral-marketing program, gaining 100,000 emails in a single week. Approximately 77% of these emails were based on referrals alone, with each referrer on average converting three consumers. The 4-tiered system provided tangible rewards for products. A single consumer could refer anywhere from 5 to 50 friends to gain the rewards. Over 200 people reached the 50-people mark and gained the reward of a free year of shaving. The product page also involved a tracker so consumers could keep up with referrals and provide them proof that their referrals were actually being accounted for.
A popular form of referral marketing is community-based referral marketing. The company ties up with community centers and non-profit organizations. A charitable donation on a consumer’s behalf can prove to be a strong reward incentive to a consumer as it combines the referral process with the idea of a positive social contribution. Consumers will be more willing to be part of a referral process if they believe they are also providing some kind of contribution to society as a result of their actions.
TOMS, for example, ran a Buy One, Give One model that incentivized customers by telling them that a pair of shoes would be donated to children in need every time a customer bought a pair. Vena, a software management SaaS company, donates USD 2,000 to a charity of the customer’s choice for every converted lead.
According to studies, 60% of buyers look at a company’s social media presence before buying its products. Further, it was found that 18% of people in the 25-34 year category would not provide referrals to a firm that is not on social media. Further, in the current environment of social media, word of mouth travels the most through social media.
The phenomenon of Social proof, or informational social influence, is an idea that has been pushing companies toward investing in referral marketing. It refers to the idea that people take cues from how to behave by emulating the behavior of others they see. Therefore, people who notice brands in a story online will also tend to buy a product and post a story, which is then visible to all their friends and followers, creating a highly influential and rewarding process for brands. The benefits of extending referral marketing to social media are numerous. For one, sharing and promotion become easier. Secondly, customers can easily vet out a brand just based on comment sections and other engagements with the posts.
Businesses are looking at harnessing the wave of influencer popularity, especially amongst Micro and Nano influencers with niche audiences, who have relatively smaller followings but work very well for referral programs since they have better engagement and personal connections with their following. Influencers whose social media presence is closely associated with the product offer something which traditional advertising cannot do.
Unlike traditional forms of advertisement, using niche influencers can allow brands to benefit from the fact that niche influencers are renowned for being knowledgeable about the product concerned and the audience they have cultivated is highly likely to be people who fall into the target market. Under these programs, brands can pursue varied methods of referral marketing such as through a referral code specifically made for the influencer, or through incentives for the audience, an influencer has driven to the brand.
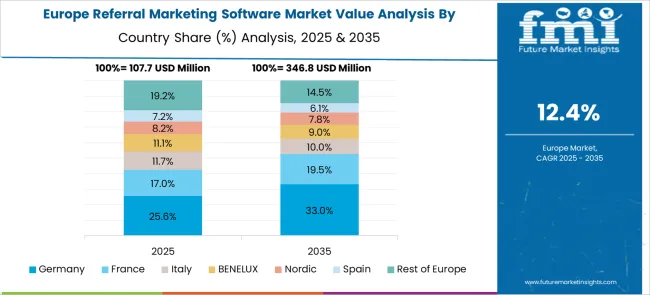
With a Referral Marketing Software market share of 25.2%, the market value of Europe is projected to reach a valuation of USD 1764.3 Million by 2035. According to a survey of over 32,000 consumers in Europe and the USA, 66% of repliers said they asked those around them before making purchasing decisions.
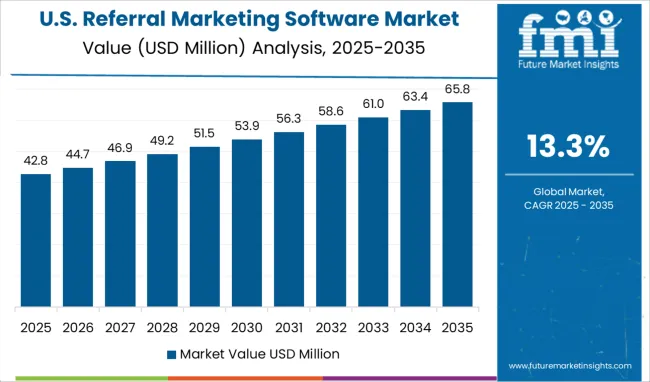
The USA accounted for over 30% of the global Referral Marketing Software Market in 2024, with a forecasted market size of USD 1764.3 Million by 2035. According to research, an average American citizen mentions brands over 60 times weekly, with 90% of these name drops being online. Referral marketing software in the USA is projected to garner an absolute dollar opportunity of USD 506.1 Million between 2025 and 2035.
Large industries are the key contributors to demand, having experienced a CAGR of 15%, with a forecasted CAGR of 12.8% for the next decade. These enterprises can afford to provide attractive rewards and require automation for any kind of referral marketing due to the massive volumes of customers that will be passing through the process.
Google, for example, has a referral program for its G Suite program, targeting mainly business professionals. The program is widely used in businesses. There is a monetary reward for referrals, through which businesses can earn USD 30 for every person referred, capped at a maximum of USD 3,000.
However, small businesses also stand to benefit from referral marketing. They benefit from decreased customer acquisition costs, increased brand awareness, higher ROI, and improvements in retention rates. In order for this marketing to be efficient and scalable, the use of automation through referral marketing software becomes essential, which has been boosting demand.
BFSIs are the top end-users for referral marketing software, having witnessed a CAGR of 15.2% with a forecasted CAGR of 13% for the upcoming decade. Fintech apps are being developed and released on a regular basis, which means the demand for financial services is at an all-time high compared to those competing for the business. This method also keeps clients interested in the company.
Both cloud-based and on-premise software have comparative advantages. Demand for cloud-based Referral Marketing Software has increased over the years due to its flexibility, scalability, and cost-effectiveness.
On-premise forms of software, on the other hand, are observed as more secure as they offer enterprises a degree of control, both in terms of security and possible breaches or malfunctions. The costs however are significantly higher in the case of on-premise software, for the maintenance and management as well as for the setup itself.
Referral Marketing Software companies are focused on increasing their presence and reach. The key companies operating include Impartner, Referral Candy, Genius Referral, Viral Loops Ltd, Hello Referrals, Tapfiliate, Mention Me, Annex Cloud, Invitevox, InfluitivE, Rocket Referrals, Extole, Refersion, InviteReferrals, OmniStar, Referral SaaSquatch, Friendbuy, and Buyapowa.
Some of the recent developments in Referral Marketing Software are as follows:
Similarly, recent developments related to companies manufacturing Referral Marketing Software have been tracked by the team at Future Market Insights, which is available in the full report.
The global referral marketing software market is estimated to be valued at USD 506.1 million in 2025.
It is projected to reach USD 1,764.3 million by 2035.
The market is expected to grow at a 13.3% CAGR between 2025 and 2035.
The key product types are cloud-based and web-based.
large enterprises segment is expected to dominate with a 54.6% industry share in 2025.


Our Research Products

The "Full Research Suite" delivers actionable market intel, deep dives on markets or technologies, so clients act faster, cut risk, and unlock growth.

The Leaderboard benchmarks and ranks top vendors, classifying them as Established Leaders, Leading Challengers, or Disruptors & Challengers.

Locates where complements amplify value and substitutes erode it, forecasting net impact by horizon

We deliver granular, decision-grade intel: market sizing, 5-year forecasts, pricing, adoption, usage, revenue, and operational KPIs—plus competitor tracking, regulation, and value chains—across 60 countries broadly.

Spot the shifts before they hit your P&L. We track inflection points, adoption curves, pricing moves, and ecosystem plays to show where demand is heading, why it is changing, and what to do next across high-growth markets and disruptive tech

Real-time reads of user behavior. We track shifting priorities, perceptions of today’s and next-gen services, and provider experience, then pace how fast tech moves from trial to adoption, blending buyer, consumer, and channel inputs with social signals (#WhySwitch, #UX).

Partner with our analyst team to build a custom report designed around your business priorities. From analysing market trends to assessing competitors or crafting bespoke datasets, we tailor insights to your needs.
Supplier Intelligence
Discovery & Profiling
Capacity & Footprint
Performance & Risk
Compliance & Governance
Commercial Readiness
Who Supplies Whom
Scorecards & Shortlists
Playbooks & Docs
Category Intelligence
Definition & Scope
Demand & Use Cases
Cost Drivers
Market Structure
Supply Chain Map
Trade & Policy
Operating Norms
Deliverables
Buyer Intelligence
Account Basics
Spend & Scope
Procurement Model
Vendor Requirements
Terms & Policies
Entry Strategy
Pain Points & Triggers
Outputs
Pricing Analysis
Benchmarks
Trends
Should-Cost
Indexation
Landed Cost
Commercial Terms
Deliverables
Brand Analysis
Positioning & Value Prop
Share & Presence
Customer Evidence
Go-to-Market
Digital & Reputation
Compliance & Trust
KPIs & Gaps
Outputs
Full Research Suite comprises of:
Market outlook & trends analysis
Interviews & case studies
Strategic recommendations
Vendor profiles & capabilities analysis
5-year forecasts
8 regions and 60+ country-level data splits
Market segment data splits
12 months of continuous data updates
DELIVERED AS:
PDF EXCEL ONLINE
Marketing Mix Optimisation Market Size and Share Forecast Outlook 2025 to 2035
Marketing Sample Kits Market Size and Share Forecast Outlook 2025 to 2035
Marketing Transcription Market by Solution, Type, Industry, and Region – Growth, Trends, and Forecast through 2025 to 2035
Marketing Calendar Software Market Insights - Trends & Forecast 2025 to 2035
Geomarketing Market Size and Share Forecast Outlook 2025 to 2035
AI Marketing Tool Market Analysis – Growth & Future Demand 2024-2034
Neuromarketing Solutions Market Size and Share Forecast Outlook 2025 to 2035
Book Marketing Software Market Size and Share Forecast Outlook 2025 to 2035
AI & Automation Reshaping Email Marketing for Maximum ROI
Mobile Marketing Market Growth – Trends & Forecast 2025 to 2035
Digital Marketing Analytics Industry Analysis in Latin America Forecast Outlook 2025 to 2035
AI-Powered Digital Marketing Analytics – Smarter Insights
Digital Marketing Software Market Analysis - Size, Share, and Forecast Outlook 2025 to 2035
Affiliate Marketing Software Market Size and Share Forecast Outlook 2025 to 2035
Influencer Marketing Market
2D Bar Code Marketing Market Analysis by Technology, Code Types, Applications, and Region Through 2035
Destination Marketing Market Analysis – Growth & Forecast 2024-2034
Location-Based Marketing Services Market Trends - Growth & Forecast through 2035
Conversational Marketing Software Market Size and Share Forecast Outlook 2025 to 2035
Pharma and Healthcare Social Media Marketing Market Size and Share Forecast Outlook 2025 to 2035

Thank you!
You will receive an email from our Business Development Manager. Please be sure to check your SPAM/JUNK folder too.
Chat With
MaRIA