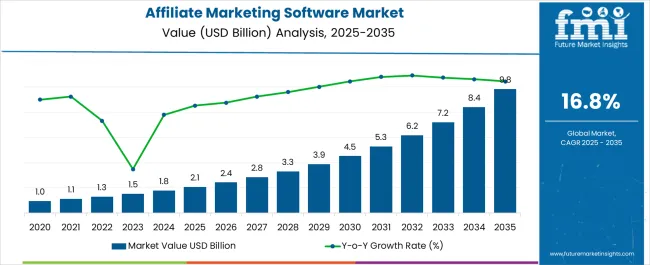
The Affiliate Marketing Software Market is estimated to be valued at USD 2.1 billion in 2025 and is projected to reach USD 9.8 billion by 2035, registering a compound annual growth rate (CAGR) of 16.8% over the forecast period.
| Metric | Value |
|---|---|
| Affiliate Marketing Software Market Estimated Value in (2025 E) | USD 2.1 billion |
| Affiliate Marketing Software Market Forecast Value in (2035 F) | USD 9.8 billion |
| Forecast CAGR (2025 to 2035) | 16.8% |
The affiliate marketing software market is advancing at a steady pace, supported by the rapid digitalization of businesses and the growing adoption of performance-based marketing models. Industry press releases and technology reports have highlighted increasing investments in affiliate networks and automation platforms, which are enabling brands to optimize partner management and track sales outcomes with greater accuracy.
Rising competition among e-commerce and retail companies has further accelerated the demand for software solutions that improve customer acquisition efficiency and maximize return on investment. Data privacy regulations and evolving consumer expectations for transparency are driving the development of compliant, analytics-driven software systems.
Additionally, integration with advanced technologies such as AI-powered analytics, API-based connectivity, and real-time reporting has strengthened the relevance of affiliate marketing platforms across diverse sectors. The market outlook remains positive as businesses focus on scaling their outreach through diversified affiliate partners, while leveraging software solutions to ensure cost efficiency, fraud prevention, and measurable campaign performance.
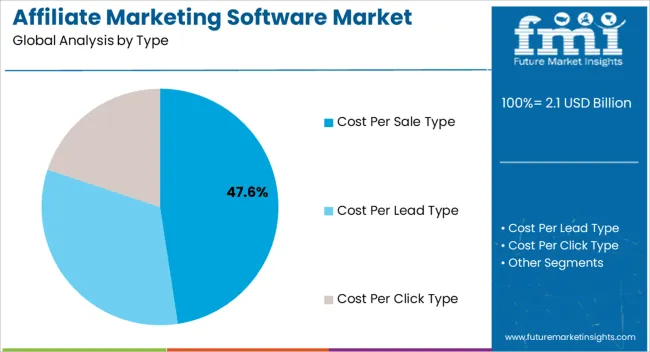
The Cost Per Sale (CPS) Type segment is projected to account for 47.6% of the affiliate marketing software market revenue in 2025, positioning itself as the leading type. This dominance has been driven by its direct alignment with performance-based outcomes, ensuring advertisers only incur costs when a successful sale is generated.
Businesses have increasingly adopted CPS models to improve marketing efficiency, minimize wasted ad spend, and directly link partner incentives with revenue growth. Reports from digital marketing associations have noted the widespread preference for CPS arrangements due to their accountability, scalability, and transparency.
Software providers have enhanced CPS tracking capabilities through AI-driven fraud detection and accurate attribution models, further reinforcing confidence among advertisers. As consumer purchase behaviors shift towards online platforms, CPS has been favored for its measurable and results-oriented approach, which has ensured its continued leadership in affiliate marketing strategies.
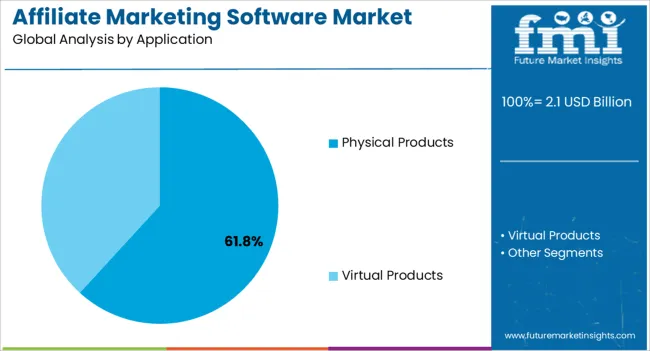
The Physical Products segment is projected to hold 61.8% of the affiliate marketing software market revenue in 2025, retaining its leading position within applications. Growth in this segment has been supported by the surge in e-commerce, retail, and consumer goods industries, where affiliate marketing has become a core sales driver.
Brands selling physical goods have adopted affiliate software to expand their reach through influencers, content creators, and comparison platforms. Retail industry updates have emphasized the role of affiliate networks in boosting visibility, increasing conversion rates, and enabling effective customer targeting.
Furthermore, physical products benefit from the tangibility and repeat-purchase potential that enhance affiliate earnings, making them attractive for partners. Integration of affiliate marketing software with order management and logistics tracking has also improved operational efficiency for physical product campaigns. With ongoing growth in online shopping and diversified product categories, the Physical Products segment is expected to remain the dominant application area.
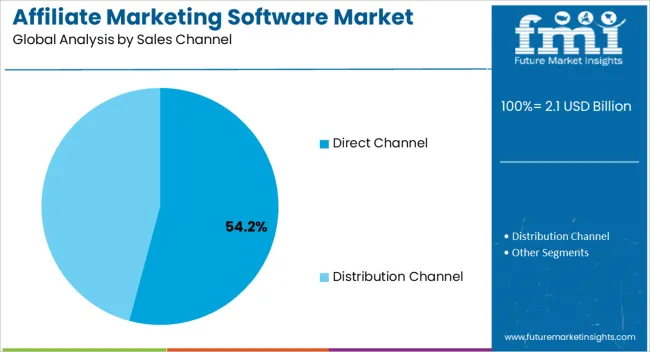
The Direct Channel segment is projected to contribute 54.2% of the affiliate marketing software market revenue in 2025, establishing its leadership within sales channels. This growth has been influenced by the increasing preference of brands to manage affiliate programs directly, enabling stronger control over commissions, partner selection, and performance tracking.
Direct engagement has allowed businesses to build closer relationships with affiliates, ensuring alignment with brand values and marketing objectives. Company reports and software provider announcements have pointed to the rise of self-service affiliate platforms that streamline program setup and monitoring for direct channel users.
The ability to integrate direct channels with customer databases and CRM systems has also improved campaign personalization and attribution accuracy. Furthermore, direct channel adoption has reduced reliance on third-party networks, enhancing profitability and transparency. As businesses continue to prioritize first-party data control and brand-driven affiliate strategies, the Direct Channel segment is expected to maintain its dominant role in the market.
The global affiliate marketing software market expanded at a CAGR of 15.6% from 2020 to 2025. Applications like Affise make finding counterparts easy and promoting brands, offers, and payments easy. Auditing these solutions provides new opportunities for found partners to engage with people and strengthen brand awareness.2025. Applications like Affise make it easy to find counterparts and promote brands, offers, and payments. Auditing these solutions provides new opportunities for found partners to engage with people and strengthen brand awareness.
Without having to engage in active marketing, affiliate marketing enables the company to reach new consumers. Because the commission is only due in the case of a conversion, it is economical and low risk. The United States will continue to be the largest user of the affiliate marketing software market throughout the analysis period, accounting for over USD 7.72 billion absolute dollar opportunity in the coming 10-year period. absolute dollar opportunity in the coming 10-year period.
During the projected period, the worldwide affiliate marketing platform market will experience growth due to the creation of income and employment through affiliate marketing business models and cost-effective business programs. Affiliate marketing is a performance-based model established as a well-known strategy for increasing sales and making big financial gains online.
Programs for affiliate marketing that help people make money include content marketing programs (for blogs and websites), coupon-site programs, and digital assets, among others. Additionally, due to the low-cost structure of product advertising through affiliate marketing networks, which offer substantial commissions to marketers, it is equally welcomed by several enterprises.
The affiliate software market is expanding due to rising investment in the advertising sector. The demand for mobile and online applications has grown dramatically in the digital age. A corporation typically employs the best solution of referring and profiting from referrals to improve the penetration of these applications among people.The market for affiliate software is expanding as a result of rising investment in the advertising sector. In the digital age, the demand for mobile and online applications has grown dramatically. A corporation typically employs the best solution of referring and profiting from referrals to improve the penetration of these applications among people.
This aids the business in creating a robust and sizable user base for the application. The demand for online and mobile applications is driven by financial rewards and other advantages associated with referral. To track these records and prevent duplication, affiliate software is becoming more popular globally. is being driven by financial rewards and other advantages associated with referral. In order to track these records and prevent duplication, affiliate software is becoming more popular globally.
Deeplinks, traffic back, and cross-postback URLs are integrated AI features. Companies can use advanced targeting settings to match products with the right users and redirect users to a specific piece of content on a website or within a mobile app. Since most affiliate programs are free to join and do not require a lot of experience, newbies may usually get started quickly. High-value product promotion could bring up to USD 3.0 thousand daily for a top affiliate.
During the anticipated timeframe, affiliate fraud is a restraint on the market for affiliate marketing platforms. Companies and brands have embraced affiliate marketing significantly as web browsing and online purchasing are on the rise, with a 22% global rise in online purchasing in the year 2024.
global rise in online purchasing in the year 2024.
Given that an affiliate program may pay up to 30% of a user's purchase to an affiliate marketer, it presents a prime opportunity for fraud. Affiliate marketing schemes have a danger of fraud as retailer does not have a verified profile most often. Some affiliate fraud techniques include cookie stuffing, attribution fraud, typo-squatting, and using stolen data to generate leads. For Instance, one particular extension targeted at Chinese users sent all user activity to a remote server by injecting tracking beacons into user sessions.Affiliate marketing schemes have a danger of fraud as retailer does not have a verified profile most often. Some of the techniques of affiliate fraud include cookie stuffing, attribution fraud, typo-squatting, and using stolen data to generate leads. For Instance, one particular extension targeted at Chinese users sent all user activity to a remote server by injecting tracking beacons into user sessions.
To handle affiliate software, businesses outsource these services to international companies such as Asia Pacific, which is a big market for the advertising sector. Due to a lack of expertise and knowledge of the advantages of associated software, the product is not being developed as quickly as the web/mobile application market. It is predicted that the impact of the restriction would gradually lessen over the next few years as digitization becomes more widespread, awareness levels rise, and skill sets are developed.
During the forecast period, the market for affiliate monitoring software in North America is anticipated to develop at the highest CAGR. North America accounts for 2/5th of the global affiliate marketing Software market. The expansion of the market in this region's small, medium, and big businesses (SMEs) and corporations is a result of their increased use of cloud-based affiliate tracking software. In addition, the expansion of the North American affiliate tracking software market is aided by the presence of key players like Google, Facebook, Amazon, and Apple in this region.
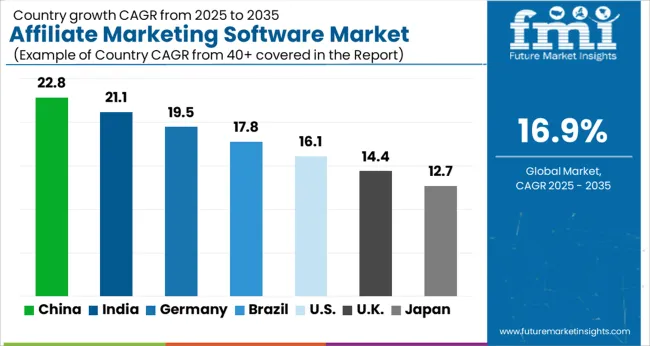
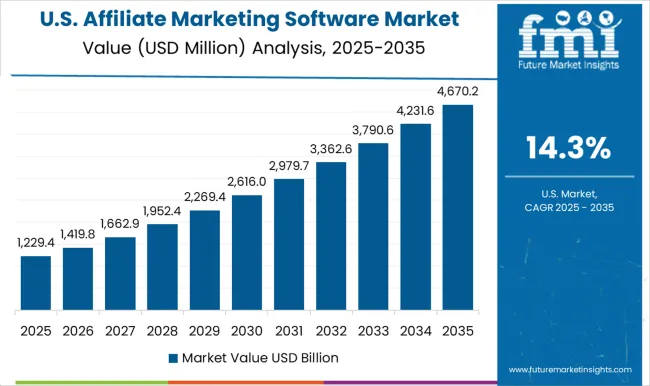
The United States is anticipated to account for over USD 9.8 billion of the global affiliate marketing software market by the year 2035. Affiliate Marketing Software Market growth from 2020 to 2025 was estimated at 9.8% CAGR. Amazon's affiliate marketing was controversial right from its inception, and its success attracted the attention of rivals, which prompted the use of promotion arms to take a cut of sales on Amazon. The Amazon phenomenon was not as big in the rest of the world due to its particular niche. Because of the target market, its main industry, Amazon associates, an average American, have a worldwide appeal, further giving affiliate marketing additional reach.industry, Amazon associates, an average American, have a worldwide appeal, which further gives affiliate marketing additional reach.
The virtual products segment expanded at a CAGR of 9.4% over the last six years (2020 to 2025). Running a performance marketing program requires less time and work when using affiliate marketing software. While real-time data enables us to assess campaigns, forecast future outcomes, and make quicker decisions, automated tools help to increase productivity and accuracy. Software programs like Affise, with its virtual product services, have considerable cost-cutting for consumers with ease of access to services.Affise with its virtual product services have considerable cost cutting for consumers with ease of access to services.
The market growth through cost per sale type expanded at a CAGR of 9.7% over the last six years (2020 to 2025). Advertisers can take action to cut costs, boost profit, and maximize productivity by understanding and monitoring the cost per sale happening through software tools. Due to the ability to break down an advertisement's success into specifics like clicks and page readings, measuring it for digital advertising is the most precise and effective. The majority of the marketing companies employ this strategy. Hence, the cost-per-sale segment dominates in the affiliate marketing software market.
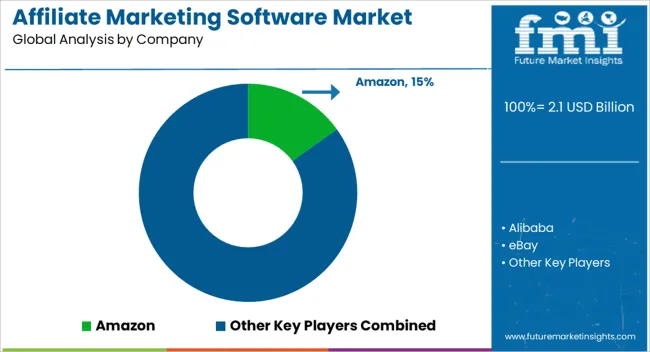
At present, affiliate marketing software service provides companies aiming to launch a new product and invest capital for company expansion to different regions. The key companies operating in the affiliate marketing software market Include QualityUnit, Tipalti, LeadDyno, Offerslook, Scaleo, Tapfiliate, Affise Technologies, Target Circle, TrackingDesk, iDevDirect, Codewise, Cellxpert, HitPath, Linkdex, Resels, Oplytic, among others.
Pitchbox, and TrackingDesk.
Some of the recent developments by key providers of the affiliate marketing software market are as follows:
The global affiliate marketing software market is estimated to be valued at USD 2.1 billion in 2025.
The market size for the affiliate marketing software market is projected to reach USD 9.8 billion by 2035.
The affiliate marketing software market is expected to grow at a 16.8% CAGR between 2025 and 2035.
The key product types in affiliate marketing software market are cost per sale type, cost per lead type and cost per click type.
In terms of application, physical products segment to command 61.8% share in the affiliate marketing software market in 2025.


Full Research Suite comprises of:
Market outlook & trends analysis
Interviews & case studies
Strategic recommendations
Vendor profiles & capabilities analysis
5-year forecasts
8 regions and 60+ country-level data splits
Market segment data splits
12 months of continuous data updates
DELIVERED AS:
PDF EXCEL ONLINE
Marketing Mix Optimisation Market Size and Share Forecast Outlook 2025 to 2035
Marketing Sample Kits Market Size and Share Forecast Outlook 2025 to 2035
Marketing Transcription Market by Solution, Type, Industry, and Region – Growth, Trends, and Forecast through 2025 to 2035
Marketing Calendar Software Market Insights - Trends & Forecast 2025 to 2035
Geomarketing Market Size and Share Forecast Outlook 2025 to 2035
AI Marketing Tool Market Analysis – Growth & Future Demand 2024-2034
Neuromarketing Solutions Market Size and Share Forecast Outlook 2025 to 2035
Book Marketing Software Market Size and Share Forecast Outlook 2025 to 2035
AI & Automation Reshaping Email Marketing for Maximum ROI
Mobile Marketing Market Growth – Trends & Forecast 2025 to 2035
Digital Marketing Analytics Industry Analysis in Latin America Forecast Outlook 2025 to 2035
AI-Powered Digital Marketing Analytics – Smarter Insights
Digital Marketing Software Market Analysis - Size, Share, and Forecast Outlook 2025 to 2035
Referral Marketing Software Market Size and Share Forecast Outlook 2025 to 2035
Influencer Marketing Market
2D Bar Code Marketing Market Analysis by Technology, Code Types, Applications, and Region Through 2035
Destination Marketing Market Analysis – Growth & Forecast 2024-2034
Location-Based Marketing Services Market Trends - Growth & Forecast through 2035
Conversational Marketing Software Market Size and Share Forecast Outlook 2025 to 2035
Pharma and Healthcare Social Media Marketing Market Size and Share Forecast Outlook 2025 to 2035

Thank you!
You will receive an email from our Business Development Manager. Please be sure to check your SPAM/JUNK folder too.
Chat With
MaRIA