The global interventional radiology market is worth USD 30,336.0 million in 2025 and is anticipated to reach a value of USD 49,430.6 million by 2035. Sales are projected to rise at a CAGR of 5.2% over the forecast period between 2025 and 2035. The revenue generated by interventional radiology in 2024 was USD 28,775.6 million.
Interventional radiology (IR) market has evolved into a transformative force in modern health care, influenced by the increasingly adopted minimally invasive, image-guided medical procedures. Techniques in IR are now crucial to managing a wide array of conditions that affect various organ systems, including central venous access procedures alone accounting for nearly 40% of all annual IR interventions performed in Europe.
Using advanced imaging technologies, interventional radiologists guide thin catheters and guidewires through blood vessels with precision, which allows for direct delivery of medications, nutrition, and fluids into the bloodstream while keeping the patient relatively comfortable and decreasing the need for repeated needle insertions.
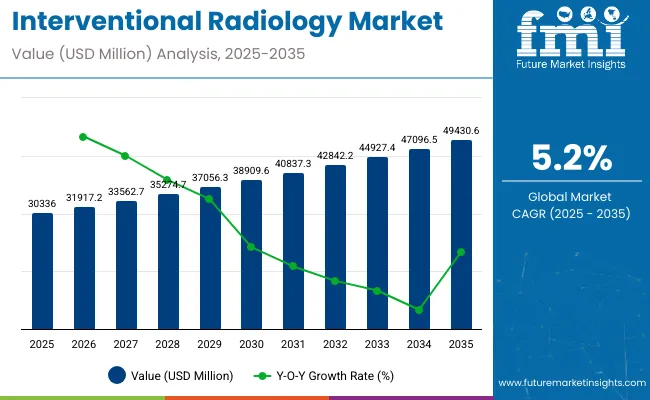
| Attributes | Key Insights |
|---|---|
| Historical Size, 2024 | USD 28,775.6 million |
| Estimated Size, 2025 | USD 30,336.0 million |
| Projected Size, 2035 | USD 49,430.6 million |
| Value-based CAGR (2025 to 2035) | 5.2% |
The IR market globally has been rapidly growing as it is in greater demand, based on the newer medical technologies providing shorter recovery periods and lower procedural risks with improved outcomes for patients in comparison to traditional open surgeries.
Continued technological advancements in catheter-based technologies, imaging modalities, and specialized medical devices have extended the IR scope of applications, from vascular interventions to targeted cancer therapies. This focus on innovation has dramatically changed the pattern of patient care and created specialist tools and systems that have been introduced into medicine across cardiology, oncology, and neurology.
The rising prevalence of chronic conditions, coupled with expanding applications of IR techniques, continues to drive market demand. Such technological superiority, procedural excellence, and top-notch clinical care make the future of modern-day delivery of healthcare inevitable, as will the IR marketplace play a big role in delivering higher standards of treatment for patients who will be facing the shift the world is shifting towards minimally invasive treatment procedures.
The interventional radiology (IR) space is rapidly evolving through the integration of smart technologies such as robotic-assisted systems, AI-driven imaging, real-time navigation software, and data analytics platforms. These innovations are enhancing precision, reducing risks, and improving workflow efficiency in minimally invasive procedures. Below are key companies leading this transformation:
Government regulations in the interventional radiology market are designed to ensure patient safety, procedural consistency, and device efficacy in image-guided therapies. Regulatory bodies introduce rigorous guidelines covering device approval, clinical validation, and operator training. Compliance with these standards helps institutions deliver high-quality, minimally invasive care with reliable technologies.
A comparative analysis of fluctuations in compound annual growth rate (CAGR) for the interventional radiology industry outlook between 2024 and 2025 on a six-month basis is shown below. By this examination, major variations in the performance of these markets are brought to light, and trends of revenue generation are captured hence offering stakeholders useful ideas on how to carry on with the market’s growth path in any other given year. January through June covers the first part of the year called half1 (H1), while half2 (H2) represents July to December.
The table below compares the compound annual growth rate (CAGR) for the global interventional radiology industry analysis from 2024 to 2025 during the first half of the year. This overview highlights key changes and trends in revenue growth, offering valuable insights into market dynamics.
H1 covers January to June, while H2 spans July to December. In the first half (H1) of the decade from 2024 to 2034, the business is predicted to surge at a CAGR of 5.9%, followed by a slightly lower growth rate of 5.6% in the second half (H2) of the same decade.
| Particular | Value CAGR |
|---|---|
| H1 | 5.9% (2024 to 2034) |
| H2 | 5.6% (2024 to 2034) |
| H1 | 5.2% (2025 to 2035) |
| H2 | 4.7% (2025 to 2035) |
Moving into the subsequent period, from H1 2025 to H2 2035, the CAGR is projected to decrease slightly to 5.2% in the first half and projected to lower at 4.7% in the second half. In the first half (H1) the market witnessed a decrease of 70 BPS while in the second half (H2), the market witnessed a decrease of 90 BPS.
The increasing prominence of IO as the fourth pillar of cancer care is one of the factors contributing to significant growth in the IR market. This growing subspecialty employs image-guided, minimally invasive techniques in the management of various oncologic conditions and thus presents alternatives to conventional cancer treatments.
IRs are increasingly performing all types of procedures, from tumor ablations and embolization therapies to radioembolization and palliative care interventions such as neurolysis for the management of cancer-related pain. These therapies provide effective solutions for patients in neoadjuvant, adjuvant, curative, palliative, and salvage treatment phases, further amplifying the market's expansion.
The growing understanding of molecular mechanisms underlying various IO therapies has fueled interdisciplinary collaborations, resulting in combined approaches that integrate IR with systemic targeted therapies. This synergy enhances treatment efficacy while minimizing systemic side effects, making IR a preferred choice in comprehensive cancer management strategies.
Additionally, the spectrum of IR applications in oncology has expanded and procedure success rates have been reinforced by the ongoing development of sophisticated embolic agents, ablation technologies, and imaging systems. The rising need for focused, minimally invasive treatment alternatives due to the ongoing global increase in cancer prevalence is anticipated to support the interventional radiology market's growth trajectory in the upcoming years.
The growing trend of preference for minimally invasive treatments in reproductive health has been a key factor driving the growth of the IR market. Procedures such as UFE and pelvic venous congestion syndrome treatments offer highly effective alternatives to traditional surgeries, reducing recovery times, hospital stays, and procedural risks.
Meanwhile, PAE (prostate artery embolization) for benign prostatic hyperplasia and varicocele embolization for male infertility have also gained attention due to their favorable results with minimal invasiveness. Increasing patient awareness along with advances in embolic materials and catheter technologies have increased the adoption of these treatments. Healthcare providers also recommend IR-based reproductive procedures due to their cost-effective nature and the ability to retain fertility compared to more invasive surgical procedures.
This shift reflects the increasing demand for patient-centered, non-surgical solutions in reproductive care and places IR as the front-runner in both patient and clinician preference for effective alternatives to conventional reproductive surgeries.
The incorporation of artificial intelligence (AI) and robotics into interventional radiology (IR) creates transformative prospects by redefining procedural accuracy, efficiency, and patient outcomes. AI-powered imaging techniques, such as real-time fluoroscopy enhancement and automated lesion recognition, enable radiologists to make more informed decisions during difficult operations. Robotics, on the other hand, enhances procedural control with greater stability and precision, especially in delicate interventions where micromovements can impact patient safety.
The application of simulation-to-reality (Sim2Real) technologies further amplifies this impact by allowing specialists to practice virtual procedures under highly realistic conditions, bridging the gap between training simulations and real-world clinical application. This convergence not only improves procedural success rates but also standardizes care by reducing human variability.
Additionally, robotic automation has the potential to extend IR capabilities to remote regions through tele-operated systems, expanding global access to specialized care. As AI and robotic systems continue to evolve, their ability to minimize procedural risks and optimize treatment outcomes positions them as key drivers for long-term market growth in the IR sector.
A significant factor restraining the growth of the include a shortage of highly trained specialists and steep learning curves in mastering complex procedures. Interventional radiology is very specialized and uses several complex image-guided techniques that include embolizations, ablations, and catheter-based interventions that require a very high degree of technical ability combined with spatial awareness and fine hand-eye coordination.
However, the pool of qualified professionals remains limited at present, as these skills require very extensive and hands-on experience, which is hard to be acquired through conventional training pathways.
Moreover, procedural complexity continues to increase with the development of advanced imaging tools and next-generation catheter technologies, further raising demands for specialized skills. The lack of uniformity in training methods from one region and institution to another has led to nonuniform development of skills, thereby resulting in variation in procedural success rates.
This talent shortage not only limits the adoption of IR techniques in emerging markets but also affects procedural efficiency and patient safety, posing a significant barrier to the widespread expansion of the global interventional radiology Industry.
The global interventional radiology industry recorded a CAGR of 4.8% during the historical period between 2020 and 2024. The growth of the interventional radiology diagnostics industry was positive as it reached a value of USD 28,775.6 million in 2024 from USD 23,800.0 million in 2020.
Historically, the IR market has grown significantly owing to the rise in minimally invasive procedures and improvement in imaging technologies. The increasing burden of chronic diseases, such as cardiovascular disorders, cancer, and neurological disorders, has been a key driver in the growth of IR techniques.
In this historical period, the adoption of cone-beam computed tomography and 3D fluoroscopy became widespread, thus enhancing procedural precision and broadening the scope of image-guided treatments. Besides, IR procedures have shifted to outpatient settings on the back of cost advantages, coupled with preference by patients toward less invasive methods of treatment.
For this, the future of interventional radiology shall continue with AI integration for decision support in real-time and enhanced diagnostic precision by the integration of Machine Learning. It will probably find robotics very apt at driving automation into complex interventions with vascular and neuro-interventional procedures in the front row for the elevation of the precision level to heights of uniformity in treatments.
This trend for personalized medicine will also continue to drive the demand for targeted therapies, such as radioembolization and drug-eluting technologies. The market is also expected to see an expansion in applications related to regenerative medicine and pain management, further diversifying the role of IR beyond traditional vascular and oncologic treatments.
Increasing investments in training programs, and collaboration on skill gaps between health institutions and medical device manufacturers may further contribute to market directions that ensure wide access to modern IR technologies. All these go forward to place the IR market in a strategically poised position to realize strong growth driven by breakthroughs in technology and increasing global demand for minimally invasive healthcare interventions.
Tier 1 companies are the major companies as they hold a 33.5% share worldwide. These companies in the interventional radiology (IR) market leverage strategic collaborations with medical device innovators, research institutions, and healthcare centers to drive advancements in imaging technologies and minimally invasive treatment solutions.
These partnerships facilitate the co-development of next-generation imaging systems, such as AI-powered MRI and CT scanners, enhancing procedural accuracy and expanding clinical applications. Prominent companies within tier 1 include Siemens Healthineers, GE Healthcare, Philips Healthcare, Fujifilm Holdings Corporation.
Tier 2 companies are relatively smaller as compared with tier 1 players. The tier 2 companies hold a share of 29.1% worldwide. These firms distinguish themselves through flexibility, rapidly innovating tailored technologies for emerging medical needs, such as interventional oncology and reproductive health procedures.
By targeting underserved segments and specialized clinical demands, Tier 2 players contribute to market diversity and promote accessibility to cutting-edge IR treatments in both developed and developing healthcare markets. Key Companies under this category include Canon Medical Systems, Hitachi Medical Corporation, Hologic, Inc., Agfa-Gevaert Group, Mindray Medical International and United Imaging Healthcare
The section below covers the industry analysis for interventional radiology sales for different countries. Market demand analysis on key countries in several regions of the globe, including North America, Latin America, East Asia, South Asia & Pacific, Western Europe, Eastern Europe, and Middle East & Africa is provided. The United States is anticipated to remain at the forefront in North America, with a CAGR of 2.3% through 2035. In South Asia & Pacific, India is projected to witness the highest CAGR in the market of 7.4% by 2035.
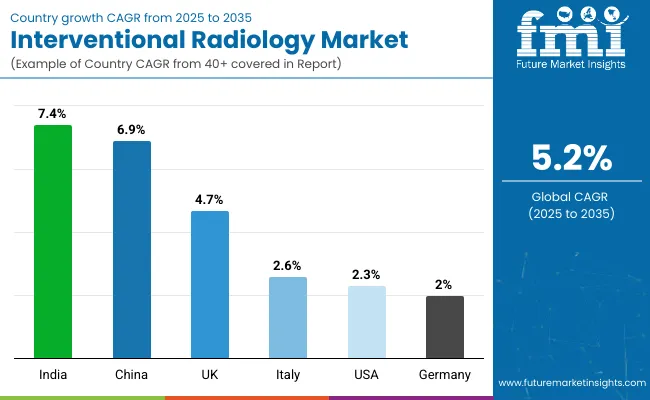
| Countries | Value CAGR (2025 to 2035) |
|---|---|
| United States | 2.3% |
| Germany | 2.0% |
| Italy | 2.6% |
| UK | 4.7% |
| India | 7.4% |
| China | 6.9% |
The United States dominates the global market with high share in 2024. The United States is expected to exhibit a CAGR of 2.3% throughout the forecast period (2025 to 2035).
The rising preference for minimally invasive treatments over traditional surgical interventions is a significant driver of the interventional radiology (IR) market in the United States.
For instance, a substantial 92% of patients prefer undergoing minimally invasive procedures, citing benefits such as reduced recovery times, lower complication risks, and enhanced procedural outcomes compared to conventional surgeries. This study was published in NCBI 2023.
However, only 39.8% of participants recognized IR as a medical specialty, with less than half accurately identifying it as procedurally oriented. Of those who underwent IR procedures, many were initially offered the same treatments by surgeons, with 71% acknowledging that their choice was influenced by a lack of awareness about IR.
Encouragingly, almost half of the respondents expressed interest in learning more about IR treatments, particularly through short educational videos and guidance from primary care providers. This increasing patient demand, paired with ongoing efforts to improve awareness, continues to drive the expansion of the United States IR market.
In 2024, Germany held a dominant revenue in the Western Europe market and is expected to grow with a CAGR of 2.0%.
Advanced imaging integrated into the procedures and strong regulatory support have been some of the major driving forces in the IR market within Germany. The broad diffusion of diagnostic tools powered by AI, including real-time image guidance and robotic-assisted systems, has managed to improve procedural accuracy, hence yielding better clinical outcomes. The health infrastructure of Germany is highly focused on quality control and patient safety, and that too has accelerated the introduction of leading-edge IR technologies.
Furthermore, smooth regulatory pathways and positive reimbursement policies in relation to minimally invasive procedures have encouraged innovative device and technique launches in the market. Academic-medical technology partnerships continue to drive innovative IR tool development, such as 3D navigation systems and hybrid operating rooms. Such technological advances, combined with a supportive regulatory framework, place Germany in a critical position within the global IR market.
India occupies a leading value share in South Asia & Pacific market in 2024 and is expected to grow with a CAGR of 7.4% during the forecasted period.
The Indian Interventional Radiology market exudes strong growth factors with rising medical tourism and increasing healthcare investments in the country. India has indeed emerged as one of the favored destinations for offering low-cost but quality medical care with state-of-the-art services in minimally invasive treatments. Factors that have contributed to its market growth include the increase in the numbers of multispecialty hospitals boasting well-equipped IR facilities.
Besides this, increasing government investments in the modernization of public healthcare infrastructure at large, covering digital imaging technologies and catheterization labs, have further supported the market. Increasing awareness for the management of non-communicable diseases like cancer and cardiovascular diseases has drastically surged demand for IR procedures.
This is highly strengthened by increasing private players' involvement in tertiary care and the availability of skilled radiologists, shaping a strong outlook for the market and hence making India one of the fastest-growing countries for IR services.
The section contains information about the leading segments in the industry. Based on product, MRI systems are expected to account 30.5% of the global share in 2025.
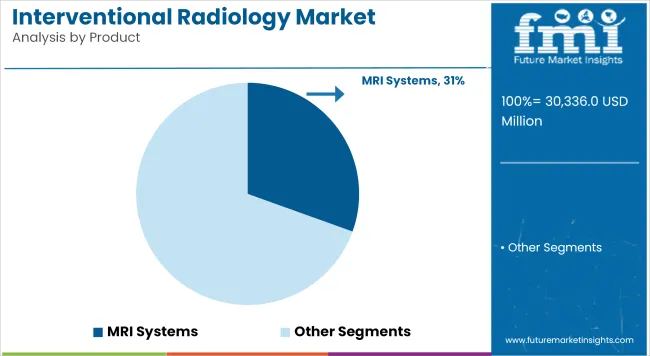
| Product | MRI Systems |
|---|---|
| Value Share (2025) | 30.5% |
MRI systems have the largest share in interventional radiology due to their excellent soft tissue contrast, use of non-ionizing radiation, and wide range of diagnostic applications. MRI is invariably superior in the imaging of the brain, spinal cord, musculoskeletal system, and abdominal viscera, hence an essential modality for both diagnostic as well as interventional procedures like MRI-guided biopsies and tumor ablations.
The company's leadership is further bolstered by the growing demand for non-invasive diagnostic techniques that provide better imaging quality. MRI systems are finding their place in oncology, where the clear delineation of tumor margins and vascular structures is imperative for staging purposes and in planning appropriate image-guided interventions.
Continuing technological development with 3T and open MRI systems has increased the market for MRI, as images are clearer and more patients, including claustrophobic and bariatric patients, can be scanned. Likewise, increasing utilization in neurological and cardiac imaging has made MRI the more established leader in interventional radiology.
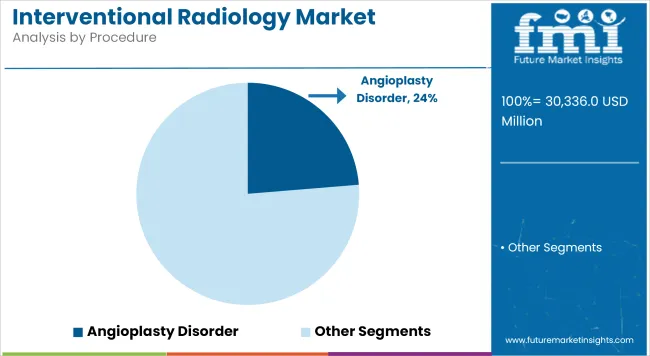
| By Procedure | Angioplasty Disorder |
|---|---|
| Value Share (2025) | 23.7% |
Angioplasty disorder will account for 23.7% of the indication segment in 2025, and exhibit the highest CAGR in the forecast period.
Angioplasty is one of the leading procedures in interventional radiology, as it is an important treatment for cardiovascular diseases, which are a major cause of illness and death worldwide. In this minimally invasive technique, a catheter is used to unblock blocked or restricted blood vessels, typically in the coronary arteries, and restore normal blood flow.
It is often used to treat problems such as atherosclerosis and heart attacks, reducing chest pain and preventing additional heart damage. The demand has increased owing to a rise in life style diseases such as obesity, diabetes and hypertension.
Technology advancements, providing drug-coated stent and now the bioabsorbable scaffold implantation advances the efficacy of the procedure and accessibility has increased the results. Increased accessibility and higher acceptance due to less recovery time and lesser risks are the merits over open-heart surgery. Angioplasty is hence being commonly applied mainly in case of peripheral artery diseases.
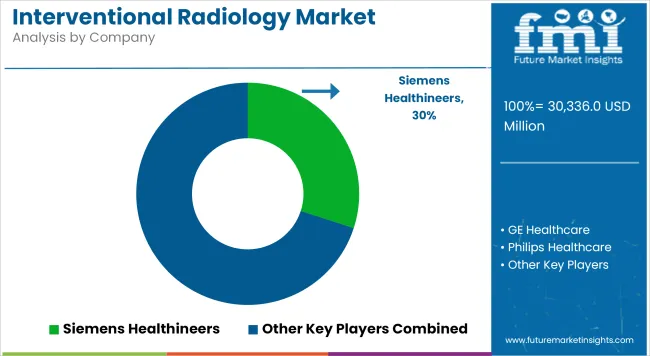
The interventional radiology market is highly competitive, with established leaders and emerging players vying for a larger market share. Industry giants are increasingly investing in advanced imaging technologies and minimally invasive tools to strengthen their positions, collaborating with new entrants who focus on disruptive innovations that challenge traditional methods. Significant resources are being dedicated to research and development aimed at advancing technologies like AI-enhanced imaging, robotic-assisted interventions, and hybrid operating room systems.
In terms of product, the industry is divided into MRI systems, CT scanners, ultrasound imaging systems, angiography systems and others.
In terms of procedure, the industry is divided into angioplasty, biopsy, embolization thrombolysis, vertebroplasty, nephrostomy, interventional oncology, msk intervention and others.
In terms of application, the industry is divided into cardiology, oncology, urology, gastroenterology, obstetrics, gynecology, and others.
In terms of end user, the industry is segregated into hospitals, clinics, ambulatory surgical centres, and others.
Key countries of North America, Latin America, East Asia, South Asia & Pacific, Western Europe, Eastern Europe, and Middle East and Africa (MEA) have been covered in the report.
The global interventional radiology industry is projected to witness CAGR of 5.2% between 2025 and 2035.
The global interventional radiology industry stood at USD 28,775.6 million in 2024.
The global interventional radiology industry is anticipated to reach USD 49,430.6 million by 2035 end.
China is expected to show a CAGR of 6.9% in the assessment period.
The key players operating in the global interventional radiology industry include Siemens Healthineers, GE Healthcare, Philips Healthcare, Canon Medical Systems, Hitachi Medical Corporation, Fujifilm Holdings Corporation, Hologic, Inc., Agfa-Gevaert Group, Mindray Medical International and United Imaging Healthcare


Our Research Products

The "Full Research Suite" delivers actionable market intel, deep dives on markets or technologies, so clients act faster, cut risk, and unlock growth.

The Leaderboard benchmarks and ranks top vendors, classifying them as Established Leaders, Leading Challengers, or Disruptors & Challengers.

Locates where complements amplify value and substitutes erode it, forecasting net impact by horizon

We deliver granular, decision-grade intel: market sizing, 5-year forecasts, pricing, adoption, usage, revenue, and operational KPIs—plus competitor tracking, regulation, and value chains—across 60 countries broadly.

Spot the shifts before they hit your P&L. We track inflection points, adoption curves, pricing moves, and ecosystem plays to show where demand is heading, why it is changing, and what to do next across high-growth markets and disruptive tech

Real-time reads of user behavior. We track shifting priorities, perceptions of today’s and next-gen services, and provider experience, then pace how fast tech moves from trial to adoption, blending buyer, consumer, and channel inputs with social signals (#WhySwitch, #UX).

Partner with our analyst team to build a custom report designed around your business priorities. From analysing market trends to assessing competitors or crafting bespoke datasets, we tailor insights to your needs.
Supplier Intelligence
Discovery & Profiling
Capacity & Footprint
Performance & Risk
Compliance & Governance
Commercial Readiness
Who Supplies Whom
Scorecards & Shortlists
Playbooks & Docs
Category Intelligence
Definition & Scope
Demand & Use Cases
Cost Drivers
Market Structure
Supply Chain Map
Trade & Policy
Operating Norms
Deliverables
Buyer Intelligence
Account Basics
Spend & Scope
Procurement Model
Vendor Requirements
Terms & Policies
Entry Strategy
Pain Points & Triggers
Outputs
Pricing Analysis
Benchmarks
Trends
Should-Cost
Indexation
Landed Cost
Commercial Terms
Deliverables
Brand Analysis
Positioning & Value Prop
Share & Presence
Customer Evidence
Go-to-Market
Digital & Reputation
Compliance & Trust
KPIs & Gaps
Outputs
Full Research Suite comprises of:
Market outlook & trends analysis
Interviews & case studies
Strategic recommendations
Vendor profiles & capabilities analysis
5-year forecasts
8 regions and 60+ country-level data splits
Market segment data splits
12 months of continuous data updates
DELIVERED AS:
PDF EXCEL ONLINE
Interventional Radiology Product Market Size and Share Forecast Outlook 2025 to 2035
Nonvascular Interventional Radiology Device Market Trends – Growth & Forecast 2024-2034
Interventional X - ray Systems Market Size and Share Forecast Outlook 2025 to 2035
Interventional Cardiology Devices Market Size and Share Forecast Outlook 2025 to 2035
Radiology Information System RIS Market Size and Share Forecast Outlook 2025 to 2035
AI Radiology Tool Market Insights – Growth, Demand & Forecast 2024-2034
Teleradiology Market Analysis - Size, Share, and Forecast Outlook 2025 to 2035
Teleradiology Services Market Growth - Trends & Forecast 2025 to 2035
Neurointerventional Device Market Analysis - Size, Share, and Forecast Outlook 2025 to 2035
Autonomous Radiology Systems Market Size and Share Forecast Outlook 2025 to 2035

Thank you!
You will receive an email from our Business Development Manager. Please be sure to check your SPAM/JUNK folder too.
Chat With
MaRIA