Isodecyl Citrate Market Forecast and Outlook 2025 to 2035

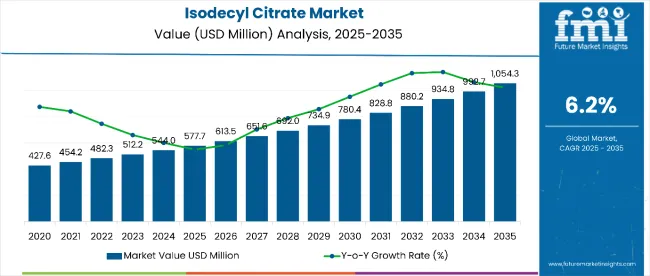
The isodecyl citrate market is estimated to be valued at USD 577.7 million in 2025. It is projected to reach USD 1,054.3 million by 2035, registering a compound annual growth rate (CAGR) of 6.2% over the forecast period.
Quick Stats for Isodecyl Citrate Market

  • Isodecyl Citrate Market Value (2025E): USD 577.7 million
  • Isodecyl Citrate Market Forecast Value (2035F): USD 1,054.3 million
  • Isodecyl Citrate Market Forecast CAGR: 6.2%
  • Leading Segment in Isodecyl Citrate Market in 2025: Natural type (40% market share)
  • Key Growth Regions in Isodecyl Citrate Market: North America, Asia Pacific, Europe
  • Top Key Players in Isodecyl Citrate Market: Univar Inc., Vertellus Holdings LLC, ALZO International Inc., PNR Impex, Independent Chemical Corporation, Dien Inc.

Isodecyl Citrate Market

Metric Value
Estimated Size (2025E) USD 577.7 million
Projected Value (2035F) USD 1,054.3 million
CAGR (2025 to 2035) 6.2%

The market is projected to add an absolute dollar opportunity of USD 476.6 million over the forecast period. This reflects a 1.80-times growth at a compound annual growth rate of 6.2%. The market’s evolution is expected to be shaped by rising demand for biodegradable and skin-friendly ingredients across cosmetics, personal care, food emulsifiers, and pharmaceutical formulations.

By 2030, the market is likely to reach approximately USD 780.4 million, accounting for USD 202.7 million in incremental value over the first half of the decade. The remaining USD 273.9 million is expected during the second half, indicating a back-loaded growth pattern, as the compound effect accelerates in the later years.

Companies such as Vertellus Holdings LLC, Dien Inc., Independent Chemical Corporation, Univar Inc., ALZO International, and PNR Impex are reinforcing their competitive positions through investments in eco-friendly sourcing and scalable synthesis processes. Clean-label certification strategies are driving adoption in cosmetic and personal care formulations. Market performance is expected to remain anchored in regulatory compliance, eco-friendliness, and formulation efficacy benchmarks.

The market holds a niche but growing share within its broader parent markets. It accounts for approximately 1.0% of the global plasticizer market, reflecting its role as a safer, biodegradable alternative to traditional plasticizers. In the personal care ingredients market, isodecyl citrate represents about 0.8%, driven by increasing demand for skin-friendly and natural cosmetic additives. Within the food emulsifier market, it captures roughly 0.5%, primarily due to its multifunctional properties and clean-label appeal. Smaller yet strategic shares exist in the specialty chemicals, cosmetic ingredients, and pharmaceutical excipients markets, where regulatory compliance and environmental considerations are increasingly prioritized.

The market is being propelled by increasing consumer demand for clean-label and biodegradable ingredients, particularly in skincare and personal care formulations where transparent ingredient sourcing is a competitive advantage. Regulatory frameworks are prompting ingredient substitution away from phthalates toward safer alternatives like isodecyl citrate. Innovations are being advanced via formulation technologies that enhance skin feel and stability. E-commerce proliferation is enabling niche brands to incorporate isodecyl citrate in eco-friendly product offerings, accelerating adoption.

Why is the Isodecyl Citrate Market Growing?

Isodecyl citrate’s biodegradable nature, skin-friendly profile, and multifunctional properties have positioned it as a preferred ingredient in cosmetics, personal care, and specialty chemical applications. Its ability to enhance product texture, stability, and sensory appeal is increasing its adoption among manufacturers seeking eco-friendly and high-performance formulation components.

Growing demand for clean-label and eco-friendly ingredients is driving uptake, particularly in skincare, haircare, and premium personal care products. Regulatory shifts encouraging the replacement of synthetic plasticizers with safer alternatives are further increasing its relevance.

As consumer awareness of environmentally responsible products rises and formulation innovation continues to evolve, isodecyl citrate is expected to achieve wider penetration across cosmetics, personal care, and specialty formulation markets. This momentum is being supported by advancements in green chemistry, supply chain transparency, and performance-oriented product development.

Segmental Analysis

The market is segmented by type, application, distribution channel, and region. By type, the market is divided into natural, synthetic and organic. Based on application, the market is segmented into personal care products and beauty. In terms of distribution channel, the market is bifurcated into offline and online. Regionally, the market is classified into North America, Europe, Asia-Pacific, Latin America, Japan and the Middle East & Africa.
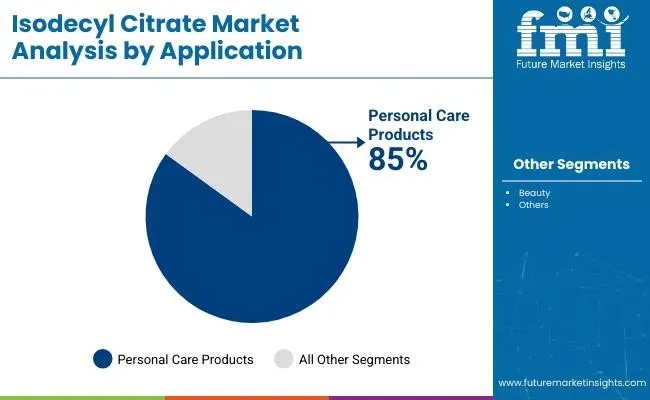
By Application, Personal Care Products Segment Accounts for 85% of the Market Share

Isodecyl Citrate Market By Application

The personal care products segment holds a commanding 85% share within the application category, supported by increasing consumer preference for eco-friendly, skin-friendly, and multifunctional cosmetic ingredients. Isodecyl citrate’s emollient and stabilizing properties make it highly suitable for skincare creams, lotions, hair conditioners, and premium beauty formulations, where both performance and safety are critical.

Its role in enhancing product texture, improving spreadability, and delivering a smooth skin feel has encouraged widespread adoption by leading cosmetic brands. This segment has benefited from the surge in clean-label product demand, where synthetic additives are being replaced with biodegradable and dermatologically tested alternatives.

In addition, regulatory trends discouraging the use of phthalates and non-biodegradable agents have created additional opportunities for isodecyl citrate in high-end personal care lines. As consumer awareness of eco-friendly products intensifies and e-commerce platforms expand access to premium beauty products, this segment is expected to sustain strong growth over the forecast period.
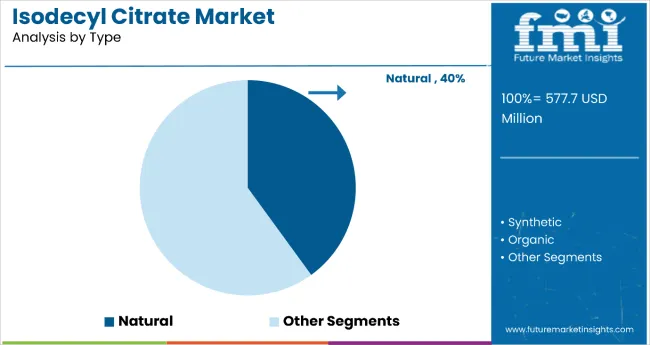
By Type, Natural Segment Accounts for 40% of the Market Share

Isodecyl Citrate Market By Type

The natural type segment accounts for 40% of the market share in the type category, fueled by the global shift toward plant-derived and naturally sourced cosmetic ingredients. Formulated using bio-based feedstocks, natural isodecyl citrate appeals to both manufacturers and end consumers seeking eco-friendly, ethically produced, and high-purity raw materials.

Its low environmental impact and compliance with green-certification programs have accelerated its adoption in personal care and pharmaceutical formulations. In premium cosmetics, the natural variant is valued for maintaining consistent performance while aligning with environmental and ethical standards, making it an attractive choice for eco-conscious brands.

The segment’s momentum is reinforced by advances in green chemistry, which have improved production efficiency and reduced costs, thereby broadening accessibility. As global sustainability regulations become stricter and consumer trust in plant-based ingredients strengthens, the natural segment is positioned to capture a growing share of both established and emerging application areas.

What are the Drivers, Restraints, and Key Trends of the Isodecyl Citrate Market?

The isodecyl citrate market has been expanding steadily due to growing demand for environmentally friendly and biodegradable plasticizers and cosmetic ingredients. Increasing consumer preference for clean-label, non-toxic, and skin-safe components in personal care products has driven widespread adoption. Applications in premium skincare, haircare, and specialty pharmaceuticals have been prioritized due to isodecyl citrate’s emollient properties and compatibility with natural formulations. Moreover, stringent environmental regulations limiting phthalate usage have compelled manufacturers to switch to safer alternatives, further accelerating market growth. Technological innovations in green chemistry and eco-conscious synthesis methods have enhanced the availability and cost-effectiveness of isodecyl citrate, supporting broader application development.

Sustainability and Regulatory Frameworks Drive Market Growth

Awareness regarding ecological impact and human health has propelled the adoption of plant-based and biodegradable plasticizers like isodecyl citrate. Regulatory frameworks across North America, Europe, and Asia-Pacific, such as REACH and EPA guidelines, are encouraging the phase-out of hazardous chemicals. Additionally, advancements in formulation science have improved product stability and skin compatibility, making isodecyl citrate an attractive option for formulators. E-commerce expansion has enabled niche and indie brands to access high-performance natural ingredients, increasing market penetration and innovation in personal care products.

Challenges in Production and Cost Constraints Limit Market Expansion

Despite promising growth, the isodecyl citrate market faces restraints linked to high raw material costs and complex production processes that require specialized equipment and regulatory compliance. Volatility in natural feedstock availability can lead to supply chain disruptions, impacting pricing stability. Furthermore, stringent quality and safety standards necessitate extended product development cycles and increased investment in certification, raising barriers for new entrants. Market adoption in price-sensitive regions remains limited, as alternatives with lower upfront costs are still preferred despite environmental concerns. Addressing these constraints through innovation and scaling production efficiency will be critical for sustained growth.
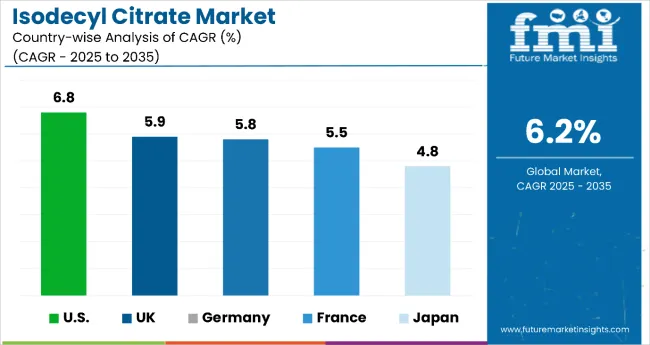
Isodecyl Citrate Market Analysis by Top Countries

Isodecyl Citrate Market By Country

Countries CAGR (2025 to 2035)
United States 6.8%
United Kingdom 5.9%
Germany 5.8%
France 5.5%
Japan 4.8%

The isodecyl citrate market growth rates vary among the top five countries, with the USA leading at a CAGR of 6.8% from 2025 to 2035. The UK and Germany follow closely at 5.9% and 5.8% respectively, while France and Japan exhibit more moderate growth rates of 5.5% and 4.8%. These variations reflect differences in regulatory environments, consumer awareness of eco-friendly ingredients, and industry maturity. North America, driven by innovation and regulatory push, maintains a robust pace, whereas Europe’s growth is supported by stringent eco-friendly standards. Japan’s moderate growth is influenced by high-quality product demand and slower adoption of new formulations.

The report covers an in-depth analysis of 40+ countries; five top-performing OECD countries are highlighted below.

Market Expansion in the Isodecyl Citrate Market in the United States

The demand for isodecyl citrate in the USA is anticipated to strengthen at a CAGR of 6.8% from 2025 to 2035, outpacing the global average. Growth is driven by strong demand in personal care formulations, emphasizing biodegradable and non-toxic ingredients. Major urban markets such as California, New York, and Texas lead adoption, supported by increasing consumer preference for clean-label cosmetics. Investments in green synthesis technologies and supply chain transparency are reinforcing market expansion. The USA regulatory framework encouraging phthalate replacements further accelerates isodecyl citrate adoption in cosmetic and specialty chemical industries.

Key Statistics

  • Increasing clean-label cosmetic launches with isodecyl citrate as a key ingredient
  • 65% of personal care product formulations incorporating biodegradable plasticizers by 2025
  • $180 million invested in eco-friendly ingredient R&D in 2024

Innovation Leadership in Isodecyl Citrate Market in the United Kingdom

The isodecyl citrate market in the UK is expected to flourish at a CAGR of 5.9% from 2025 to 2035, slightly below the USA pace. Growth is focused on personal care products with eco-certified ingredients and premium formulations. London, Manchester, and Birmingham serve as innovation hubs, where brands emphasize sustainability and dermatological safety. Brexit-related supply adjustments have introduced some challenges but have also spurred domestic innovation. Regulatory support for phthalate alternatives strengthens the market outlook. Niche indie brands and online platforms are important drivers in increasing consumer awareness and demand.

Key Statistics

  • 55% growth in eco-friendly cosmetic product launches between 2025 and 2030
  • 48% of UK personal care products formulated with natural or biodegradable plasticizers
  • 120 specialty ingredient manufacturers active in green chemistry by 2024

Market Development in the Isodecyl Citrate Market in Germany

The revenue from isodecyl citrate in Germany is projected to rise at a CAGR of 5.8% from 2025 to 2035, supported by stringent EU regulations and consumer eco-consciousness. Frankfurt, Munich, and Hamburg are key regional centers of growth, where clean-label product development and functional cosmetic innovations thrive. German manufacturers prioritize high-purity and sustainability certifications, aligning with European chemical safety standards. Collaborative efforts between chemical producers and cosmetic formulators facilitate technology advancements. The market benefits from robust industrial infrastructure and growing demand for safe plasticizers in both personal care and specialty chemical applications.

Key Statistics

  • 70% of isodecyl citrate in Germany is supplied to personal care manufacturers by 2025
  • Over 30% increase in certified green chemistry product launches during 2024-2028
  • Investments exceeding €75 million in eco-friendly ingredient production facilities in 2024

Growth Assessment for Isodecyl Citrate Market in France

The sales of isodecyl citrate in France are estimated to expand at a CAGR of 5.5% from 2025 to 2035, slightly trailing Germany and the UK. Paris, Lyon, and Marseille are key markets emphasizing premium cosmetics and specialty personal care products. French consumer preference for natural and eco-friendly ingredients supports growth, alongside robust regulatory compliance with EU and national guidelines. Growth is propelled by artisan cosmetic brands and luxury product lines integrating biodegradable plasticizers like isodecyl citrate. The market remains influenced by evolving consumer trends toward health-conscious and eco-friendly beauty products.

Key Statistics

  • 40% of French personal care products are expected to include biodegradable plasticizers by 2030
  • 25% growth in artisan and luxury cosmetic product launches incorporating isodecyl citrate
  • €40 million allocated to eco-friendly ingredient research and development in 2024

Isodecyl Citrate Market Growth Analysis in Japan

The isodecyl citrate market in Japan is projected to grow at a CAGR of 4.8% from 2025 to 2035, reflecting a more conservative but steady pace. Tokyo, Osaka, and Kyoto lead the demand for high-purity, dermatologically tested cosmetic ingredients. The market is driven by aging demographics and preference for hypoallergenic and skin-friendly formulations. While innovation in green chemistry is present, adoption of new biodegradable plasticizers is slower compared to Western markets due to stringent quality expectations and cautious consumer behavior. Nonetheless, demand for clean-label and natural products is gradually increasing, with e-commerce enabling broader product availability.

Key Statistics
  • 30% of Japanese personal care formulations projected to contain biodegradable plasticizers by 2030
  • 15% annual increase in dermatologically tested green cosmetic product launches from 2025
  • $50 million invested in R&D for hypoallergenic and eco-friendly ingredients in 2024

Competitive Landscape of Isodecyl Citrate Market

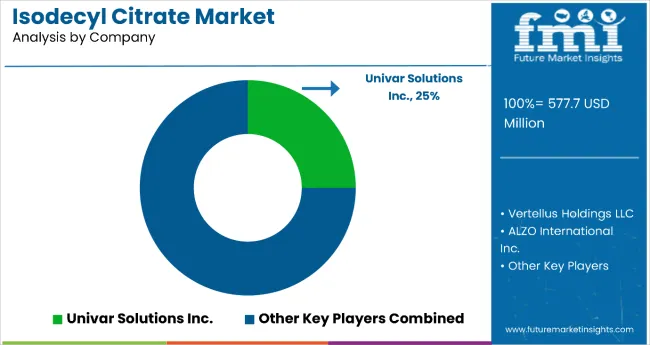
Isodecyl Citrate Market By Company

The isodecyl citrate market is moderately consolidated, comprising global chemical manufacturers, specialty ingredient producers, and regional suppliers with varied capabilities in eco-conscious synthesis and formulation expertise. Vertellus Holdings LLC and Dien Inc. are key international players, leveraging advanced green chemistry processes and extensive distribution networks to serve personal care, pharmaceutical, and specialty chemical industries. Their competitive advantage stems from scalable production capacities and strong regulatory compliance aligned with international environmental standards.

Mid-sized companies such as Independent Chemical Corporation and ALZO International differentiate through customized formulation support and specialty product lines focusing on natural and biodegradable plasticizers. These companies emphasize eco-certifications, product purity, and technical collaboration with cosmetic and pharmaceutical formulators, facilitating innovation in skin-friendly and multifunctional ingredients. Regional players, including PNR Impex and selected Asia-Pacific manufacturers, focus on cost-effective sourcing and localized supply chain solutions to penetrate emerging markets.

Barriers to entry remain substantial due to complex synthesis technology, feedstock sourcing challenges, and stringent regulatory frameworks governing ingredient safety and environmental impact. Competitive success increasingly depends on process innovation to reduce production costs, green chemistry certifications, and the ability to develop application-specific formulations that meet evolving consumer demands for sustainability and product performance. Strategic partnerships and investment in research and development are key drivers shaping the competitive landscape of the isodecyl citrate market.

Scope of Report

Item Value
Quantitative Units USD 577.7 Million
Type Synthetic, Natural, Organic
Application Personal Care Products, Beauty
Distribution Channel Online and Offline
Regions Covered North America, Europe, Asia-Pacific, Latin America, Middle East & Africa , Japan
Countries Covered United States, Canada, United Kingdom, Germany, France, China, Japan, South Korea, Brazil, Australia and 40+ countries
Key Companies Profiled Univar Inc., Vertellus Holdings LLC, ALZO International Inc., PNR Impex, Independent Chemical Corporation, Dien Inc.
Additional Attributes Dollar sales by application and purity grade, regional demand trends, competitive landscape, consumer preferences for natural versus synthetic alternatives, integration with eco-friendly sourcing practices, innovations in extraction technology and quality standardization for diverse industrial applications

Key Segments

By Type:

  • Synthetic
  • Natural
  • Organic

By Application:

  • Beauty
  • Personal Care Products

By distribution channel:

  • Online
  • Offline

By region:

  • North America
  • Latin America
  • Western Europe
  • Eastern Europe
  • East Asia
  • South Asia & Pacific
  • Middle East and Africa

Table of Content

  1. Executive Summary
    • Global Market Outlook
    • Demand-side Trends
    • Supply-side Trends
    • Technology Roadmap Analysis
    • Analysis and Recommendations
  2. Market Overview
    • Market Coverage / Taxonomy
    • Market Definition / Scope / Limitations
  3. Market Background
    • Market Dynamics
      • Drivers
      • Restraints
      • Opportunity
      • Trends
    • Scenario Forecast
      • Demand in Optimistic Scenario
      • Demand in Likely Scenario
      • Demand in Conservative Scenario
    • Opportunity Map Analysis
    • Product Life Cycle Analysis
    • Supply Chain Analysis
      • Supply Side Participants and their Roles
        • Producers
        • Mid-Level Participants (Traders/ Agents/ Brokers)
        • Wholesalers and Distributors
      • Value Added and Value Created at Node in the Supply Chain
      • List of Raw Material Suppliers
      • List of Existing and Potential Buyer’s
    • Investment Feasibility Matrix
    • Value Chain Analysis
      • Profit Margin Analysis
      • Wholesalers and Distributors
      • Retailers
    • PESTLE and Porter’s Analysis
    • Regulatory Landscape
      • By Key Regions
      • By Key Countries
    • Regional Parent Market Outlook
    • Production and Consumption Statistics
    • Import and Export Statistics
  4. Global Market Analysis 2020 to 2024 and Forecast, 2025 to 2035
    • Historical Market Size Value (USD Million) & Volume (Metric Tons) Analysis, 2020 to 2024
    • Current and Future Market Size Value (USD Million) & Volume (Metric Tons) Projections, 2025 to 2035
      • Y-o-Y Growth Trend Analysis
      • Absolute $ Opportunity Analysis
  5. Global Market Pricing Analysis 2020 to 2024 and Forecast 2025 to 2035
  6. Global Market Analysis 2020 to 2024 and Forecast 2025 to 2035, By Type
    • Introduction / Key Findings
    • Historical Market Size Value (USD Million) & Volume (Metric Tons) Analysis By Type, 2020 to 2024
    • Current and Future Market Size Value (USD Million) & Volume (Metric Tons) Analysis and Forecast By Type, 2025 to 2035
      • Synthetic
      • Natural
      • Organic
    • Y-o-Y Growth Trend Analysis By Type, 2020 to 2024
    • Absolute $ Opportunity Analysis By Type, 2025 to 2035
  7. Global Market Analysis 2020 to 2024 and Forecast 2025 to 2035, By Application
    • Introduction / Key Findings
    • Historical Market Size Value (USD Million) & Volume (Metric Tons) Analysis By Application, 2020 to 2024
    • Current and Future Market Size Value (USD Million) & Volume (Metric Tons) Analysis and Forecast By Application, 2025 to 2035
      • Beauty
      • Personal Care Products
    • Y-o-Y Growth Trend Analysis By Application, 2020 to 2024
    • Absolute $ Opportunity Analysis By Application, 2025 to 2035
  8. Global Market Analysis 2020 to 2024 and Forecast 2025 to 2035, By Distribution Channel
    • Introduction / Key Findings
    • Historical Market Size Value (USD Million) & Volume (Metric Tons) Analysis By Distribution Channel, 2020 to 2024
    • Current and Future Market Size Value (USD Million) & Volume (Metric Tons) Analysis and Forecast By Distribution Channel, 2025 to 2035
      • Online
      • Offline
    • Y-o-Y Growth Trend Analysis By Distribution Channel, 2020 to 2024
    • Absolute $ Opportunity Analysis By Distribution Channel, 2025 to 2035
  9. Global Market Analysis 2020 to 2024 and Forecast 2025 to 2035, By Region
    • Introduction
    • Historical Market Size Value (USD Million) & Volume (Metric Tons) Analysis By Region, 2020 to 2024
    • Current Market Size Value (USD Million) & Volume (Metric Tons) Analysis and Forecast By Region, 2025 to 2035
      • North America
      • Latin America
      • Western Europe
      • Eastern Europe
      • East Asia
      • South Asia & Pacific
      • Middle East and Africa
    • Market Attractiveness Analysis By Region
  10. North America Market Analysis 2020 to 2024 and Forecast 2025 to 2035, By Country
    • Historical Market Size Value (USD Million) & Volume (Metric Tons) Trend Analysis By Market Taxonomy, 2020 to 2024
    • Market Size Value (USD Million) & Volume (Metric Tons) Forecast By Market Taxonomy, 2025 to 2035
      • By Country
        • USA
        • Canada
        • Mexico
      • By Type
      • By Application
      • By Distribution Channel
    • Market Attractiveness Analysis
      • By Country
      • By Type
      • By Application
      • By Distribution Channel
    • Key Takeaways
  11. Latin America Market Analysis 2020 to 2024 and Forecast 2025 to 2035, By Country
    • Historical Market Size Value (USD Million) & Volume (Metric Tons) Trend Analysis By Market Taxonomy, 2020 to 2024
    • Market Size Value (USD Million) & Volume (Metric Tons) Forecast By Market Taxonomy, 2025 to 2035
      • By Country
        • Brazil
        • Argentina
        • Rest of LATAM
      • By Type
      • By Application
      • By Distribution Channel
    • Market Attractiveness Analysis
      • By Country
      • By Type
      • By Application
      • By Distribution Channel
    • Key Takeaways
  12. Western Europe Market Analysis 2020 to 2024 and Forecast 2025 to 2035, By Country
    • Historical Market Size Value (USD Million) & Volume (Metric Tons) Trend Analysis By Market Taxonomy, 2020 to 2024
    • Market Size Value (USD Million) & Volume (Metric Tons) Forecast By Market Taxonomy, 2025 to 2035
      • By Country
        • Germany
        • Italy
        • France
        • UK
        • Spain
        • BENELUX
        • Nordic
        • Rest of W.Europe
      • By Type
      • By Application
      • By Distribution Channel
    • Market Attractiveness Analysis
      • By Country
      • By Type
      • By Application
      • By Distribution Channel
    • Key Takeaways
  13. Eastern Europe Market Analysis 2020 to 2024 and Forecast 2025 to 2035, By Country
    • Historical Market Size Value (USD Million) & Volume (Metric Tons) Trend Analysis By Market Taxonomy, 2020 to 2024
    • Market Size Value (USD Million) & Volume (Metric Tons) Forecast By Market Taxonomy, 2025 to 2035
      • By Country
        • Russia
        • Hungary
        • Poland
        • Balkan & Baltics
        • Rest of E. Europe
      • By Type
      • By Application
      • By Distribution Channel
    • Market Attractiveness Analysis
      • By Country
      • By Type
      • By Application
      • By Distribution Channel
    • Key Takeaways
  14. East Asia Market Analysis 2020 to 2024 and Forecast 2025 to 2035, By Country
    • Historical Market Size Value (USD Million) & Volume (Metric Tons) Trend Analysis By Market Taxonomy, 2020 to 2024
    • Market Size Value (USD Million) & Volume (Metric Tons) Forecast By Market Taxonomy, 2025 to 2035
      • By Country
        • China
        • Japan
        • South Korea
      • By Type
      • By Application
      • By Distribution Channel
    • Market Attractiveness Analysis
      • By Country
      • By Type
      • By Application
      • By Distribution Channel
    • Key Takeaways
  15. South Asia & Pacific Market Analysis 2020 to 2024 and Forecast 2025 to 2035, By Country
    • Historical Market Size Value (USD Million) & Volume (Metric Tons) Trend Analysis By Market Taxonomy, 2020 to 2024
    • Market Size Value (USD Million) & Volume (Metric Tons) Forecast By Market Taxonomy, 2025 to 2035
      • By Country
        • India
        • Australia & New Zealand
        • ASEAN
        • Rest of SAP
      • By Type
      • By Application
      • By Distribution Channel
    • Market Attractiveness Analysis
      • By Country
      • By Type
      • By Application
      • By Distribution Channel
    • Key Takeaways
  16. Middle East and Africa Market Analysis 2020 to 2024 and Forecast 2025 to 2035, By Country
    • Historical Market Size Value (USD Million) & Volume (Metric Tons) Trend Analysis By Market Taxonomy, 2020 to 2024
    • Market Size Value (USD Million) & Volume (Metric Tons) Forecast By Market Taxonomy, 2025 to 2035
      • By Country
        • GCC Countries
        • Northern Africa
        • South Africa
        • Turkiye
        • Rest of MEA
      • By Type
      • By Application
      • By Distribution Channel
    • Market Attractiveness Analysis
      • By Country
      • By Type
      • By Application
      • By Distribution Channel
    • Key Takeaways
  17. Key Countries Market Analysis
    • USA
      • Pricing Analysis
      • Market Share Analysis, 2024
        • By Type
        • By Application
        • By Distribution Channel
    • Canada
      • Pricing Analysis
      • Market Share Analysis, 2024
        • By Type
        • By Application
        • By Distribution Channel
    • Brazil
      • Pricing Analysis
      • Market Share Analysis, 2024
        • By Type
        • By Application
        • By Distribution Channel
    • Mexico
      • Pricing Analysis
      • Market Share Analysis, 2024
        • By Type
        • By Application
        • By Distribution Channel
    • Argentina
      • Pricing Analysis
      • Market Share Analysis, 2024
        • By Type
        • By Application
        • By Distribution Channel
  18. Market Structure Analysis
    • Competition Dashboard
    • Competition Benchmarking
    • Market Share Analysis of Top Players
      • By Regional
      • By Type
      • By Application
      • By Distribution Channel
  19. Competition Analysis
    • Competition Deep Dive
      • Univar Inc.
        • Overview
        • Product Portfolio
        • Profitability by Market Segments (Product/Age /Sales Channel/Region)
        • Sales Footprint
        • Strategy Overview
          • Marketing Strategy
          • Product Strategy
          • Channel Strategy
      • Vertellus Holdings LLC
        • Overview
        • Product Portfolio
        • Profitability by Market Segments (Product/Age /Sales Channel/Region)
        • Sales Footprint
        • Strategy Overview
          • Marketing Strategy
          • Product Strategy
          • Channel Strategy
      • ALZO International Inc’
        • Overview
        • Product Portfolio
        • Profitability by Market Segments (Product/Age /Sales Channel/Region)
        • Sales Footprint
        • Strategy Overview
          • Marketing Strategy
          • Product Strategy
          • Channel Strategy
      • PNR Impex
        • Overview
        • Product Portfolio
        • Profitability by Market Segments (Product/Age /Sales Channel/Region)
        • Sales Footprint
        • Strategy Overview
          • Marketing Strategy
          • Product Strategy
          • Channel Strategy
      • Independent Chemical Corporation
        • Overview
        • Product Portfolio
        • Profitability by Market Segments (Product/Age /Sales Channel/Region)
        • Sales Footprint
        • Strategy Overview
          • Marketing Strategy
          • Product Strategy
          • Channel Strategy
      • PNR Impex
        • Overview
        • Product Portfolio
        • Profitability by Market Segments (Product/Age /Sales Channel/Region)
        • Sales Footprint
        • Strategy Overview
          • Marketing Strategy
          • Product Strategy
          • Channel Strategy
      • Dien Inc
        • Overview
        • Product Portfolio
        • Profitability by Market Segments (Product/Age /Sales Channel/Region)
        • Sales Footprint
        • Strategy Overview
          • Marketing Strategy
          • Product Strategy
          • Channel Strategy
  20. Assumptions & Acronyms Used
  21. Research Methodology

List of Tables

  • Table 1: Global Market Value (USD Million) Forecast by Region, 2020-2035
  • Table 2: Global Market Volume (Metric Tons) Forecast by Region, 2020-2035
  • Table 3: Global Market Value (USD Million) Forecast by Type, 2020-2035
  • Table 4: Global Market Volume (Metric Tons) Forecast by Type, 2020-2035
  • Table 5: Global Market Value (USD Million) Forecast by Application, 2020-2035
  • Table 6: Global Market Volume (Metric Tons) Forecast by Application, 2020-2035
  • Table 7: Global Market Value (USD Million) Forecast by Distribution Channel, 2020-2035
  • Table 8: Global Market Volume (Metric Tons) Forecast by Distribution Channel, 2020-2035
  • Table 9: North America Market Value (USD Million) Forecast by Country, 2020-2035
  • Table 10: North America Market Volume (Metric Tons) Forecast by Country, 2020-2035
  • Table 11: North America Market Value (USD Million) Forecast by Type, 2020-2035
  • Table 12: North America Market Volume (Metric Tons) Forecast by Type, 2020-2035
  • Table 13: North America Market Value (USD Million) Forecast by Application, 2020-2035
  • Table 14: North America Market Volume (Metric Tons) Forecast by Application, 2020-2035
  • Table 15: North America Market Value (USD Million) Forecast by Distribution Channel, 2020-2035
  • Table 16: North America Market Volume (Metric Tons) Forecast by Distribution Channel, 2020-2035
  • Table 17: Latin America Market Value (USD Million) Forecast by Country, 2020-2035
  • Table 18: Latin America Market Volume (Metric Tons) Forecast by Country, 2020-2035
  • Table 19: Latin America Market Value (USD Million) Forecast by Type, 2020-2035
  • Table 20: Latin America Market Volume (Metric Tons) Forecast by Type, 2020-2035
  • Table 21: Latin America Market Value (USD Million) Forecast by Application, 2020-2035
  • Table 22: Latin America Market Volume (Metric Tons) Forecast by Application, 2020-2035
  • Table 23: Latin America Market Value (USD Million) Forecast by Distribution Channel, 2020-2035
  • Table 24: Latin America Market Volume (Metric Tons) Forecast by Distribution Channel, 2020-2035
  • Table 25: Western Europe Market Value (USD Million) Forecast by Country, 2020-2035
  • Table 26: Western Europe Market Volume (Metric Tons) Forecast by Country, 2020-2035
  • Table 27: Western Europe Market Value (USD Million) Forecast by Type, 2020-2035
  • Table 28: Western Europe Market Volume (Metric Tons) Forecast by Type, 2020-2035
  • Table 29: Western Europe Market Value (USD Million) Forecast by Application, 2020-2035
  • Table 30: Western Europe Market Volume (Metric Tons) Forecast by Application, 2020-2035
  • Table 31: Western Europe Market Value (USD Million) Forecast by Distribution Channel, 2020-2035
  • Table 32: Western Europe Market Volume (Metric Tons) Forecast by Distribution Channel, 2020-2035
  • Table 33: Eastern Europe Market Value (USD Million) Forecast by Country, 2020-2035
  • Table 34: Eastern Europe Market Volume (Metric Tons) Forecast by Country, 2020-2035
  • Table 35: Eastern Europe Market Value (USD Million) Forecast by Type, 2020-2035
  • Table 36: Eastern Europe Market Volume (Metric Tons) Forecast by Type, 2020-2035
  • Table 37: Eastern Europe Market Value (USD Million) Forecast by Application, 2020-2035
  • Table 38: Eastern Europe Market Volume (Metric Tons) Forecast by Application, 2020-2035
  • Table 39: Eastern Europe Market Value (USD Million) Forecast by Distribution Channel, 2020-2035
  • Table 40: Eastern Europe Market Volume (Metric Tons) Forecast by Distribution Channel, 2020-2035
  • Table 41: East Asia Market Value (USD Million) Forecast by Country, 2020-2035
  • Table 42: East Asia Market Volume (Metric Tons) Forecast by Country, 2020-2035
  • Table 43: East Asia Market Value (USD Million) Forecast by Type, 2020-2035
  • Table 44: East Asia Market Volume (Metric Tons) Forecast by Type, 2020-2035
  • Table 45: East Asia Market Value (USD Million) Forecast by Application, 2020-2035
  • Table 46: East Asia Market Volume (Metric Tons) Forecast by Application, 2020-2035
  • Table 47: East Asia Market Value (USD Million) Forecast by Distribution Channel, 2020-2035
  • Table 48: East Asia Market Volume (Metric Tons) Forecast by Distribution Channel, 2020-2035
  • Table 49: South Asia & Pacific Market Value (USD Million) Forecast by Country, 2020-2035
  • Table 50: South Asia & Pacific Market Volume (Metric Tons) Forecast by Country, 2020-2035
  • Table 51: South Asia & Pacific Market Value (USD Million) Forecast by Type, 2020-2035
  • Table 52: South Asia & Pacific Market Volume (Metric Tons) Forecast by Type, 2020-2035
  • Table 53: South Asia & Pacific Market Value (USD Million) Forecast by Application, 2020-2035
  • Table 54: South Asia & Pacific Market Volume (Metric Tons) Forecast by Application, 2020-2035
  • Table 55: South Asia & Pacific Market Value (USD Million) Forecast by Distribution Channel, 2020-2035
  • Table 56: South Asia & Pacific Market Volume (Metric Tons) Forecast by Distribution Channel, 2020-2035
  • Table 57: Middle East and Africa Market Value (USD Million) Forecast by Country, 2020-2035
  • Table 58: Middle East and Africa Market Volume (Metric Tons) Forecast by Country, 2020-2035
  • Table 59: Middle East and Africa Market Value (USD Million) Forecast by Type, 2020-2035
  • Table 60: Middle East and Africa Market Volume (Metric Tons) Forecast by Type, 2020-2035
  • Table 61: Middle East and Africa Market Value (USD Million) Forecast by Application, 2020-2035
  • Table 62: Middle East and Africa Market Volume (Metric Tons) Forecast by Application, 2020-2035
  • Table 63: Middle East and Africa Market Value (USD Million) Forecast by Distribution Channel, 2020-2035
  • Table 64: Middle East and Africa Market Volume (Metric Tons) Forecast by Distribution Channel, 2020-2035

List of Figures

  • Figure 1: Global Market Volume (Metric Tons) Forecast 2020-2035
  • Figure 2: Global Market Pricing Analysis
  • Figure 3: Global Market Value (USD Million) Forecast 2020-2035
  • Figure 4: Global Market Value Share and BPS Analysis by Type, 2025 and 2035
  • Figure 5: Global Market Y-o-Y Growth Comparison by Type, 2025-2035
  • Figure 6: Global Market Attractiveness Analysis by Type
  • Figure 7: Global Market Value Share and BPS Analysis by Application, 2025 and 2035
  • Figure 8: Global Market Y-o-Y Growth Comparison by Application, 2025-2035
  • Figure 9: Global Market Attractiveness Analysis by Application
  • Figure 10: Global Market Value Share and BPS Analysis by Distribution Channel, 2025 and 2035
  • Figure 11: Global Market Y-o-Y Growth Comparison by Distribution Channel, 2025-2035
  • Figure 12: Global Market Attractiveness Analysis by Distribution Channel
  • Figure 13: Global Market Value (USD Million) Share and BPS Analysis by Region, 2025 and 2035
  • Figure 14: Global Market Y-o-Y Growth Comparison by Region, 2025-2035
  • Figure 15: Global Market Attractiveness Analysis by Region
  • Figure 16: North America Market Incremental $ Opportunity, 2025-2035
  • Figure 17: Latin America Market Incremental $ Opportunity, 2025-2035
  • Figure 18: Western Europe Market Incremental $ Opportunity, 2025-2035
  • Figure 19: Eastern Europe Market Incremental $ Opportunity, 2025-2035
  • Figure 20: East Asia Market Incremental $ Opportunity, 2025-2035
  • Figure 21: South Asia & Pacific Market Incremental $ Opportunity, 2025-2035
  • Figure 22: Middle East and Africa Market Incremental $ Opportunity, 2025-2035
  • Figure 23: North America Market Value Share and BPS Analysis by Country, 2025 and 2035
  • Figure 24: North America Market Value Share and BPS Analysis by Type, 2025 and 2035
  • Figure 25: North America Market Y-o-Y Growth Comparison by Type, 2025-2035
  • Figure 26: North America Market Attractiveness Analysis by Type
  • Figure 27: North America Market Value Share and BPS Analysis by Application, 2025 and 2035
  • Figure 28: North America Market Y-o-Y Growth Comparison by Application, 2025-2035
  • Figure 29: North America Market Attractiveness Analysis by Application
  • Figure 30: North America Market Value Share and BPS Analysis by Distribution Channel, 2025 and 2035
  • Figure 31: North America Market Y-o-Y Growth Comparison by Distribution Channel, 2025-2035
  • Figure 32: North America Market Attractiveness Analysis by Distribution Channel
  • Figure 33: Latin America Market Value Share and BPS Analysis by Country, 2025 and 2035
  • Figure 34: Latin America Market Value Share and BPS Analysis by Type, 2025 and 2035
  • Figure 35: Latin America Market Y-o-Y Growth Comparison by Type, 2025-2035
  • Figure 36: Latin America Market Attractiveness Analysis by Type
  • Figure 37: Latin America Market Value Share and BPS Analysis by Application, 2025 and 2035
  • Figure 38: Latin America Market Y-o-Y Growth Comparison by Application, 2025-2035
  • Figure 39: Latin America Market Attractiveness Analysis by Application
  • Figure 40: Latin America Market Value Share and BPS Analysis by Distribution Channel, 2025 and 2035
  • Figure 41: Latin America Market Y-o-Y Growth Comparison by Distribution Channel, 2025-2035
  • Figure 42: Latin America Market Attractiveness Analysis by Distribution Channel
  • Figure 43: Western Europe Market Value Share and BPS Analysis by Country, 2025 and 2035
  • Figure 44: Western Europe Market Value Share and BPS Analysis by Type, 2025 and 2035
  • Figure 45: Western Europe Market Y-o-Y Growth Comparison by Type, 2025-2035
  • Figure 46: Western Europe Market Attractiveness Analysis by Type
  • Figure 47: Western Europe Market Value Share and BPS Analysis by Application, 2025 and 2035
  • Figure 48: Western Europe Market Y-o-Y Growth Comparison by Application, 2025-2035
  • Figure 49: Western Europe Market Attractiveness Analysis by Application
  • Figure 50: Western Europe Market Value Share and BPS Analysis by Distribution Channel, 2025 and 2035
  • Figure 51: Western Europe Market Y-o-Y Growth Comparison by Distribution Channel, 2025-2035
  • Figure 52: Western Europe Market Attractiveness Analysis by Distribution Channel
  • Figure 53: Eastern Europe Market Value Share and BPS Analysis by Country, 2025 and 2035
  • Figure 54: Eastern Europe Market Value Share and BPS Analysis by Type, 2025 and 2035
  • Figure 55: Eastern Europe Market Y-o-Y Growth Comparison by Type, 2025-2035
  • Figure 56: Eastern Europe Market Attractiveness Analysis by Type
  • Figure 57: Eastern Europe Market Value Share and BPS Analysis by Application, 2025 and 2035
  • Figure 58: Eastern Europe Market Y-o-Y Growth Comparison by Application, 2025-2035
  • Figure 59: Eastern Europe Market Attractiveness Analysis by Application
  • Figure 60: Eastern Europe Market Value Share and BPS Analysis by Distribution Channel, 2025 and 2035
  • Figure 61: Eastern Europe Market Y-o-Y Growth Comparison by Distribution Channel, 2025-2035
  • Figure 62: Eastern Europe Market Attractiveness Analysis by Distribution Channel
  • Figure 63: East Asia Market Value Share and BPS Analysis by Country, 2025 and 2035
  • Figure 64: East Asia Market Value Share and BPS Analysis by Type, 2025 and 2035
  • Figure 65: East Asia Market Y-o-Y Growth Comparison by Type, 2025-2035
  • Figure 66: East Asia Market Attractiveness Analysis by Type
  • Figure 67: East Asia Market Value Share and BPS Analysis by Application, 2025 and 2035
  • Figure 68: East Asia Market Y-o-Y Growth Comparison by Application, 2025-2035
  • Figure 69: East Asia Market Attractiveness Analysis by Application
  • Figure 70: East Asia Market Value Share and BPS Analysis by Distribution Channel, 2025 and 2035
  • Figure 71: East Asia Market Y-o-Y Growth Comparison by Distribution Channel, 2025-2035
  • Figure 72: East Asia Market Attractiveness Analysis by Distribution Channel
  • Figure 73: South Asia & Pacific Market Value Share and BPS Analysis by Country, 2025 and 2035
  • Figure 74: South Asia & Pacific Market Value Share and BPS Analysis by Type, 2025 and 2035
  • Figure 75: South Asia & Pacific Market Y-o-Y Growth Comparison by Type, 2025-2035
  • Figure 76: South Asia & Pacific Market Attractiveness Analysis by Type
  • Figure 77: South Asia & Pacific Market Value Share and BPS Analysis by Application, 2025 and 2035
  • Figure 78: South Asia & Pacific Market Y-o-Y Growth Comparison by Application, 2025-2035
  • Figure 79: South Asia & Pacific Market Attractiveness Analysis by Application
  • Figure 80: South Asia & Pacific Market Value Share and BPS Analysis by Distribution Channel, 2025 and 2035
  • Figure 81: South Asia & Pacific Market Y-o-Y Growth Comparison by Distribution Channel, 2025-2035
  • Figure 82: South Asia & Pacific Market Attractiveness Analysis by Distribution Channel
  • Figure 83: Middle East and Africa Market Value Share and BPS Analysis by Country, 2025 and 2035
  • Figure 84: Middle East and Africa Market Value Share and BPS Analysis by Type, 2025 and 2035
  • Figure 85: Middle East and Africa Market Y-o-Y Growth Comparison by Type, 2025-2035
  • Figure 86: Middle East and Africa Market Attractiveness Analysis by Type
  • Figure 87: Middle East and Africa Market Value Share and BPS Analysis by Application, 2025 and 2035
  • Figure 88: Middle East and Africa Market Y-o-Y Growth Comparison by Application, 2025-2035
  • Figure 89: Middle East and Africa Market Attractiveness Analysis by Application
  • Figure 90: Middle East and Africa Market Value Share and BPS Analysis by Distribution Channel, 2025 and 2035
  • Figure 91: Middle East and Africa Market Y-o-Y Growth Comparison by Distribution Channel, 2025-2035
  • Figure 92: Middle East and Africa Market Attractiveness Analysis by Distribution Channel
  • Figure 93: Global Market - Tier Structure Analysis
  • Figure 94: Global Market - Company Share Analysis

Frequently Asked Questions

How big is the isodecyl citrate market in 2025?

The global isodecyl citrate market is estimated to be valued at USD 577.7 million in 2025.

What will be the size of the isodecyl citrate market in 2035?

The isodecyl citrate market size is projected to reach USD 1,054.3 million by 2035.

How much will be the isodecyl citrate market growth between 2025 and 2035?

The isodecyl citrate market is expected to grow at a 6.2% CAGR between 2025 and 2035.

Which type segment is projected to lead in the isodecyl citrate market in 2025?

The natural type segment is projected to lead in the isodecyl citrate market with 40% market share in 2025.

Which application segment will contribute significant share in the isodecyl citrate market in 2025?

In terms of application, the personal care products segment will command 85% share in the isodecyl citrate market in 2025.

Explore Similar Insights

Future Market Insights

Isodecyl Citrate Market

Chat With

MaRIA

Hi There, I am MaRIA, Your Market Research Intelligence Assistant. How may I help you?