
- Market Size (2026)
- USD 161.6 Mn
- Forecast (2036)
- USD 211.0 Mn
- CAGR (2026 to 2036)
- 2.7%
How big is the Kyanite Market in 2026?
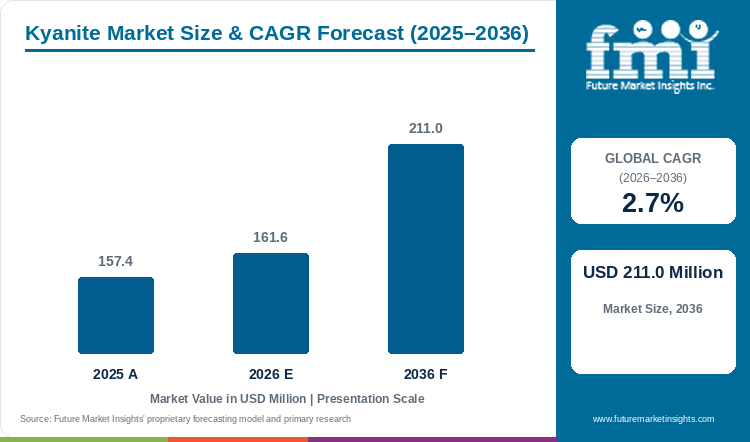
The global kyanite market is estimated at USD 161.6 million in 2026, compared with USD 157.4 million in 2025, and is forecast to reach USD 211.0 million by 2036, expanding at a CAGR of 2.7% from 2026 to 2036.
Demand for kyanite follows furnace and kiln work, where the mineral is specified in refractory mixes that customers do not change lightly. Steelmaking investment and the dimensional behavior the mineral gives a fired lining are reinforcing that demand, and the market is expected to keep growing at a low single-digit rate through 2036. Tata Steel commissioned a new blast furnace at Kalinganagar in September 2024 as part of an INR 27,000 crore (USD 2.8 billion) expansion that raises the site's capacity from 3 million to 8 million tonnes a year, and thyssenkrupp Steel began the ramp-up of new and modernised facilities at Duisburg in July 2025, including two walking beam furnaces, after investment of around EUR 800 million (USD 920 million). These projects add furnace work, but kyanite is bought only where a refractory maker specifies it in the mix, so steel investment does not turn into mineral orders one for one.
Mineral cost is the second force. USGS reports that the average unit value of US kyanite exports rose from USD 460 per tonne in 2024 to USD 510 in 2025, while global andalusite supply remained constrained. Kyanite Mining Corporation reports that its kyanite expands by 17% to 19% as it converts to mullite, which offsets the shrinkage of other refractory ingredients. Higher mineral costs push producers to test alternatives, while the expansion a fired lining needs helps qualified kyanite suppliers retain repeat orders, as per FMI's analysis.
Market Size & Forecast
Table 1: Kyanite Market Size and Forecast (USD million and CAGR percentage), 2025 to 2036
| Market size and forecast | Value |
|---|---|
| 2025 Value | USD 157.4 million |
| Estimated market size in 2026 | USD 161.6 million |
| Projected market size by 2036 | USD 211.0 million |
| CAGR (2026-2036) | 2.7% |
| Added revenue, 2026 to 2036 | USD 49.4 million |
Key Market Trends & Insights
- Fireproofing is estimated to account for 68.5% of kyanite demand by application in 2026, so demand tracks refractory work more closely than ceramics or casting.
- Manufacturing is expected to hold 64.2% of demand by end use in 2026, which places buying with kiln, foundry and component makers that test each mineral fraction in their own process.
- Steel plants are renewing furnaces. Tata Steel's Kalinganagar blast furnace and thyssenkrupp's Duisburg facilities add lining work for refractory producers, but kyanite is ordered only where the mix specifies it.
- Mineral costs are rising. The average unit value of US kyanite exports increased from USD 460 a tonne in 2024 to USD 510 in 2025, which gives refractory producers a reason to test alternative ingredients.
- Dimensional behavior decides supplier selection. Kyanite Mining Corporation reports 17% to 19% expansion as its kyanite converts to mullite, so a fired lining keeps its fit and qualified material is reordered.
- United States primary supply is concentrated. USGS records one integrated firm operating two producing Virginia mines in its 2025 assessment, so continuity at that firm matters to buyers of its concentrate.
Regional Highlights
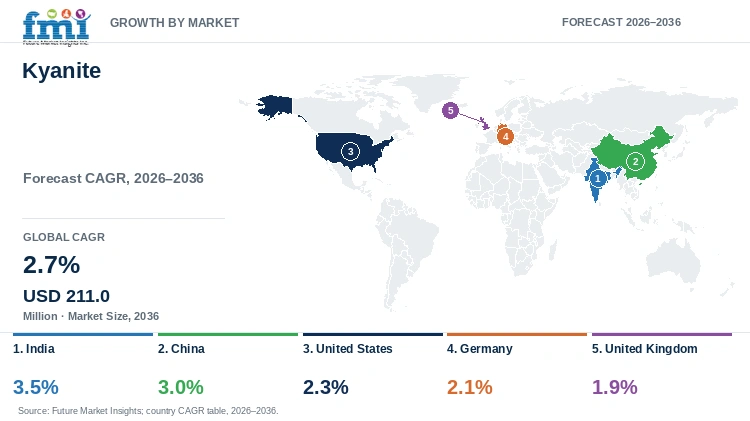
- India is likely to grow at a 3.5% CAGR during the forecast period, followed by China at 3.0%, the United States at 2.3%, Germany at 2.1% and the United Kingdom at 1.9%.
Analyst Perspective
“Furnace maintenance gives kyanite suppliers a continuing route to orders through approved refractory formulations. Consistent chemistry and particle size help customers reproduce the required fired dimensions, making those controls commercially important when a cheaper mineral would require further trials.”
- Nikhil Kaitwade, Principal Consultant, FMI
How is the Kyanite Market segmented?
The Kyanite Market is segmented by type, application, end use and region.
- By Type: Blue and Cyan.
- By Application: Ceramic, Casting and Fireproofing.
- By End Use: Railroad, Electrical and Electronic, Automotive, Manufacturing and Others.
- By Region: North America, Latin America, Western Europe, Eastern Europe, East Asia, South Asia and Pacific, and Middle East and Africa.
Why is Fireproofing the Leading Application in the Kyanite Market?
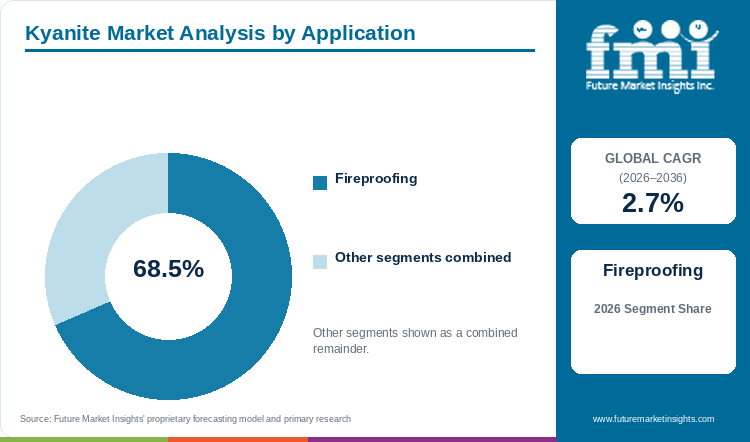
Fireproofing accounts for an estimated 68.5% of kyanite demand by application in 2026, equal to about USD 110.7 million, as per FMI's analysis.
Table 2: Application Share for the Kyanite Market (percentage share of revenue), 2026
| Segment | Share (2026) |
|---|---|
| Fireproofing | 68.5% |
| Other segments combined | 31.5% |
USGS identifies refractories as the principal use of combined kyanite and mullite output in the United States. Kyanite Mining Corporation describes the mineral's conversion expansion as a way to offset shrinkage from other refractory ingredients, so demand follows the place where dimensional change affects the fit of a shape or the integrity of a lining.
However, the expansion figure for Virginia kyanite does not describe every finished refractory. The addition level, the other ingredients and the firing schedule all matter, and repeated heating and cooling can damage joints. A supplier therefore has to show how its concentrate performs in the customer's mix, not only that the mineral resists high temperature.
Ceramic and casting applications share the remaining 31.5% of demand.
Suppliers best placed to serve this application maintain the agreed chemistry and particle distribution and help refractory makers test the dimensions and service behavior of the complete body.
Why is Manufacturing the Leading End Use in the Kyanite Market?
Manufacturing is expected to hold 64.2% of kyanite demand by end use in 2026, as per FMI's analysis.
Table 3: End Use Share for the Kyanite Market (percentage share of revenue), 2026
| Segment | Share (2026) |
|---|---|
| Manufacturing | 64.2% |
| Other segments combined | 35.8% |
Kyanite Mining Corporation lists kiln furniture and foundry mold coatings among the uses of its mineral. Both link a mineral purchase to a production result: a kiln furniture maker needs a body that keeps its dimensions over repeated firing, while a coating formulator needs material that works with its binder and gives the intended casting surface.
However, the two customers do not need the same powder. Particle distribution affects mixing and binder requirements, and the fired result depends on the rest of the formulation. The cost of rejected components and the use of production equipment can matter more to a buyer than a small difference in the mineral price.
Suppliers best placed prepare the required fraction, retain it across repeat shipments and relate their test results to the customer's production defect or operating requirement.
What are the Key Drivers, Restraints and Opportunities in the Kyanite Market?
The kyanite market is expected to grow from USD 161.6 million in 2026 to USD 211.0 million by 2036, which adds USD 49.4 million over the forecast period. Refractory maintenance supports purchases, while formulation testing limits switching between minerals, and prepared powders are the main way for suppliers to raise the value of each order.
Driver: furnace maintenance and replacement. Furnaces and kilns need linings suited to their thermal cycles, and USGS places refractories first among the uses of combined kyanite and mullite in the United States. That creates a continuing channel for mineral demand, although replacement follows the life of each lining and not a fixed annual cycle.
Restraint: the cost of changing a recipe. Kyanite competes with andalusite and sillimanite, which the Indian Bureau of Mines reports separately, and with prepared mullite and other alumina-bearing ingredients. A lower mineral price can be lost to trial work, processing changes or a lower yield of acceptable fired products, so the complete production result limits substitution.
Opportunity: consistent powder preparation. Kyanite Mining Corporation sells granular and powder material across specified size ranges. Fine material and coarser aggregate behave differently with binders and the surrounding particles, so a supplier that holds the required distribution reduces adjustment at a ceramic or foundry customer's plant and keeps its place in an approved formulation.
Suppliers that connect concentrate consistency with fewer dimensional defects and dependable service are best placed to win a share of the USD 49.4 million added through 2036.
How do Material Specifications and Qualification Rules Influence Demand?
Industrial acceptance depends on what the mineral is, how it has been prepared and what it does during firing. These purchasing and formulation requirements decide whether a product can enter an established mix and whether the next shipment can be used without changing that mix.
Requirements that establish mineral identity
The Indian Bureau of Mines reports kyanite separately from sillimanite and andalusite. Blue and cyan are color descriptions in the market classification and do not establish industrial chemistry. Mineral analysis and impurity limits give the buyer a firmer basis for comparing products than color or a common aluminosilicate description.
Requirements that establish material condition
Raw or calcined condition is part of qualification, because a calcined material does not give a recipe the same response in firing. A substitution has to be assessed against the required dimensional change and the fired properties.
Requirements that establish repeatable delivery
Virginia concentrate contains 56.0% to 61.0% alumina, and the producer offers specified granular and powder ranges. The customer still has to agree which composition and particle distribution suit its process, and trial results become commercially useful only when later deliveries keep those characteristics and the supplier reports any material change.
Qualification favors suppliers that link a delivered specification with a tested result. A mineral that mixes consistently and produces the intended fired body has a better chance of remaining in repeat orders than one sold on its quoted price.
What Technical and Operational Constraints Affect Kyanite Supply?
The constraints on kyanite supply sit at the deposit, the processing plant and the customer's furnace, and solving one does not settle performance at the others.
The first is ore quality. India's mineral yearbook records a resource base of differing material qualities, and beneficiation is needed where the mined material does not meet the concentrate specification. The size of a resource and the supply of usable industrial mineral are separate questions.
The second is preparation. Particle distribution affects mixing and the amount of binder a body needs, so granular and powder offers serve different formulation needs. Excessive dimensional change can crack a shape or interfere with fitting prefabricated pieces, which is why the customer tests the prepared fraction through the intended firing schedule.
The third is the conversion response. The 17% to 19% volumetric expansion reported for Virginia kyanite applies to that material during conversion, and it does not predict the net expansion of a refractory that contains several ingredients. Using the figure without the full recipe risks an unsuitable addition level.
The fourth is supply continuity. USGS identifies one integrated firm operating two Virginia mines, which describes the United States production structure and not the whole global market. For buyers of that concentrate, mining and processing continuity both matter, because an approved replacement source may still need formulation trials.
Suppliers that maintain chemistry and particle size through processing, and state the limits of their firing data, are best placed to keep material in established industrial recipes.
Where are the Commercial Opportunities for Kyanite Suppliers?
The opportunity lies in preparing usable material, supporting a defined formulation and reaching customers through a dependable supply route.
The first is concentrate preparation. India's mineral availability gives producers a basis for supply, but a refractory maker needs material that meets its chemistry and particle requirements, so beneficiation and repeatable preparation add commercial value between the mine and the customer.
The second is application work. Kiln furniture, foundry mold coatings, ceramic parts and brake shoes are among the producer's listed uses, and each places the mineral in a different mixture. A supplier that helps identify the right fraction supports both an acceptable production result and repeat consumption, without treating every use as a bulk refractory order.
The third is distribution. CREMER ERZKONTOR established Peter Skinner Minerals in April 2024 to continue Kyanite Mining Corporation's representation in the United Kingdom. Access to samples, clear specifications and manageable quantities help smaller industrial users keep qualified material in production.
New installations add initial material requirements, while longer lining life can delay replacement, so suppliers should size an opportunity by the component being made and the reason it is replaced.
Kyanite Market by Country (2026 to 2036)
Table 4: Country Growth Outlook for the Kyanite Market (CAGR percentage), 2026 to 2036
| Country | CAGR (2026-2036) |
|---|---|
| India | 3.5% |
| China | 3.0% |
| United States | 2.3% |
| Germany | 2.1% |
| United Kingdom | 1.9% |
What is supporting kyanite supply and demand in India?
India is likely to grow at a 3.5% CAGR during the forecast period, the highest rate among the countries analysed.
The Indian Bureau of Mines reports domestic kyanite production and a resource base of differing material qualities. A domestic source and the Kalinganagar expansion, which raises Tata Steel's site capacity from 3 million to 8 million tonnes a year, are an advantage for refractory suppliers, because they add furnace work close to the mineral. The disadvantage is that ore availability does not mean every deposit can serve the same refractory recipe.
Producers that demonstrate repeatable fired behavior are most likely to reach industrial buyers whose orders depend on a defined mix, and the steel expansion supplies the lining work for those orders.
What supports kyanite demand in China?
China is likely to grow at a 3.0% CAGR during the forecast period.
The National Bureau of Statistics recorded 499.95 million tonnes of crude steel from industrial enterprises above designated size in the first half of 2026, 3.0% less than a year earlier. The size of the operating base is an advantage, because it sustains refractory replacement work. The disadvantage is that lower steel output restrains repeat mineral orders.
The outlook rests more on casting materials and ceramics, uses that Kyanite Mining Corporation includes in its product information. A coating customer needs material that works with its binder, a ceramic customer may weigh dimensional change through firing more heavily, and repeat supply depends on keeping the approved result across batches.
What is driving kyanite demand in the United States?
The United States is likely to grow at a 2.3% CAGR during the forecast period.
USGS reports that crude steel production rose 1.6% to 54.6 million tonnes in the first eight months of 2025 and links this with a similar change in consumption of kyanite-mullite refractories. An integrated Virginia mining and processing base is an advantage, because domestic buyers can assess the source together with the concentrate specification. The disadvantage is that a refractory maker using several mineral fractions has little room for variation in one ingredient.
Suppliers serving domestic and export customers will need to preserve the characteristics established during each customer's qualification work, and steel output remains the indicator that moves refractory consumption.
Where does Germany support specialised kyanite purchases?
Germany is likely to grow at a 2.1% CAGR during the forecast period.
In July 2025 thyssenkrupp Steel began the ramp-up of facilities at Duisburg after investment of around EUR 800 million (USD 920 million), including two new walking beam furnaces. The renewal gives refractory suppliers new furnace work, which is an advantage. The disadvantage is that kyanite is ordered only where the mineral is specified, and friction products such as the brake shoes that Kyanite Mining Corporation lists among its uses need a separate technical offer from refractories.
A friction material developer tests how the mineral interacts with the other ingredients, while a refractory producer examines the fired body and its service conditions. The outlook reflects gains from these defined uses, with successful formulations supporting repeat purchases.
How does distribution shape the United Kingdom's opportunity?
The United Kingdom is likely to grow at a 1.9% CAGR during the forecast period, the lowest rate among the countries analysed.
CREMER ERZKONTOR took over Kyanite Mining Corporation's UK representation from 1 April 2024 and established Peter Skinner Minerals to continue local sales. The arrangement gives local users a route to an established international source, which is an advantage. The disadvantage is that it changes distribution and adds no mining capacity.
The outlook depends on how well samples, specifications and suitable order quantities are coordinated, so that refractory and ceramic users can keep an approved mineral in their formulas.
Who are the notable companies in the Kyanite Market?
The companies differ by the work they do between the deposit and the industrial user. Mineral production, powder preparation and distribution each answer a different part of the customer's requirement, and no ranking by company revenue is implied.
Kyanite Mining Corporation sells Virginia kyanite concentrate in granular and powder form. Maharashtra State Mining Corporation lists kyanite in its mineral portfolio. For a buyer, the difference is whether the offer is ready for an approved recipe or needs further preparation to meet it.
CREMER ERZKONTOR sells through distribution, including the UK representation continued through Peter Skinner Minerals. Alroko sells industrial kyanite for refractory and friction applications, and Ruby Ceramics offers fine and ultrafine mineral powders for ceramic and foundry customers.
Company size or mine ownership alone does not settle the comparison. The stronger position belongs to the supplier that can identify the mineral's origin, provide the required fraction and keep its behavior unchanged across repeat deliveries.
Key Developments in the Kyanite Market
- On 16 July 2026, China's National Bureau of Statistics reported 499.95 million tonnes of crude steel from enterprises above designated size in the first half of 2026, 3.0% less than a year earlier.
- In its 2026 Mineral Commodity Summaries, USGS recorded one integrated firm operating two producing Virginia mines in 2025.
- On 4 July 2025, thyssenkrupp Steel announced the ramp-up of new and modernised facilities at Duisburg, including two walking beam furnaces.
- On 20 September 2024, Tata Steel commissioned a new blast furnace at Kalinganagar as part of an expansion to raise site capacity from 3 million to 8 million tonnes a year.
- On 1 April 2024, CREMER ERZKONTOR took over Kyanite Mining Corporation's UK representation and established Peter Skinner Minerals.
Key Players in the Kyanite Market
- Kyanite Mining Corporation
- Maharashtra State Mining Corporation
- CREMER ERZKONTOR
- Alroko
- Ruby Ceramics
Kyanite Market Report Scope
Table 5: Report Scope for the Kyanite Market (coverage fields and definitions), 2026 to 2036
| Coverage Field | Report Scope |
|---|---|
| Market Breakdown | Type (Blue, Cyan); Application (Ceramic, Casting, Fireproofing); End Use (Railroad, Electrical and Electronic, Automotive, Manufacturing, Others) |
| Quantitative Units | Revenue in USD million and CAGR from 2026 to 2036 |
| Market Definition | Industrial kyanite mineral and prepared concentrate sold for ceramic, casting and refractory applications. It excludes gemstone retail, finished refractory component revenue and separately sold synthetic mullite. |
| Regions Covered | North America, Latin America, Western Europe, Eastern Europe, East Asia, South Asia and Pacific, Middle East and Africa |
| Countries Covered | India, China, United States, Germany and United Kingdom |
| Key Companies Covered | Kyanite Mining Corporation, Maharashtra State Mining Corporation, CREMER ERZKONTOR, Alroko and Ruby Ceramics |
| Forecast Period | 2026 to 2036 (with 2025 historical baseline) |
| Approach | Combined primary interviews, secondary literature analysis, and top-down data triangulation |
Kyanite Market - Research Methodology
The market assessment combines primary interviews with industry participants and secondary research drawn from company disclosures, trade data and industry publications. Market size is built from supply-side and demand-side estimates and validated top-down, and segment shares and competitive positioning are checked through data triangulation before publication.
Kyanite Market by Segments
By Type
- Blue
- Cyan
By Application
- Ceramic
- Casting
- Fireproofing
By End Use
- Railroad
- Electrical and Electronic
- Automotive
- Manufacturing
- Others
By Region
- North America
- United States
- Canada
- Latin America
- Brazil
- Mexico
- Argentina
- Chile
- Western Europe
- Germany
- France
- United Kingdom
- Italy
- Spain
- Benelux
- Nordics
- Eastern Europe
- Poland
- Czech Republic
- Romania
- Hungary
- East Asia
- China
- Japan
- South Korea
- South Asia and Pacific
- India
- ASEAN
- Australia and New Zealand
- Middle East and Africa
- GCC Countries
- South Africa
- Turkiye
- Israel
Research Sources and Bibliography
- [1] Tata Steel. Tata Steel commissions India's largest blast furnace at Kalinganagar. 20 September 2024.
- [2] thyssenkrupp Steel. First slabs rolled: thyssenkrupp Steel launches new high-tech facilities at the Duisburg location following a major investment. 4 July 2025.
- [3] U.S. Geological Survey. Mineral Commodity Summaries 2026: Kyanite and Related Minerals. 2026.
- [4] Kyanite Mining Corporation. Virginia Kyanite (company web page). n.d.
- [5] Indian Bureau of Mines. Indian Minerals Yearbook 2024: Kyanite, Sillimanite and Andalusite. 2024.
- [6] CREMER ERZKONTOR. CREMER ERZKONTOR founds company for the distribution of Kyanite and Minerals in UK. 2024.
- [7] National Bureau of Statistics of China. Industrial Production Operation in June 2026. 16 July 2026.
Table of Content
- Key Takeaways
- Market Size and CAGR
- Top Growth Driver
- Fastest Growing Segment
- Leading Region
- Key Companies
- Emerging Opportunities
- Executive Summary
- Global Market Outlook
- Demand-side Trends
- Supply-side Trends
- Technology Roadmap Analysis
- Analysis and Recommendations
- Analyst Perspective (What is happening? Why now? What should investors know?)
- Key Questions Answered
- How large is the market?
- What is the CAGR?
- What are key trends?
- Which region dominates?
- Who are the leaders?
Read More...
- Market Overview
- Market Coverage / Taxonomy
- Market Definition / Scope / Limitations
- Research Methodology
- Chapter Orientation
- Analytical Lens and Working Hypotheses
- Market Structure, Signals, and Trend Drivers
- Benchmarking and Cross-market Comparability
- Market Sizing, Forecasting, and Opportunity Mapping
- Research Design and Evidence Framework
- Desk Research Programme (Secondary Evidence)
- Expert Input and Fieldwork (Primary Evidence)
- Tooling, Models, and Reference Databases
- Data Engineering and Model Build
- Quality Assurance and Audit Trail
- Market Background
- Market Dynamics (Drivers, Restraints, Opportunity, Trends)
- Scenario Forecast (Optimistic, Likely, Conservative)
- Impact Analysis
- AI Impact
- Sustainability Impact
- Regulatory Impact
- Technology Impact
- Consumer / Buyer Analysis
- Purchase Drivers
- Adoption Barriers
- Buyer Journey
- Opportunity Map Analysis
- Product Life Cycle Analysis
- Supply Chain Analysis
- Investment Feasibility Matrix
- Value Chain Analysis
- PESTLE and Porter's Analysis
- Regulatory Landscape
- Regional Parent Market Outlook
- Production and Consumption Statistics
- Import and Export Statistics
- Global Market Analysis and Forecast, 2021 to 2036
- Historical Market Size Value (USD Million) Analysis, 2021 to 2025
- Current and Future Market Size Value (USD Million) Projections, 2026 to 2036
- Y-o-Y Growth Trend Analysis
- Absolute $ Opportunity Analysis
- Global Market Pricing Analysis, 2021 to 2036
- Global Market Analysis and Forecast, By Type, 2021 to 2036
- Introduction / Key Findings
- Historical Market Size Value (USD Million) Analysis By Type, 2021 to 2025
- Current and Future Market Size Value (USD Million) Analysis and Forecast By Type, 2026 to 2036
- Blue
- Cyan
- Y-o-Y Growth Trend Analysis By Type, 2021 to 2025
- Absolute $ Opportunity Analysis By Type, 2026 to 2036
- Global Market Analysis and Forecast, By Application, 2021 to 2036
- Introduction / Key Findings
- Historical Market Size Value (USD Million) Analysis By Application, 2021 to 2025
- Current and Future Market Size Value (USD Million) Analysis and Forecast By Application, 2026 to 2036
- Ceramic
- Casting
- Fireproofing
- Y-o-Y Growth Trend Analysis By Application, 2021 to 2025
- Absolute $ Opportunity Analysis By Application, 2026 to 2036
- Global Market Analysis and Forecast, By End Use, 2021 to 2036
- Introduction / Key Findings
- Historical Market Size Value (USD Million) Analysis By End Use, 2021 to 2025
- Current and Future Market Size Value (USD Million) Analysis and Forecast By End Use, 2026 to 2036
- Railroad
- Electrical and Electronic
- Automotive
- Manufacturing
- Others
- Y-o-Y Growth Trend Analysis By End Use, 2021 to 2025
- Absolute $ Opportunity Analysis By End Use, 2026 to 2036
- Global Market Analysis and Forecast, By Region, 2021 to 2036
- Introduction
- Historical Market Size Value (USD Million) Analysis By Region, 2021 to 2025
- Current Market Size Value (USD Million) Analysis and Forecast By Region, 2026 to 2036
- North America
- Latin America
- Western Europe
- Eastern Europe
- East Asia
- South Asia and Pacific
- Middle East and Africa
- Market Attractiveness Analysis By Region
- North America Market Analysis and Forecast, By Country, 2021 to 2036
- Historical Market Size Value (USD Million) Trend Analysis By Market Taxonomy, 2021 to 2025
- Market Size Value (USD Million) Forecast By Market Taxonomy, 2026 to 2036
- By Country
- United States
- Canada
- By Type
- By Application
- By End Use
- By Country
- Market Attractiveness Analysis
- By Country
- By Type
- By Application
- By End Use
- Key Takeaways
- Latin America Market Analysis and Forecast, By Country
- Historical Market Size Value (USD Million) Trend Analysis By Market Taxonomy, 2021 to 2025
- Market Size Value (USD Million) Forecast By Market Taxonomy, 2026 to 2036
- By Country
- Brazil
- Mexico
- Argentina
- Chile
- By Type
- By Application
- By End Use
- By Country
- Market Attractiveness Analysis
- By Country
- By Type
- By Application
- By End Use
- Key Takeaways
- Western Europe Market Analysis and Forecast, By Country
- Historical Market Size Value (USD Million) Trend Analysis By Market Taxonomy, 2021 to 2025
- Market Size Value (USD Million) Forecast By Market Taxonomy, 2026 to 2036
- By Country
- Germany
- France
- United Kingdom
- Italy
- Spain
- Benelux
- Nordics
- By Type
- By Application
- By End Use
- By Country
- Market Attractiveness Analysis
- By Country
- By Type
- By Application
- By End Use
- Key Takeaways
- Eastern Europe Market Analysis and Forecast, By Country
- Historical Market Size Value (USD Million) Trend Analysis By Market Taxonomy, 2021 to 2025
- Market Size Value (USD Million) Forecast By Market Taxonomy, 2026 to 2036
- By Country
- Poland
- Czech Republic
- Romania
- Hungary
- By Type
- By Application
- By End Use
- By Country
- Market Attractiveness Analysis
- By Country
- By Type
- By Application
- By End Use
- Key Takeaways
- East Asia Market Analysis and Forecast, By Country
- Historical Market Size Value (USD Million) Trend Analysis By Market Taxonomy, 2021 to 2025
- Market Size Value (USD Million) Forecast By Market Taxonomy, 2026 to 2036
- By Country
- China
- Japan
- South Korea
- By Type
- By Application
- By End Use
- By Country
- Market Attractiveness Analysis
- By Country
- By Type
- By Application
- By End Use
- Key Takeaways
- South Asia and Pacific Market Analysis and Forecast, By Country
- Historical Market Size Value (USD Million) Trend Analysis By Market Taxonomy, 2021 to 2025
- Market Size Value (USD Million) Forecast By Market Taxonomy, 2026 to 2036
- By Country
- India
- ASEAN
- Australia and New Zealand
- By Type
- By Application
- By End Use
- By Country
- Market Attractiveness Analysis
- By Country
- By Type
- By Application
- By End Use
- Key Takeaways
- Middle East and Africa Market Analysis and Forecast, By Country
- Historical Market Size Value (USD Million) Trend Analysis By Market Taxonomy, 2021 to 2025
- Market Size Value (USD Million) Forecast By Market Taxonomy, 2026 to 2036
- By Country
- GCC Countries
- South Africa
- Turkiye
- Israel
- By Type
- By Application
- By End Use
- By Country
- Market Attractiveness Analysis
- By Country
- By Type
- By Application
- By End Use
- Key Takeaways
- Key Countries Market Analysis
- United States
- Pricing Analysis
- Market Share Analysis, 2025
- By Type
- By Application
- By End Use
- Canada
- Pricing Analysis
- Market Share Analysis, 2025
- By Type
- By Application
- By End Use
- Mexico
- Pricing Analysis
- Market Share Analysis, 2025
- By Type
- By Application
- By End Use
- Brazil
- Pricing Analysis
- Market Share Analysis, 2025
- By Type
- By Application
- By End Use
- Chile
- Pricing Analysis
- Market Share Analysis, 2025
- By Type
- By Application
- By End Use
- Germany
- Pricing Analysis
- Market Share Analysis, 2025
- By Type
- By Application
- By End Use
- United Kingdom
- Pricing Analysis
- Market Share Analysis, 2025
- By Type
- By Application
- By End Use
- Italy
- Pricing Analysis
- Market Share Analysis, 2025
- By Type
- By Application
- By End Use
- Spain
- Pricing Analysis
- Market Share Analysis, 2025
- By Type
- By Application
- By End Use
- France
- Pricing Analysis
- Market Share Analysis, 2025
- By Type
- By Application
- By End Use
- India
- Pricing Analysis
- Market Share Analysis, 2025
- By Type
- By Application
- By End Use
- ASEAN
- Pricing Analysis
- Market Share Analysis, 2025
- By Type
- By Application
- By End Use
- Australia and New Zealand
- Pricing Analysis
- Market Share Analysis, 2025
- By Type
- By Application
- By End Use
- China
- Pricing Analysis
- Market Share Analysis, 2025
- By Type
- By Application
- By End Use
- Japan
- Pricing Analysis
- Market Share Analysis, 2025
- By Type
- By Application
- By End Use
- South Korea
- Pricing Analysis
- Market Share Analysis, 2025
- By Type
- By Application
- By End Use
- Poland
- Pricing Analysis
- Market Share Analysis, 2025
- By Type
- By Application
- By End Use
- Hungary
- Pricing Analysis
- Market Share Analysis, 2025
- By Type
- By Application
- By End Use
- South Africa
- Pricing Analysis
- Market Share Analysis, 2025
- By Type
- By Application
- By End Use
- United States
- Market Structure Analysis
- Competition Dashboard
- Competition Benchmarking
- Market Share Analysis of Top Players
- By Regional
- By Type
- By Application
- By End Use
- Emerging Startups
- Innovation Benchmarking
- Competition Analysis
- Competition Deep Dive
- Kyanite Mining Corporation
- Overview
- Product Portfolio
- Profitability by Market Segments
- Sales Footprint
- Strategy Overview
- Marketing Strategy
- Product Strategy
- Channel Strategy
- Maharashtra State Mining Corporation
- CREMER ERZKONTOR
- Alroko
- Ruby Ceramics
- Kyanite Mining Corporation
- Case Studies
- Success Stories
- Recent Developments
- Competition Deep Dive
- Assumptions & Acronyms Used
List of Tables
- Table 1: Global Market Value (USD Million) Forecast by Region, 2021 to 2036
- Table 2: Global Market Value (USD Million) Forecast by Type, 2021 to 2036
- Table 3: Global Market Value (USD Million) Forecast by Application, 2021 to 2036
- Table 4: Global Market Value (USD Million) Forecast by End Use, 2021 to 2036
- Table 5: North America Market Value (USD Million) Forecast by Country, 2021 to 2036
- Table 6: North America Market Value (USD Million) Forecast by Type, 2021 to 2036
- Table 7: North America Market Value (USD Million) Forecast by Application, 2021 to 2036
- Table 8: North America Market Value (USD Million) Forecast by End Use, 2021 to 2036
- Table 9: Latin America Market Value (USD Million) Forecast by Country, 2021 to 2036
- Table 10: Latin America Market Value (USD Million) Forecast by Type, 2021 to 2036
- Table 11: Latin America Market Value (USD Million) Forecast by Application, 2021 to 2036
- Table 12: Latin America Market Value (USD Million) Forecast by End Use, 2021 to 2036
- Table 13: Western Europe Market Value (USD Million) Forecast by Country, 2021 to 2036
- Table 14: Western Europe Market Value (USD Million) Forecast by Type, 2021 to 2036
- Table 15: Western Europe Market Value (USD Million) Forecast by Application, 2021 to 2036
- Table 16: Western Europe Market Value (USD Million) Forecast by End Use, 2021 to 2036
- Table 17: Eastern Europe Market Value (USD Million) Forecast by Country, 2021 to 2036
- Table 18: Eastern Europe Market Value (USD Million) Forecast by Type, 2021 to 2036
- Table 19: Eastern Europe Market Value (USD Million) Forecast by Application, 2021 to 2036
- Table 20: Eastern Europe Market Value (USD Million) Forecast by End Use, 2021 to 2036
- Table 21: East Asia Market Value (USD Million) Forecast by Country, 2021 to 2036
- Table 22: East Asia Market Value (USD Million) Forecast by Type, 2021 to 2036
- Table 23: East Asia Market Value (USD Million) Forecast by Application, 2021 to 2036
- Table 24: East Asia Market Value (USD Million) Forecast by End Use, 2021 to 2036
- Table 25: South Asia and Pacific Market Value (USD Million) Forecast by Country, 2021 to 2036
- Table 26: South Asia and Pacific Market Value (USD Million) Forecast by Type, 2021 to 2036
- Table 27: South Asia and Pacific Market Value (USD Million) Forecast by Application, 2021 to 2036
- Table 28: South Asia and Pacific Market Value (USD Million) Forecast by End Use, 2021 to 2036
- Table 29: Middle East and Africa Market Value (USD Million) Forecast by Country, 2021 to 2036
- Table 30: Middle East and Africa Market Value (USD Million) Forecast by Type, 2021 to 2036
- Table 31: Middle East and Africa Market Value (USD Million) Forecast by Application, 2021 to 2036
- Table 32: Middle East and Africa Market Value (USD Million) Forecast by End Use, 2021 to 2036
List of Figures
- Figure 1: Global Market Pricing Analysis
- Figure 2: Global Market Value (USD Million) Forecast 2021-2036
- Figure 3: Global Market Value Share and BPS Analysis by Type, 2026 and 2036
- Figure 4: Global Market Y-o-Y Growth Comparison by Type, 2026-2036
- Figure 5: Global Market Attractiveness Analysis by Type
- Figure 6: Global Market Value Share and BPS Analysis by Application, 2026 and 2036
- Figure 7: Global Market Y-o-Y Growth Comparison by Application, 2026-2036
- Figure 8: Global Market Attractiveness Analysis by Application
- Figure 9: Global Market Value Share and BPS Analysis by End Use, 2026 and 2036
- Figure 10: Global Market Y-o-Y Growth Comparison by End Use, 2026-2036
- Figure 11: Global Market Attractiveness Analysis by End Use
- Figure 12: Global Market Value (USD Million) Share and BPS Analysis by Region, 2026 and 2036
- Figure 13: Global Market Y-o-Y Growth Comparison by Region, 2026-2036
- Figure 14: Global Market Attractiveness Analysis by Region
- Figure 15: North America Market Incremental Dollar Opportunity, 2026-2036
- Figure 16: Latin America Market Incremental Dollar Opportunity, 2026-2036
- Figure 17: Western Europe Market Incremental Dollar Opportunity, 2026-2036
- Figure 18: Eastern Europe Market Incremental Dollar Opportunity, 2026-2036
- Figure 19: East Asia Market Incremental Dollar Opportunity, 2026-2036
- Figure 20: South Asia and Pacific Market Incremental Dollar Opportunity, 2026-2036
- Figure 21: Middle East and Africa Market Incremental Dollar Opportunity, 2026-2036
- Figure 22: North America Market Value Share and BPS Analysis by Country, 2026 and 2036
- Figure 23: North America Market Value Share and BPS Analysis by Type, 2026 and 2036
- Figure 24: North America Market Y-o-Y Growth Comparison by Type, 2026-2036
- Figure 25: North America Market Attractiveness Analysis by Type
- Figure 26: North America Market Value Share and BPS Analysis by Application, 2026 and 2036
- Figure 27: North America Market Y-o-Y Growth Comparison by Application, 2026-2036
- Figure 28: North America Market Attractiveness Analysis by Application
- Figure 29: North America Market Value Share and BPS Analysis by End Use, 2026 and 2036
- Figure 30: North America Market Y-o-Y Growth Comparison by End Use, 2026-2036
- Figure 31: North America Market Attractiveness Analysis by End Use
- Figure 32: Latin America Market Value Share and BPS Analysis by Country, 2026 and 2036
- Figure 33: Latin America Market Value Share and BPS Analysis by Type, 2026 and 2036
- Figure 34: Latin America Market Y-o-Y Growth Comparison by Type, 2026-2036
- Figure 35: Latin America Market Attractiveness Analysis by Type
- Figure 36: Latin America Market Value Share and BPS Analysis by Application, 2026 and 2036
- Figure 37: Latin America Market Y-o-Y Growth Comparison by Application, 2026-2036
- Figure 38: Latin America Market Attractiveness Analysis by Application
- Figure 39: Latin America Market Value Share and BPS Analysis by End Use, 2026 and 2036
- Figure 40: Latin America Market Y-o-Y Growth Comparison by End Use, 2026-2036
- Figure 41: Latin America Market Attractiveness Analysis by End Use
- Figure 42: Western Europe Market Value Share and BPS Analysis by Country, 2026 and 2036
- Figure 43: Western Europe Market Value Share and BPS Analysis by Type, 2026 and 2036
- Figure 44: Western Europe Market Y-o-Y Growth Comparison by Type, 2026-2036
- Figure 45: Western Europe Market Attractiveness Analysis by Type
- Figure 46: Western Europe Market Value Share and BPS Analysis by Application, 2026 and 2036
- Figure 47: Western Europe Market Y-o-Y Growth Comparison by Application, 2026-2036
- Figure 48: Western Europe Market Attractiveness Analysis by Application
- Figure 49: Western Europe Market Value Share and BPS Analysis by End Use, 2026 and 2036
- Figure 50: Western Europe Market Y-o-Y Growth Comparison by End Use, 2026-2036
- Figure 51: Western Europe Market Attractiveness Analysis by End Use
- Figure 52: Eastern Europe Market Value Share and BPS Analysis by Country, 2026 and 2036
- Figure 53: Eastern Europe Market Value Share and BPS Analysis by Type, 2026 and 2036
- Figure 54: Eastern Europe Market Y-o-Y Growth Comparison by Type, 2026-2036
- Figure 55: Eastern Europe Market Attractiveness Analysis by Type
- Figure 56: Eastern Europe Market Value Share and BPS Analysis by Application, 2026 and 2036
- Figure 57: Eastern Europe Market Y-o-Y Growth Comparison by Application, 2026-2036
- Figure 58: Eastern Europe Market Attractiveness Analysis by Application
- Figure 59: Eastern Europe Market Value Share and BPS Analysis by End Use, 2026 and 2036
- Figure 60: Eastern Europe Market Y-o-Y Growth Comparison by End Use, 2026-2036
- Figure 61: Eastern Europe Market Attractiveness Analysis by End Use
- Figure 62: East Asia Market Value Share and BPS Analysis by Country, 2026 and 2036
- Figure 63: East Asia Market Value Share and BPS Analysis by Type, 2026 and 2036
- Figure 64: East Asia Market Y-o-Y Growth Comparison by Type, 2026-2036
- Figure 65: East Asia Market Attractiveness Analysis by Type
- Figure 66: East Asia Market Value Share and BPS Analysis by Application, 2026 and 2036
- Figure 67: East Asia Market Y-o-Y Growth Comparison by Application, 2026-2036
- Figure 68: East Asia Market Attractiveness Analysis by Application
- Figure 69: East Asia Market Value Share and BPS Analysis by End Use, 2026 and 2036
- Figure 70: East Asia Market Y-o-Y Growth Comparison by End Use, 2026-2036
- Figure 71: East Asia Market Attractiveness Analysis by End Use
- Figure 72: South Asia and Pacific Market Value Share and BPS Analysis by Country, 2026 and 2036
- Figure 73: South Asia and Pacific Market Value Share and BPS Analysis by Type, 2026 and 2036
- Figure 74: South Asia and Pacific Market Y-o-Y Growth Comparison by Type, 2026-2036
- Figure 75: South Asia and Pacific Market Attractiveness Analysis by Type
- Figure 76: South Asia and Pacific Market Value Share and BPS Analysis by Application, 2026 and 2036
- Figure 77: South Asia and Pacific Market Y-o-Y Growth Comparison by Application, 2026-2036
- Figure 78: South Asia and Pacific Market Attractiveness Analysis by Application
- Figure 79: South Asia and Pacific Market Value Share and BPS Analysis by End Use, 2026 and 2036
- Figure 80: South Asia and Pacific Market Y-o-Y Growth Comparison by End Use, 2026-2036
- Figure 81: South Asia and Pacific Market Attractiveness Analysis by End Use
- Figure 82: Middle East and Africa Market Value Share and BPS Analysis by Country, 2026 and 2036
- Figure 83: Middle East and Africa Market Value Share and BPS Analysis by Type, 2026 and 2036
- Figure 84: Middle East and Africa Market Y-o-Y Growth Comparison by Type, 2026-2036
- Figure 85: Middle East and Africa Market Attractiveness Analysis by Type
- Figure 86: Middle East and Africa Market Value Share and BPS Analysis by Application, 2026 and 2036
- Figure 87: Middle East and Africa Market Y-o-Y Growth Comparison by Application, 2026-2036
- Figure 88: Middle East and Africa Market Attractiveness Analysis by Application
- Figure 89: Middle East and Africa Market Value Share and BPS Analysis by End Use, 2026 and 2036
- Figure 90: Middle East and Africa Market Y-o-Y Growth Comparison by End Use, 2026-2036
- Figure 91: Middle East and Africa Market Attractiveness Analysis by End Use
- Figure 92: Global Market - Tier Structure Analysis
- Figure 93: Global Market - Company Share Analysis
Frequently Asked Questions
What is the size of the Kyanite Market?
The global kyanite market was valued at USD 157.4 million in 2025 and is estimated at USD 161.6 million in 2026. It is forecast to reach USD 211.0 million by 2036, expanding at a CAGR of 2.7% from 2026 to 2036.
Which application and end use lead the Kyanite Market?
Fireproofing is estimated to account for 68.5% of demand by application in 2026, while manufacturing is estimated to hold 64.2% by end use.
Which country is likely to grow fastest in the Kyanite Market?
India is likely to grow at a 3.5% CAGR during the forecast period, followed by China at 3.0%, the United States at 2.3%, Germany at 2.1% and the United Kingdom at 1.9%.
What does the market cover?
It covers industrial kyanite mineral and prepared concentrate bought for ceramic, casting and refractory uses. Gemstone retail, finished refractory component sales and separately sold synthetic mullite are outside the market boundary.
How should the 17% to 19% expansion figure be used?
It applies to Virginia kyanite during conversion, so it has to be assessed within the complete recipe and firing schedule before it is used to set an addition level. [4]
Are blue and cyan different industrial chemistries?
No. They are color labels, and mineral identity, composition and tested specifications give the useful industrial comparison.
Can calcined material replace raw kyanite directly?
Not without a test. Calcining changes the response in firing, so a replacement has to be assessed in the intended formulation. Competitive Analysis of the Kyanite Market Key Players
Preview the report firsthand - request a free sample
Get SampleGet the brochure for pricing and purchase details.
Get PDF
