Reports

- Global Locations -

Headquarters

Future Market Insights, Inc.

Christiana Corporate, 200
Continental Drive, Suite 401,
Newark, Delaware - 19713,
United States

T: +1-845-579-5705

Americas

Future Market Insights, Inc.

616 Corporate Way, Suite 2-9018,
Valley Cottage, NY 10989, United States

T: +1-347-918-3531

MEA

Future Market Insights

1602-6 Jumeirah Bay X2 Tower, Plot No: JLT-PH2-X2A,
Jumeirah Lakes Towers, Dubai,
United Arab Emirates

Europe

Future Market Insights

3rd Floor, 207 Regent Street,
W1B 3HH London
United Kingdom

T: + 44 (0) 20 8123 9659
D: +44 (0) 20 3287 4268

Asia Pacific

Future Market Insights

IndiaLand Global Tech Park, Unit UG-1, Behind Grand HighStreet, Phase 1, Hinjawadi, MH, Pune – 411057, India

Mascara Applicators Market Overview (2022-2032)

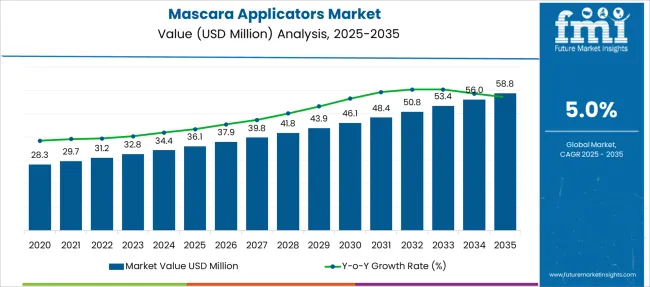
[250 Pages Report] As new fashion trends emerge and product promotions become stronger, the global mascara market is forecast to reach US$ 31.2 Million in 2022, rising at a CAGR of 5.0% to be worth US$ 50.8 Million from 2022 to 2032. Since individuals are becoming progressively concerned about their personal appearance, companies that manufacture mascara applicators have been innovating new products such as rotary applicators for mascaras in the market.

Report Attribute Details
Estimated Base Year Value (2021) US$ 30 Million
Expected Market Value (2022) US$ 31.2 Million
Anticipated Forecast Value (2032) US$ 50.8 Million
Projected Growth Rate (2022-2032) 5% CAGR

A mascara applicator is frequently used by cosmeticians as a way to prevent makeup from smudging or running. Mascara applicators are a guide for users toward easy applications protecting the eyelids and under them from smudging. In order to manufacture mascara applicators, advanced technologies such as 3D printing and advanced material science are being used. Social media marketing and online beauty influencers are projected to have an influential effect on market growth in the near future.

According to the cosmetic industry, the United States is considered to be a highly lucrative market for mascara applicators. As of today, mascara applicators have been specifically used for eyebrow grooming, hair root touch-ups, household cleaning, and as a lip exfoliator in the market.

Growing hygiene concerns and different applications of mascara applicators have contributed to the growth of the mascara applicator market. In recent years, the development of covid-19 cases has contributed to the global demand for disposable mascara applicators.

Applicators are easy to produce and relatively inexpensive to launch, so they are expected to remain a significant portion of the market over the next few years. As far as mascara is concerned, innovation extends beyond brushes. As a result, manufacturers are constantly developing new ways to create more user-friendly and skin-friendly options in the market.

Don't pay for what you don't need

Customize your report by selecting specific countries or regions and save 30%!

What are the Strategies of Manufacturers to Increase Market Sales of Mascara Applicators?

As the cosmetics industry continues to develop and more types of mascara become available, the demand for mascara applicators will increase. In addition, the increase in demands has also led to innovations in mascara applicators. Several companies from South Korea and France are seen launching new mascara applicators on the market. Applicators designed for the newly launched products focus on the maximum effect of application with an easy interface. Furthermore, there is a research project that is being done for the development of soft and even bristles for the mascara applicator. However, it is imperative to have access to new products in the local communities.

With the growth of disposable incomes and the increase in the use of cosmetics among millennials globally, the demand for mascara applicators will likely increase over the next few years. With global demand growing for volumizing mascaras with eyelash thickening properties, the market share for volumizing mascara applicators is on the rise.

Increasing sales of makeup and branded mascara products have driven market demand for organic micro brushes. Additionally, manufacturers are coming up with products to reach consumers with more cost-effective prices, in order to become more competitive on the market. As the number of beauty and wellness websites continues to increase, this has resulted in a rise in the demand for mascara applicators in the marketplace.  

Innovative, easy-to-use, trendy designs of applicators and innovations in technology will contribute to additional developments in the market for various different types of applicators.  For instance, Estee Lauder and Lancome, and Givenchy launched their own versions of vibrating mascaras that are equipped with a brush that vibrates at 125 micropulse per second.

What Barriers does the Mascara Applicators Industry Face?

Growing market demand for voluminous eyelashes products and their brushes has increased market demand for mascara applicators in the market. However, these brushes also come with a number of limitations when it comes to the development of mascara applicators for the market. The popularity of mascaras in the market has decreased recently due to a growing number of skin irritations and eye infections, which has, in turn, reduced the popularity of mascara applicators on the market. 

In recent years the threat of microbial organisms and the wide use of chemicals over plastic bristles have been getting bigger and bigger, leading to greater risks of infections. Technologies in makeup applicators come with safety issues and a chance to damage the eyes.  Hence, this is estimated to act as a significant growth barrier in the mascara applicators market over the next few years.
Sudip Saha
Sudip Saha

Principal Consultant

Talk to Analyst

Find your sweet spots for generating winning opportunities in this market.

How is Europe Contributing to the Growth of the mascara applicators Market?

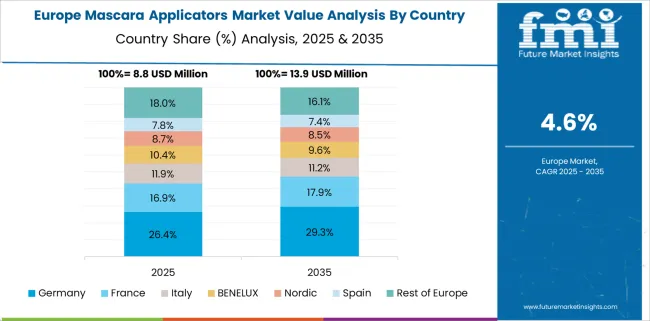
According to Future Market Insights, Europe is expected to provide immense growth opportunities for mascara applicators during the forecast period. The ease of accessibility of this product on the internet will be a key growth factor in the sales of mascara applicators in this region. As of 2022, Europe is expected to hold 35% of global sales of mascara applicators in the market.

Due to the increasing number of beauty brands in these regions, coupled with the growing number of manufacturers, the mascara applicator market has experienced a tremendous boom in this region.  Furthermore, the technological advancements in brush manufacturing are creating favorable economic conditions for the market to grow. Thus, sales of mascara applicators in this region are on the rise.

Why is Asia-Pacific an Exciting Market for Mascara Applicators?

The Asia Pacific is expected to see a strong growth rate in the mascara applicator market during the forecast period. The increasing need for personal growth as well as the influx of beauty bloggers in these regions has resulted in significant market growth for mascara applicators in the market. The region is forecast to surge at over 4% CAGR from 2022 to 2032.

Growing disposable incomes and a corresponding rise in the number of working women in these regions have led to a steady increase in the demand for mascara applicators. As a result of the booming Indian cosmetic market, regional sales in South Asia are expected to continue to grow in the near future. Moreover, with an influx of e-commerce and other online retailers targeting beauty segments, the market for mascara applicators has seen an increase in its demand in recent years.

A growing awareness of the harmful effects of chemicals, combined with an increase in demand for organic products in these regions, has increased the demand for vegan mascara applicators in the market.
Get the data you need at a Fraction of the cost

Personalize your report by choosing insights you need
and save 40%!

Market Competition

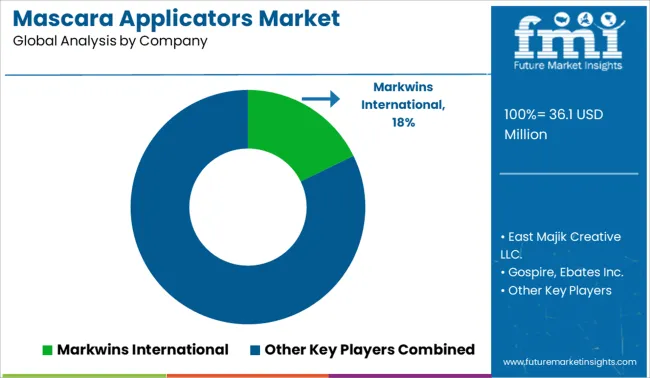
Some of the key participants present in the global mascara applicators market include RAEPA LTD., Markwins International, East Majik Creative LLC., Gospire, Ebates Inc., Albéa, Anisa International, Cospack America Corporation, and International Cosmetic Suppliers Ltd., Unique Specialty Products Ltd., Yuan Harng Co. Ltd., Well Lord Inc, Baralan USA, Chanel and among others.

  • In January 2021, Albea and Erpro are going to design a unique mascara brush within one week. With its partner, Erpro 3D Factory, a leader in 3D printing, Alba launched Make 3D yours, a 3D custom development service. Using this new service, brands will be able to design and have their very own mascara brushes ready for industrialization within four weeks from the moment they order them. With Erpro, brands can follow their project step by step from conception to production, so samples can be tested and validated on-site throughout the design phase. The technology used in this process enables us to create as many as ten different brush shapes within a week

Scope of Report

Report Attribute Details
Growth Rate CAGR of 5% from 2022 to 2032
Base Year for Estimation 2021
Historical Data 2015 to 2020
Forecast Period 2022 to 2032
Quantitative Units Revenue in USD Million, Volume in Kilotons and CAGR from 2022 to 2032
Report Coverage Revenue Forecast, Volume Forecast, Company Ranking, Competitive Landscape, Growth Factors, Trends and Pricing Analysis
Segments Covered
  • Product Type
  • Price Range
  • Nature
  • Sales Channel
  • Region
Regions Covered
  • North America
  • Latin America
  • Western Europe
  • Eastern Europe
  • APEJ
  • Japan
  • Middle East and Africa
Key Countries Profiled
  • USA
  • Canada
  • Brazil
  • Argentina
  • Germany
  •  UK
  • France
  • Spain
  • Italy
  • Nordics
  • BENELUX
  • Australia & New Zealand
  • China
  • India
  • ASEAN
  • GCC
  • South Africa
Key Companies Profiled
  • RAEPA LTD.
  • Markwins International
  • East Majik Creative LLC.
  • Gospire, Ebates Inc.
  • Albéa
  • Anisa International
  • Cospack America Corporation
  • International Cosmetic Suppliers Ltd.
  • Unique Specialty Products Ltd.
  • Yuan Harng Co. Ltd.
  • Well Lord Inc
  • Baralan USA
  • Chanel
  • Others
Customization Available Upon Request

Key Segments Profiled in the Mascara Applicators Industry Survey

Product Type:

  • Tapered Wand   
  • Curved Wand
  • Micro Wand
  • Fat Brush Wand
  • Precision Tip Wand
  • Ball Wand
  • Comb Bristle Wand

Price Range:

  • Low 
  • Medium
  • High

Nature:

  • Reusable
  • Disposable 

Sales Channel:

  • Direct
  • Indirect
  • Hypermarket/Supermarket
  • Independent Stores
  • Specialty Stores
  • E-commerce
  • Others

Region:

  • North America
  • Latin America
  • Western Europe
  • Eastern Europe
  • APEJ
  • Japan
  • Middle East & Africa

Frequently Asked Questions

What is the anticipated growth of the mascara applicators market until 2032?

FMI projects the global mascara applicators market to expand at a 5% value CAGR by 2032.

Which region is forecast to be the most lucrative for mascara applicators’ market growth?

Europe is expected to be the most opportunistic mascara applicators market, holding 35% market value

Which are some prominent mascara applicators manufacturers?

RAEPA LTD., Markwins International, East Majik Creative LLC andGospire, Ebates Inc are some prominent mascara applicators manufacturers

Table of Content

1. Executive Summary

    1.1. Global Market Outlook

    1.2. Demand-side Trends

    1.3. Supply-side Trends

    1.4. Technology Roadmap Analysis

    1.5. Analysis and Recommendations

2. Market Overview

    2.1. Market Coverage / Taxonomy

    2.2. Market Definition / Scope / Limitations

3. Market Background

    3.1. Market Dynamics

        3.1.1. Drivers

        3.1.2. Restraints

        3.1.3. Opportunity 

        3.1.4. Trends

    3.2. Scenario Forecast

        3.2.1. Demand in Optimistic Scenario

        3.2.2. Demand in Likely Scenario

        3.2.3. Demand in Conservative Scenario

    3.3. Opportunity Map Analysis

    3.4. Investment Feasibility Matrix

    3.5. PESTLE and Porter’s Analysis

    3.6. Regulatory Landscape

        3.6.1. By Key Regions

        3.6.2. By Key Countries

4. Global Mascara Applicators Market Analysis 2017-2021 and Forecast, 2022-2032

    4.1. Historical Market Size Value (US$ Mn) & Volume (Mn units) Analysis, 2017-2021

    4.2. Current and Future Market Size Value (US$ Mn) & Volume (Mn units) Projections, 2022-2032

        4.2.1. Y-o-Y Growth Trend Analysis

        4.2.2. Absolute $ Opportunity Analysis

5. Global Mascara Applicators Market Analysis 2017-2021 and Forecast 2022-2032, By Product Type

    5.1. Introduction / Key Findings

    5.2. Historical Market Size Value (US$ Mn) & Volume (Mn units) Analysis By Product Type, 2017-2021

    5.3. Current and Future Market Size Value (US$ Mn) & Volume (Mn units) Analysis and Forecast By Product Type, 2022-2032

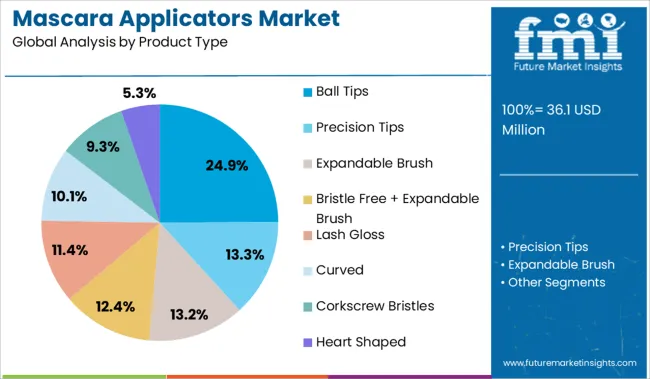
        5.3.1. Ball Tips

        5.3.2. Precision Tips

        5.3.3. Expandable Brush

        5.3.4. Bristle Free + Expandable Brush

        5.3.5. Lash Gloss

        5.3.6. Curved

        5.3.7. Corkscrew Bristles

        5.3.8. Heart Shaped

    5.4. Y-o-Y Growth Trend Analysis By Product Type, 2017-2021

    5.5. Absolute $ Opportunity Analysis By Product Type, 2022-2032

6. Global Mascara Applicators Market Analysis 2017-2021 and Forecast 2022-2032, By Material Type

    6.1. Introduction / Key Findings

    6.2. Historical Market Size Value (US$ Mn) & Volume (Mn units) Analysis By Material Type, 2017-2021

    6.3. Current and Future Market Size Value (US$ Mn) & Volume (Mn units) Analysis and Forecast By Material Type, 2022-2032

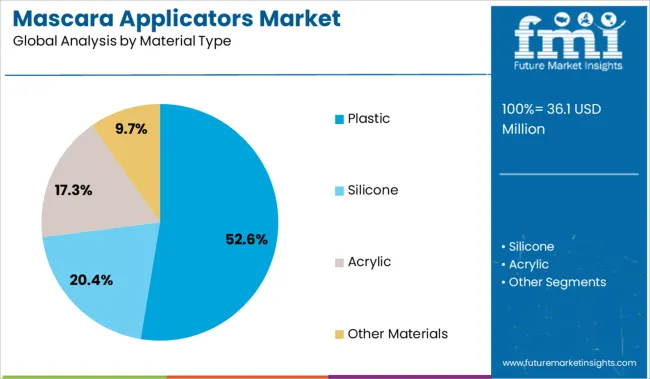
        6.3.1. Plastic

        6.3.2. Silicone

        6.3.3. Acrylic

        6.3.4. Other Materials

    6.4. Y-o-Y Growth Trend Analysis By Material Type, 2017-2021

    6.5. Absolute $ Opportunity Analysis By Material Type, 2022-2032

7. Global Mascara Applicators Market Analysis 2017-2021 and Forecast 2022-2032, By Price Range 

    7.1. Introduction / Key Findings

    7.2. Historical Market Size Value (US$ Mn) & Volume (Mn units) Analysis By Price Range , 2017-2021

    7.3. Current and Future Market Size Value (US$ Mn) & Volume (Mn units) Analysis and Forecast By Price Range , 2022-2032

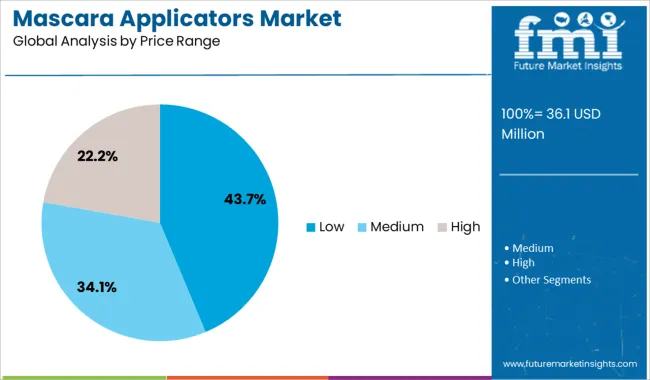
        7.3.1. Low

        7.3.2. Medium

        7.3.3. High 

    7.4. Y-o-Y Growth Trend Analysis By Price Range , 2017-2021

    7.5. Absolute $ Opportunity Analysis By Price Range , 2022-2032

8. Global Mascara Applicators Market Analysis 2017-2021 and Forecast 2022-2032, By Sales Channels 

    8.1. Introduction / Key Findings

    8.2. Historical Market Size Value (US$ Mn) & Volume (Mn units) Analysis By Sales Channels , 2017-2021

    8.3. Current and Future Market Size Value (US$ Mn) & Volume (Mn units) Analysis and Forecast By Sales Channels , 2022-2032

        8.3.1. Supermarkets/Hypermarkets

        8.3.2. Specialty Stores

        8.3.3. Online Retail

        8.3.4. Department Stores

        8.3.5. Direct Sales

    8.4. Y-o-Y Growth Trend Analysis By Sales Channels , 2017-2021

    8.5. Absolute $ Opportunity Analysis By Sales Channels , 2022-2032

9. Global Mascara Applicators Market Analysis 2017-2021 and Forecast 2022-2032, By Region

    9.1. Introduction

    9.2. Historical Market Size Value (US$ Mn) & Volume (Mn units) Analysis By Region, 2017-2021

    9.3. Current Market Size Value (US$ Mn) & Volume (Mn units) Analysis and Forecast By Region, 2022-2032

        9.3.1. North America

        9.3.2. Latin America

        9.3.3. Europe

        9.3.4. Asia Pacific

        9.3.5. MEA

    9.4. Market Attractiveness Analysis By Region

10. North America Mascara Applicators Market Analysis 2017-2021 and Forecast 2022-2032, By Country

    10.1. Historical Market Size Value (US$ Mn) & Volume (Mn units) Trend Analysis By Market Taxonomy, 2017-2021

    10.2. Market Size Value (US$ Mn) & Volume (Mn units) Forecast By Market Taxonomy, 2022-2032

        10.2.1. By Country

            10.2.1.1. U.S.

            10.2.1.2. Canada

        10.2.2. By Product Type

        10.2.3. By Material Type

        10.2.4. By Price Range 

        10.2.5. By Sales Channels 

    10.3. Market Attractiveness Analysis

        10.3.1. By Country

        10.3.2. By Product Type

        10.3.3. By Material Type

        10.3.4. By Price Range 

        10.3.5. By Sales Channels 

    10.4. Key Takeaways

11. Latin America Mascara Applicators Market Analysis 2017-2021 and Forecast 2022-2032, By Country

    11.1. Historical Market Size Value (US$ Mn) & Volume (Mn units) Trend Analysis By Market Taxonomy, 2017-2021

    11.2. Market Size Value (US$ Mn) & Volume (Mn units) Forecast By Market Taxonomy, 2022-2032

        11.2.1. By Country

            11.2.1.1. Brazil

            11.2.1.2. Mexico

            11.2.1.3. Rest of Latin America

        11.2.2. By Product Type

        11.2.3. By Material Type

        11.2.4. By Price Range 

        11.2.5. By Sales Channels 

    11.3. Market Attractiveness Analysis

        11.3.1. By Country

        11.3.2. By Product Type

        11.3.3. By Material Type

        11.3.4. By Price Range 

        11.3.5. By Sales Channels 

    11.4. Key Takeaways

12. Europe Mascara Applicators Market Analysis 2017-2021 and Forecast 2022-2032, By Country

    12.1. Historical Market Size Value (US$ Mn) & Volume (Mn units) Trend Analysis By Market Taxonomy, 2017-2021

    12.2. Market Size Value (US$ Mn) & Volume (Mn units) Forecast By Market Taxonomy, 2022-2032

        12.2.1. By Country

            12.2.1.1. Germany

            12.2.1.2. Italy

            12.2.1.3. France

            12.2.1.4. U.K.

            12.2.1.5. Spain

            12.2.1.6. Russia

            12.2.1.7. BENELUX

            12.2.1.8. Rest of Europe

        12.2.2. By Product Type

        12.2.3. By Material Type

        12.2.4. By Price Range 

        12.2.5. By Sales Channels 

    12.3. Market Attractiveness Analysis

        12.3.1. By Country

        12.3.2. By Product Type

        12.3.3. By Material Type

        12.3.4. By Price Range 

        12.3.5. By Sales Channels 

    12.4. Key Takeaways

13. Asia Pacific Mascara Applicators Market Analysis 2017-2021 and Forecast 2022-2032, By Country

    13.1. Historical Market Size Value (US$ Mn) & Volume (Mn units) Trend Analysis By Market Taxonomy, 2017-2021

    13.2. Market Size Value (US$ Mn) & Volume (Mn units) Forecast By Market Taxonomy, 2022-2032

        13.2.1. By Country

            13.2.1.1. China

            13.2.1.2. Japan

            13.2.1.3. South Korea

            13.2.1.4. India

            13.2.1.5. Rest of Asia Pacific

        13.2.2. By Product Type

        13.2.3. By Material Type

        13.2.4. By Price Range 

        13.2.5. By Sales Channels 

    13.3. Market Attractiveness Analysis

        13.3.1. By Country

        13.3.2. By Product Type

        13.3.3. By Material Type

        13.3.4. By Price Range 

        13.3.5. By Sales Channels 

    13.4. Key Takeaways

14. MEA Mascara Applicators Market Analysis 2017-2021 and Forecast 2022-2032, By Country

    14.1. Historical Market Size Value (US$ Mn) & Volume (Mn units) Trend Analysis By Market Taxonomy, 2017-2021

    14.2. Market Size Value (US$ Mn) & Volume (Mn units) Forecast By Market Taxonomy, 2022-2032

        14.2.1. By Country

            14.2.1.1. GCC

            14.2.1.2. Rest of MEA

        14.2.2. By Product Type

        14.2.3. By Material Type

        14.2.4. By Price Range 

        14.2.5. By Sales Channels 

    14.3. Market Attractiveness Analysis

        14.3.1. By Country

        14.3.2. By Product Type

        14.3.3. By Material Type

        14.3.4. By Price Range 

        14.3.5. By Sales Channels 

    14.4. Key Takeaways

15. Key Countries Mascara Applicators Market Analysis

    15.1. U.S.

        15.1.1. Pricing Analysis

        15.1.2. Market Share Analysis, 2021

            15.1.2.1. By Product Type

            15.1.2.2. By Material Type

            15.1.2.3. By Price Range 

            15.1.2.4. By Sales Channels 

    15.2. Canada

        15.2.1. Pricing Analysis

        15.2.2. Market Share Analysis, 2021

            15.2.2.1. By Product Type

            15.2.2.2. By Material Type

            15.2.2.3. By Price Range 

            15.2.2.4. By Sales Channels 

    15.3. Brazil

        15.3.1. Pricing Analysis

        15.3.2. Market Share Analysis, 2021

            15.3.2.1. By Product Type

            15.3.2.2. By Material Type

            15.3.2.3. By Price Range 

            15.3.2.4. By Sales Channels 

    15.4. Mexico

        15.4.1. Pricing Analysis

        15.4.2. Market Share Analysis, 2021

            15.4.2.1. By Product Type

            15.4.2.2. By Material Type

            15.4.2.3. By Price Range 

            15.4.2.4. By Sales Channels 

    15.5. Argentina

        15.5.1. Pricing Analysis

        15.5.2. Market Share Analysis, 2021

            15.5.2.1. By Product Type

            15.5.2.2. By Material Type

            15.5.2.3. By Price Range 

            15.5.2.4. By Sales Channels 

    15.6. Germany

        15.6.1. Pricing Analysis

        15.6.2. Market Share Analysis, 2021

            15.6.2.1. By Product Type

            15.6.2.2. By Material Type

            15.6.2.3. By Price Range 

            15.6.2.4. By Sales Channels 

    15.7. Italy

        15.7.1. Pricing Analysis

        15.7.2. Market Share Analysis, 2021

            15.7.2.1. By Product Type

            15.7.2.2. By Material Type

            15.7.2.3. By Price Range 

            15.7.2.4. By Sales Channels 

    15.8. France

        15.8.1. Pricing Analysis

        15.8.2. Market Share Analysis, 2021

            15.8.2.1. By Product Type

            15.8.2.2. By Material Type

            15.8.2.3. By Price Range 

            15.8.2.4. By Sales Channels 

    15.9. U.K.

        15.9.1. Pricing Analysis

        15.9.2. Market Share Analysis, 2021

            15.9.2.1. By Product Type

            15.9.2.2. By Material Type

            15.9.2.3. By Price Range 

            15.9.2.4. By Sales Channels 

    15.10. Spain

        15.10.1. Pricing Analysis

        15.10.2. Market Share Analysis, 2021

            15.10.2.1. By Product Type

            15.10.2.2. By Material Type

            15.10.2.3. By Price Range 

            15.10.2.4. By Sales Channels 

    15.11. Russia

        15.11.1. Pricing Analysis

        15.11.2. Market Share Analysis, 2021

            15.11.2.1. By Product Type

            15.11.2.2. By Material Type

            15.11.2.3. By Price Range 

            15.11.2.4. By Sales Channels 

    15.12. BENELUX

        15.12.1. Pricing Analysis

        15.12.2. Market Share Analysis, 2021

            15.12.2.1. By Product Type

            15.12.2.2. By Material Type

            15.12.2.3. By Price Range 

            15.12.2.4. By Sales Channels 

    15.13. China

        15.13.1. Pricing Analysis

        15.13.2. Market Share Analysis, 2021

            15.13.2.1. By Product Type

            15.13.2.2. By Material Type

            15.13.2.3. By Price Range 

            15.13.2.4. By Sales Channels 

    15.14. Japan

        15.14.1. Pricing Analysis

        15.14.2. Market Share Analysis, 2021

            15.14.2.1. By Product Type

            15.14.2.2. By Material Type

            15.14.2.3. By Price Range 

            15.14.2.4. By Sales Channels 

    15.15. South Korea

        15.15.1. Pricing Analysis

        15.15.2. Market Share Analysis, 2021

            15.15.2.1. By Product Type

            15.15.2.2. By Material Type

            15.15.2.3. By Price Range 

            15.15.2.4. By Sales Channels 

    15.16. India

        15.16.1. Pricing Analysis

        15.16.2. Market Share Analysis, 2021

            15.16.2.1. By Product Type

            15.16.2.2. By Material Type

            15.16.2.3. By Price Range 

            15.16.2.4. By Sales Channels 

    15.17. GCC Countries

        15.17.1. Pricing Analysis

        15.17.2. Market Share Analysis, 2021

            15.17.2.1. By Product Type

            15.17.2.2. By Material Type

            15.17.2.3. By Price Range 

            15.17.2.4. By Sales Channels 

16. Market Structure Analysis

    16.1. Competition Dashboard

    16.2. Competition Benchmarking

    16.3. Market Share Analysis of Top Players

        16.3.1. By Regional

        16.3.2. By Product Type

        16.3.3. By Material Type

        16.3.4. By Price Range 

        16.3.5. By Sales Channels 

17. Competition Analysis

    17.1. Competition Deep Dive

        17.1.1. Markwins International

            17.1.1.1. Overview

            17.1.1.2. Product Portfolio

            17.1.1.3. Profitability by Market Segment

            17.1.1.4. Sales Footprint

            17.1.1.5. Strategy Overview

                17.1.1.5.1. Marketing Strategy

                17.1.1.5.2. Product Strategy

        17.1.2. East Majik Creative LLC.

            17.1.2.1. Overview

            17.1.2.2. Product Portfolio

            17.1.2.3. Profitability by Market Segment

            17.1.2.4. Sales Footprint

            17.1.2.5. Strategy Overview

                17.1.2.5.1. Marketing Strategy

                17.1.2.5.2. Product Strategy

        17.1.3. Gospire, Ebates Inc.

            17.1.3.1. Overview

            17.1.3.2. Product Portfolio

            17.1.3.3. Profitability by Market Segment

            17.1.3.4. Sales Footprint

            17.1.3.5. Strategy Overview

                17.1.3.5.1. Marketing Strategy

                17.1.3.5.2. Product Strategy

        17.1.4. Anisa International

            17.1.4.1. Overview

            17.1.4.2. Product Portfolio

            17.1.4.3. Profitability by Market Segment

            17.1.4.4. Sales Footprint

            17.1.4.5. Strategy Overview

                17.1.4.5.1. Marketing Strategy

                17.1.4.5.2. Product Strategy

        17.1.5. Cospack America Corporation

            17.1.5.1. Overview

            17.1.5.2. Product Portfolio

            17.1.5.3. Profitability by Market Segment

            17.1.5.4. Sales Footprint

            17.1.5.5. Strategy Overview

                17.1.5.5.1. Marketing Strategy

                17.1.5.5.2. Product Strategy

        17.1.6. International Cosmetic Suppliers Ltd.

            17.1.6.1. Overview

            17.1.6.2. Product Portfolio

            17.1.6.3. Profitability by Market Segment

            17.1.6.4. Sales Footprint

            17.1.6.5. Strategy Overview

                17.1.6.5.1. Marketing Strategy

                17.1.6.5.2. Product Strategy

        17.1.7. Unique Specialty Products Ltd.

            17.1.7.1. Overview

            17.1.7.2. Product Portfolio

            17.1.7.3. Profitability by Market Segment

            17.1.7.4. Sales Footprint

            17.1.7.5. Strategy Overview

                17.1.7.5.1. Marketing Strategy

                17.1.7.5.2. Product Strategy

        17.1.8. Yuan Harng Co. Ltd.

            17.1.8.1. Overview

            17.1.8.2. Product Portfolio

            17.1.8.3. Profitability by Market Segment

            17.1.8.4. Sales Footprint

            17.1.8.5. Strategy Overview

                17.1.8.5.1. Marketing Strategy

                17.1.8.5.2. Product Strategy

        17.1.9. Well Lord Inc

            17.1.9.1. Overview

            17.1.9.2. Product Portfolio

            17.1.9.3. Profitability by Market Segment

            17.1.9.4. Sales Footprint

            17.1.9.5. Strategy Overview

                17.1.9.5.1. Marketing Strategy

                17.1.9.5.2. Product Strategy

        17.1.10. Baralan USA

            17.1.10.1. Overview

            17.1.10.2. Product Portfolio

            17.1.10.3. Profitability by Market Segment

            17.1.10.4. Sales Footprint

            17.1.10.5. Strategy Overview

                17.1.10.5.1. Marketing Strategy

                17.1.10.5.2. Product Strategy

        17.1.11. Sulzer

            17.1.11.1. Overview

            17.1.11.2. Product Portfolio

            17.1.11.3. Profitability by Market Segment

            17.1.11.4. Sales Footprint

            17.1.11.5. Strategy Overview

                17.1.11.5.1. Marketing Strategy

                17.1.11.5.2. Product Strategy

        17.1.12. Albéa, 

            17.1.12.1. Overview

            17.1.12.2. Product Portfolio

            17.1.12.3. Profitability by Market Segment

            17.1.12.4. Sales Footprint

            17.1.12.5. Strategy Overview

                17.1.12.5.1. Marketing Strategy

                17.1.12.5.2. Product Strategy

        17.1.13. Covergirl

            17.1.13.1. Overview

            17.1.13.2. Product Portfolio

            17.1.13.3. Profitability by Market Segment

            17.1.13.4. Sales Footprint

            17.1.13.5. Strategy Overview

                17.1.13.5.1. Marketing Strategy

                17.1.13.5.2. Product Strategy

        17.1.14. EZGO

            17.1.14.1. Overview

            17.1.14.2. Product Portfolio

            17.1.14.3. Profitability by Market Segment

            17.1.14.4. Sales Footprint

            17.1.14.5. Strategy Overview

                17.1.14.5.1. Marketing Strategy

                17.1.14.5.2. Product Strategy

        17.1.15. Tbestmax

            17.1.15.1. Overview

            17.1.15.2. Product Portfolio

            17.1.15.3. Profitability by Market Segment

            17.1.15.4. Sales Footprint

            17.1.15.5. Strategy Overview

                17.1.15.5.1. Marketing Strategy

                17.1.15.5.2. Product Strategy

18. Assumptions & Acronyms Used

19. Research Methodology

List of Tables

Table 1: Global Mascara Applicators Market Value (US$ Mn) Forecast by Region, 2017-2032

Table 2: Global Mascara Applicators Market Volume (Mn units) Forecast by Region, 2017-2032

Table 3: Global Mascara Applicators Market Value (US$ Mn) Forecast by Product Type, 2017-2032

Table 4: Global Mascara Applicators Market Volume (Mn units) Forecast by Product Type, 2017-2032

Table 5: Global Mascara Applicators Market Value (US$ Mn) Forecast by Material Type, 2017-2032

Table 6: Global Mascara Applicators Market Volume (Mn units) Forecast by Material Type, 2017-2032

Table 7: Global Mascara Applicators Market Value (US$ Mn) Forecast by Price Range , 2017-2032

Table 8: Global Mascara Applicators Market Volume (Mn units) Forecast by Price Range , 2017-2032

Table 9: Global Mascara Applicators Market Value (US$ Mn) Forecast by Sales Channels , 2017-2032

Table 10: Global Mascara Applicators Market Volume (Mn units) Forecast by Sales Channels , 2017-2032

Table 11: North America Mascara Applicators Market Value (US$ Mn) Forecast by Country, 2017-2032

Table 12: North America Mascara Applicators Market Volume (Mn units) Forecast by Country, 2017-2032

Table 13: North America Mascara Applicators Market Value (US$ Mn) Forecast by Product Type, 2017-2032

Table 14: North America Mascara Applicators Market Volume (Mn units) Forecast by Product Type, 2017-2032

Table 15: North America Mascara Applicators Market Value (US$ Mn) Forecast by Material Type, 2017-2032

Table 16: North America Mascara Applicators Market Volume (Mn units) Forecast by Material Type, 2017-2032

Table 17: North America Mascara Applicators Market Value (US$ Mn) Forecast by Price Range , 2017-2032

Table 18: North America Mascara Applicators Market Volume (Mn units) Forecast by Price Range , 2017-2032

Table 19: North America Mascara Applicators Market Value (US$ Mn) Forecast by Sales Channels , 2017-2032

Table 20: North America Mascara Applicators Market Volume (Mn units) Forecast by Sales Channels , 2017-2032

Table 21: Latin America Mascara Applicators Market Value (US$ Mn) Forecast by Country, 2017-2032

Table 22: Latin America Mascara Applicators Market Volume (Mn units) Forecast by Country, 2017-2032

Table 23: Latin America Mascara Applicators Market Value (US$ Mn) Forecast by Product Type, 2017-2032

Table 24: Latin America Mascara Applicators Market Volume (Mn units) Forecast by Product Type, 2017-2032

Table 25: Latin America Mascara Applicators Market Value (US$ Mn) Forecast by Material Type, 2017-2032

Table 26: Latin America Mascara Applicators Market Volume (Mn units) Forecast by Material Type, 2017-2032

Table 27: Latin America Mascara Applicators Market Value (US$ Mn) Forecast by Price Range , 2017-2032

Table 28: Latin America Mascara Applicators Market Volume (Mn units) Forecast by Price Range , 2017-2032

Table 29: Latin America Mascara Applicators Market Value (US$ Mn) Forecast by Sales Channels , 2017-2032

Table 30: Latin America Mascara Applicators Market Volume (Mn units) Forecast by Sales Channels , 2017-2032

Table 31: Europe Mascara Applicators Market Value (US$ Mn) Forecast by Country, 2017-2032

Table 32: Europe Mascara Applicators Market Volume (Mn units) Forecast by Country, 2017-2032

Table 33: Europe Mascara Applicators Market Value (US$ Mn) Forecast by Product Type, 2017-2032

Table 34: Europe Mascara Applicators Market Volume (Mn units) Forecast by Product Type, 2017-2032

Table 35: Europe Mascara Applicators Market Value (US$ Mn) Forecast by Material Type, 2017-2032

Table 36: Europe Mascara Applicators Market Volume (Mn units) Forecast by Material Type, 2017-2032

Table 37: Europe Mascara Applicators Market Value (US$ Mn) Forecast by Price Range , 2017-2032

Table 38: Europe Mascara Applicators Market Volume (Mn units) Forecast by Price Range , 2017-2032

Table 39: Europe Mascara Applicators Market Value (US$ Mn) Forecast by Sales Channels , 2017-2032

Table 40: Europe Mascara Applicators Market Volume (Mn units) Forecast by Sales Channels , 2017-2032

Table 41: Asia Pacific Mascara Applicators Market Value (US$ Mn) Forecast by Country, 2017-2032

Table 42: Asia Pacific Mascara Applicators Market Volume (Mn units) Forecast by Country, 2017-2032

Table 43: Asia Pacific Mascara Applicators Market Value (US$ Mn) Forecast by Product Type, 2017-2032

Table 44: Asia Pacific Mascara Applicators Market Volume (Mn units) Forecast by Product Type, 2017-2032

Table 45: Asia Pacific Mascara Applicators Market Value (US$ Mn) Forecast by Material Type, 2017-2032

Table 46: Asia Pacific Mascara Applicators Market Volume (Mn units) Forecast by Material Type, 2017-2032

Table 47: Asia Pacific Mascara Applicators Market Value (US$ Mn) Forecast by Price Range , 2017-2032

Table 48: Asia Pacific Mascara Applicators Market Volume (Mn units) Forecast by Price Range , 2017-2032

Table 49: Asia Pacific Mascara Applicators Market Value (US$ Mn) Forecast by Sales Channels , 2017-2032

Table 50: Asia Pacific Mascara Applicators Market Volume (Mn units) Forecast by Sales Channels , 2017-2032

Table 51: MEA Mascara Applicators Market Value (US$ Mn) Forecast by Country, 2017-2032

Table 52: MEA Mascara Applicators Market Volume (Mn units) Forecast by Country, 2017-2032

Table 53: MEA Mascara Applicators Market Value (US$ Mn) Forecast by Product Type, 2017-2032

Table 54: MEA Mascara Applicators Market Volume (Mn units) Forecast by Product Type, 2017-2032

Table 55: MEA Mascara Applicators Market Value (US$ Mn) Forecast by Material Type, 2017-2032

Table 56: MEA Mascara Applicators Market Volume (Mn units) Forecast by Material Type, 2017-2032

Table 57: MEA Mascara Applicators Market Value (US$ Mn) Forecast by Price Range , 2017-2032

Table 58: MEA Mascara Applicators Market Volume (Mn units) Forecast by Price Range , 2017-2032

Table 59: MEA Mascara Applicators Market Value (US$ Mn) Forecast by Sales Channels , 2017-2032

Table 60: MEA Mascara Applicators Market Volume (Mn units) Forecast by Sales Channels , 2017-2032

List of Charts

Figure 1: Global Mascara Applicators Market Value (US$ Mn) by Product Type, 2022-2032

Figure 2: Global Mascara Applicators Market Value (US$ Mn) by Material Type, 2022-2032

Figure 3: Global Mascara Applicators Market Value (US$ Mn) by Price Range , 2022-2032

Figure 4: Global Mascara Applicators Market Value (US$ Mn) by Sales Channels , 2022-2032

Figure 5: Global Mascara Applicators Market Value (US$ Mn) by Region, 2022-2032

Figure 6: Global Mascara Applicators Market Value (US$ Mn) Analysis by Region, 2017-2032

Figure 7: Global Mascara Applicators Market Volume (Mn units) Analysis by Region, 2017-2032

Figure 8: Global Mascara Applicators Market Value Share (%) and BPS Analysis by Region, 2022-2032

Figure 9: Global Mascara Applicators Market Y-o-Y Growth (%) Projections by Region, 2022-2032

Figure 10: Global Mascara Applicators Market Value (US$ Mn) Analysis by Product Type, 2017-2032

Figure 11: Global Mascara Applicators Market Volume (Mn units) Analysis by Product Type, 2017-2032

Figure 12: Global Mascara Applicators Market Value Share (%) and BPS Analysis by Product Type, 2022-2032

Figure 13: Global Mascara Applicators Market Y-o-Y Growth (%) Projections by Product Type, 2022-2032

Figure 14: Global Mascara Applicators Market Value (US$ Mn) Analysis by Material Type, 2017-2032

Figure 15: Global Mascara Applicators Market Volume (Mn units) Analysis by Material Type, 2017-2032

Figure 16: Global Mascara Applicators Market Value Share (%) and BPS Analysis by Material Type, 2022-2032

Figure 17: Global Mascara Applicators Market Y-o-Y Growth (%) Projections by Material Type, 2022-2032

Figure 18: Global Mascara Applicators Market Value (US$ Mn) Analysis by Price Range , 2017-2032

Figure 19: Global Mascara Applicators Market Volume (Mn units) Analysis by Price Range , 2017-2032

Figure 20: Global Mascara Applicators Market Value Share (%) and BPS Analysis by Price Range , 2022-2032

Figure 21: Global Mascara Applicators Market Y-o-Y Growth (%) Projections by Price Range , 2022-2032

Figure 22: Global Mascara Applicators Market Value (US$ Mn) Analysis by Sales Channels , 2017-2032

Figure 23: Global Mascara Applicators Market Volume (Mn units) Analysis by Sales Channels , 2017-2032

Figure 24: Global Mascara Applicators Market Value Share (%) and BPS Analysis by Sales Channels , 2022-2032

Figure 25: Global Mascara Applicators Market Y-o-Y Growth (%) Projections by Sales Channels , 2022-2032

Figure 26: Global Mascara Applicators Market Attractiveness by Product Type, 2022-2032

Figure 27: Global Mascara Applicators Market Attractiveness by Material Type, 2022-2032

Figure 28: Global Mascara Applicators Market Attractiveness by Price Range , 2022-2032

Figure 29: Global Mascara Applicators Market Attractiveness by Sales Channels , 2022-2032

Figure 30: Global Mascara Applicators Market Attractiveness by Region, 2022-2032

Figure 31: North America Mascara Applicators Market Value (US$ Mn) by Product Type, 2022-2032

Figure 32: North America Mascara Applicators Market Value (US$ Mn) by Material Type, 2022-2032

Figure 33: North America Mascara Applicators Market Value (US$ Mn) by Price Range , 2022-2032

Figure 34: North America Mascara Applicators Market Value (US$ Mn) by Sales Channels , 2022-2032

Figure 35: North America Mascara Applicators Market Value (US$ Mn) by Country, 2022-2032

Figure 36: North America Mascara Applicators Market Value (US$ Mn) Analysis by Country, 2017-2032

Figure 37: North America Mascara Applicators Market Volume (Mn units) Analysis by Country, 2017-2032

Figure 38: North America Mascara Applicators Market Value Share (%) and BPS Analysis by Country, 2022-2032

Figure 39: North America Mascara Applicators Market Y-o-Y Growth (%) Projections by Country, 2022-2032

Figure 40: North America Mascara Applicators Market Value (US$ Mn) Analysis by Product Type, 2017-2032

Figure 41: North America Mascara Applicators Market Volume (Mn units) Analysis by Product Type, 2017-2032

Figure 42: North America Mascara Applicators Market Value Share (%) and BPS Analysis by Product Type, 2022-2032

Figure 43: North America Mascara Applicators Market Y-o-Y Growth (%) Projections by Product Type, 2022-2032

Figure 44: North America Mascara Applicators Market Value (US$ Mn) Analysis by Material Type, 2017-2032

Figure 45: North America Mascara Applicators Market Volume (Mn units) Analysis by Material Type, 2017-2032

Figure 46: North America Mascara Applicators Market Value Share (%) and BPS Analysis by Material Type, 2022-2032

Figure 47: North America Mascara Applicators Market Y-o-Y Growth (%) Projections by Material Type, 2022-2032

Figure 48: North America Mascara Applicators Market Value (US$ Mn) Analysis by Price Range , 2017-2032

Figure 49: North America Mascara Applicators Market Volume (Mn units) Analysis by Price Range , 2017-2032

Figure 50: North America Mascara Applicators Market Value Share (%) and BPS Analysis by Price Range , 2022-2032

Figure 51: North America Mascara Applicators Market Y-o-Y Growth (%) Projections by Price Range , 2022-2032

Figure 52: North America Mascara Applicators Market Value (US$ Mn) Analysis by Sales Channels , 2017-2032

Figure 53: North America Mascara Applicators Market Volume (Mn units) Analysis by Sales Channels , 2017-2032

Figure 54: North America Mascara Applicators Market Value Share (%) and BPS Analysis by Sales Channels , 2022-2032

Figure 55: North America Mascara Applicators Market Y-o-Y Growth (%) Projections by Sales Channels , 2022-2032

Figure 56: North America Mascara Applicators Market Attractiveness by Product Type, 2022-2032

Figure 57: North America Mascara Applicators Market Attractiveness by Material Type, 2022-2032

Figure 58: North America Mascara Applicators Market Attractiveness by Price Range , 2022-2032

Figure 59: North America Mascara Applicators Market Attractiveness by Sales Channels , 2022-2032

Figure 60: North America Mascara Applicators Market Attractiveness by Country, 2022-2032

Figure 61: Latin America Mascara Applicators Market Value (US$ Mn) by Product Type, 2022-2032

Figure 62: Latin America Mascara Applicators Market Value (US$ Mn) by Material Type, 2022-2032

Figure 63: Latin America Mascara Applicators Market Value (US$ Mn) by Price Range , 2022-2032

Figure 64: Latin America Mascara Applicators Market Value (US$ Mn) by Sales Channels , 2022-2032

Figure 65: Latin America Mascara Applicators Market Value (US$ Mn) by Country, 2022-2032

Figure 66: Latin America Mascara Applicators Market Value (US$ Mn) Analysis by Country, 2017-2032

Figure 67: Latin America Mascara Applicators Market Volume (Mn units) Analysis by Country, 2017-2032

Figure 68: Latin America Mascara Applicators Market Value Share (%) and BPS Analysis by Country, 2022-2032

Figure 69: Latin America Mascara Applicators Market Y-o-Y Growth (%) Projections by Country, 2022-2032

Figure 70: Latin America Mascara Applicators Market Value (US$ Mn) Analysis by Product Type, 2017-2032

Figure 71: Latin America Mascara Applicators Market Volume (Mn units) Analysis by Product Type, 2017-2032

Figure 72: Latin America Mascara Applicators Market Value Share (%) and BPS Analysis by Product Type, 2022-2032

Figure 73: Latin America Mascara Applicators Market Y-o-Y Growth (%) Projections by Product Type, 2022-2032

Figure 74: Latin America Mascara Applicators Market Value (US$ Mn) Analysis by Material Type, 2017-2032

Figure 75: Latin America Mascara Applicators Market Volume (Mn units) Analysis by Material Type, 2017-2032

Figure 76: Latin America Mascara Applicators Market Value Share (%) and BPS Analysis by Material Type, 2022-2032

Figure 77: Latin America Mascara Applicators Market Y-o-Y Growth (%) Projections by Material Type, 2022-2032

Figure 78: Latin America Mascara Applicators Market Value (US$ Mn) Analysis by Price Range , 2017-2032

Figure 79: Latin America Mascara Applicators Market Volume (Mn units) Analysis by Price Range , 2017-2032

Figure 80: Latin America Mascara Applicators Market Value Share (%) and BPS Analysis by Price Range , 2022-2032

Figure 81: Latin America Mascara Applicators Market Y-o-Y Growth (%) Projections by Price Range , 2022-2032

Figure 82: Latin America Mascara Applicators Market Value (US$ Mn) Analysis by Sales Channels , 2017-2032

Figure 83: Latin America Mascara Applicators Market Volume (Mn units) Analysis by Sales Channels , 2017-2032

Figure 84: Latin America Mascara Applicators Market Value Share (%) and BPS Analysis by Sales Channels , 2022-2032

Figure 85: Latin America Mascara Applicators Market Y-o-Y Growth (%) Projections by Sales Channels , 2022-2032

Figure 86: Latin America Mascara Applicators Market Attractiveness by Product Type, 2022-2032

Figure 87: Latin America Mascara Applicators Market Attractiveness by Material Type, 2022-2032

Figure 88: Latin America Mascara Applicators Market Attractiveness by Price Range , 2022-2032

Figure 89: Latin America Mascara Applicators Market Attractiveness by Sales Channels , 2022-2032

Figure 90: Latin America Mascara Applicators Market Attractiveness by Country, 2022-2032

Figure 91: Europe Mascara Applicators Market Value (US$ Mn) by Product Type, 2022-2032

Figure 92: Europe Mascara Applicators Market Value (US$ Mn) by Material Type, 2022-2032

Figure 93: Europe Mascara Applicators Market Value (US$ Mn) by Price Range , 2022-2032

Figure 94: Europe Mascara Applicators Market Value (US$ Mn) by Sales Channels , 2022-2032

Figure 95: Europe Mascara Applicators Market Value (US$ Mn) by Country, 2022-2032

Figure 96: Europe Mascara Applicators Market Value (US$ Mn) Analysis by Country, 2017-2032

Figure 97: Europe Mascara Applicators Market Volume (Mn units) Analysis by Country, 2017-2032

Figure 98: Europe Mascara Applicators Market Value Share (%) and BPS Analysis by Country, 2022-2032

Figure 99: Europe Mascara Applicators Market Y-o-Y Growth (%) Projections by Country, 2022-2032

Figure 100: Europe Mascara Applicators Market Value (US$ Mn) Analysis by Product Type, 2017-2032

Figure 101: Europe Mascara Applicators Market Volume (Mn units) Analysis by Product Type, 2017-2032

Figure 102: Europe Mascara Applicators Market Value Share (%) and BPS Analysis by Product Type, 2022-2032

Figure 103: Europe Mascara Applicators Market Y-o-Y Growth (%) Projections by Product Type, 2022-2032

Figure 104: Europe Mascara Applicators Market Value (US$ Mn) Analysis by Material Type, 2017-2032

Figure 105: Europe Mascara Applicators Market Volume (Mn units) Analysis by Material Type, 2017-2032

Figure 106: Europe Mascara Applicators Market Value Share (%) and BPS Analysis by Material Type, 2022-2032

Figure 107: Europe Mascara Applicators Market Y-o-Y Growth (%) Projections by Material Type, 2022-2032

Figure 108: Europe Mascara Applicators Market Value (US$ Mn) Analysis by Price Range , 2017-2032

Figure 109: Europe Mascara Applicators Market Volume (Mn units) Analysis by Price Range , 2017-2032

Figure 110: Europe Mascara Applicators Market Value Share (%) and BPS Analysis by Price Range , 2022-2032

Figure 111: Europe Mascara Applicators Market Y-o-Y Growth (%) Projections by Price Range , 2022-2032

Figure 112: Europe Mascara Applicators Market Value (US$ Mn) Analysis by Sales Channels , 2017-2032

Figure 113: Europe Mascara Applicators Market Volume (Mn units) Analysis by Sales Channels , 2017-2032

Figure 114: Europe Mascara Applicators Market Value Share (%) and BPS Analysis by Sales Channels , 2022-2032

Figure 115: Europe Mascara Applicators Market Y-o-Y Growth (%) Projections by Sales Channels , 2022-2032

Figure 116: Europe Mascara Applicators Market Attractiveness by Product Type, 2022-2032

Figure 117: Europe Mascara Applicators Market Attractiveness by Material Type, 2022-2032

Figure 118: Europe Mascara Applicators Market Attractiveness by Price Range , 2022-2032

Figure 119: Europe Mascara Applicators Market Attractiveness by Sales Channels , 2022-2032

Figure 120: Europe Mascara Applicators Market Attractiveness by Country, 2022-2032

Figure 121: Asia Pacific Mascara Applicators Market Value (US$ Mn) by Product Type, 2022-2032

Figure 122: Asia Pacific Mascara Applicators Market Value (US$ Mn) by Material Type, 2022-2032

Figure 123: Asia Pacific Mascara Applicators Market Value (US$ Mn) by Price Range , 2022-2032

Figure 124: Asia Pacific Mascara Applicators Market Value (US$ Mn) by Sales Channels , 2022-2032

Figure 125: Asia Pacific Mascara Applicators Market Value (US$ Mn) by Country, 2022-2032

Figure 126: Asia Pacific Mascara Applicators Market Value (US$ Mn) Analysis by Country, 2017-2032

Figure 127: Asia Pacific Mascara Applicators Market Volume (Mn units) Analysis by Country, 2017-2032

Figure 128: Asia Pacific Mascara Applicators Market Value Share (%) and BPS Analysis by Country, 2022-2032

Figure 129: Asia Pacific Mascara Applicators Market Y-o-Y Growth (%) Projections by Country, 2022-2032

Figure 130: Asia Pacific Mascara Applicators Market Value (US$ Mn) Analysis by Product Type, 2017-2032

Figure 131: Asia Pacific Mascara Applicators Market Volume (Mn units) Analysis by Product Type, 2017-2032

Figure 132: Asia Pacific Mascara Applicators Market Value Share (%) and BPS Analysis by Product Type, 2022-2032

Figure 133: Asia Pacific Mascara Applicators Market Y-o-Y Growth (%) Projections by Product Type, 2022-2032

Figure 134: Asia Pacific Mascara Applicators Market Value (US$ Mn) Analysis by Material Type, 2017-2032

Figure 135: Asia Pacific Mascara Applicators Market Volume (Mn units) Analysis by Material Type, 2017-2032

Figure 136: Asia Pacific Mascara Applicators Market Value Share (%) and BPS Analysis by Material Type, 2022-2032

Figure 137: Asia Pacific Mascara Applicators Market Y-o-Y Growth (%) Projections by Material Type, 2022-2032

Figure 138: Asia Pacific Mascara Applicators Market Value (US$ Mn) Analysis by Price Range , 2017-2032

Figure 139: Asia Pacific Mascara Applicators Market Volume (Mn units) Analysis by Price Range , 2017-2032

Figure 140: Asia Pacific Mascara Applicators Market Value Share (%) and BPS Analysis by Price Range , 2022-2032

Figure 141: Asia Pacific Mascara Applicators Market Y-o-Y Growth (%) Projections by Price Range , 2022-2032

Figure 142: Asia Pacific Mascara Applicators Market Value (US$ Mn) Analysis by Sales Channels , 2017-2032

Figure 143: Asia Pacific Mascara Applicators Market Volume (Mn units) Analysis by Sales Channels , 2017-2032

Figure 144: Asia Pacific Mascara Applicators Market Value Share (%) and BPS Analysis by Sales Channels , 2022-2032

Figure 145: Asia Pacific Mascara Applicators Market Y-o-Y Growth (%) Projections by Sales Channels , 2022-2032

Figure 146: Asia Pacific Mascara Applicators Market Attractiveness by Product Type, 2022-2032

Figure 147: Asia Pacific Mascara Applicators Market Attractiveness by Material Type, 2022-2032

Figure 148: Asia Pacific Mascara Applicators Market Attractiveness by Price Range , 2022-2032

Figure 149: Asia Pacific Mascara Applicators Market Attractiveness by Sales Channels , 2022-2032

Figure 150: Asia Pacific Mascara Applicators Market Attractiveness by Country, 2022-2032

Figure 151: MEA Mascara Applicators Market Value (US$ Mn) by Product Type, 2022-2032

Figure 152: MEA Mascara Applicators Market Value (US$ Mn) by Material Type, 2022-2032

Figure 153: MEA Mascara Applicators Market Value (US$ Mn) by Price Range , 2022-2032

Figure 154: MEA Mascara Applicators Market Value (US$ Mn) by Sales Channels , 2022-2032

Figure 155: MEA Mascara Applicators Market Value (US$ Mn) by Country, 2022-2032

Figure 156: MEA Mascara Applicators Market Value (US$ Mn) Analysis by Country, 2017-2032

Figure 157: MEA Mascara Applicators Market Volume (Mn units) Analysis by Country, 2017-2032

Figure 158: MEA Mascara Applicators Market Value Share (%) and BPS Analysis by Country, 2022-2032

Figure 159: MEA Mascara Applicators Market Y-o-Y Growth (%) Projections by Country, 2022-2032

Figure 160: MEA Mascara Applicators Market Value (US$ Mn) Analysis by Product Type, 2017-2032

Figure 161: MEA Mascara Applicators Market Volume (Mn units) Analysis by Product Type, 2017-2032

Figure 162: MEA Mascara Applicators Market Value Share (%) and BPS Analysis by Product Type, 2022-2032

Figure 163: MEA Mascara Applicators Market Y-o-Y Growth (%) Projections by Product Type, 2022-2032

Figure 164: MEA Mascara Applicators Market Value (US$ Mn) Analysis by Material Type, 2017-2032

Figure 165: MEA Mascara Applicators Market Volume (Mn units) Analysis by Material Type, 2017-2032

Figure 166: MEA Mascara Applicators Market Value Share (%) and BPS Analysis by Material Type, 2022-2032

Figure 167: MEA Mascara Applicators Market Y-o-Y Growth (%) Projections by Material Type, 2022-2032

Figure 168: MEA Mascara Applicators Market Value (US$ Mn) Analysis by Price Range , 2017-2032

Figure 169: MEA Mascara Applicators Market Volume (Mn units) Analysis by Price Range , 2017-2032

Figure 170: MEA Mascara Applicators Market Value Share (%) and BPS Analysis by Price Range , 2022-2032

Figure 171: MEA Mascara Applicators Market Y-o-Y Growth (%) Projections by Price Range , 2022-2032

Figure 172: MEA Mascara Applicators Market Value (US$ Mn) Analysis by Sales Channels , 2017-2032

Figure 173: MEA Mascara Applicators Market Volume (Mn units) Analysis by Sales Channels , 2017-2032

Figure 174: MEA Mascara Applicators Market Value Share (%) and BPS Analysis by Sales Channels , 2022-2032

Figure 175: MEA Mascara Applicators Market Y-o-Y Growth (%) Projections by Sales Channels , 2022-2032

Figure 176: MEA Mascara Applicators Market Attractiveness by Product Type, 2022-2032

Figure 177: MEA Mascara Applicators Market Attractiveness by Material Type, 2022-2032

Figure 178: MEA Mascara Applicators Market Attractiveness by Price Range , 2022-2032

Figure 179: MEA Mascara Applicators Market Attractiveness by Sales Channels , 2022-2032

Figure 180: MEA Mascara Applicators Market Attractiveness by Country, 2022-2032

Explore Consumer Product Insights

View Reports

Mascara Applicators Market