Reports

- Global Locations -

Headquarters

Future Market Insights, Inc.

Christiana Corporate, 200
Continental Drive, Suite 401,
Newark, Delaware - 19713,
United States

T: +1-347-918-3531

Americas

Future Market Insights, Inc.

616 Corporate Way, Suite 2-9018,
Valley Cottage, NY 10989, United States

MEA

Future Market Insights

1602-6 Jumeirah Bay X2 Tower, Plot No: JLT-PH2-X2A,
Jumeirah Lakes Towers, Dubai,
United Arab Emirates

Europe

Future Market Insights

3rd Floor, 207 Regent Street,
W1B 3HH London
United Kingdom

T: + 44 (0) 20 8123 9659

Asia Pacific

Future Market Insights

IndiaLand Global Tech Park, Unit UG-1, Behind Grand HighStreet, Phase 1, Hinjawadi, MH, Pune – 411057, India

Medicated Bath Additive Market Outlook for 2024 to 2034

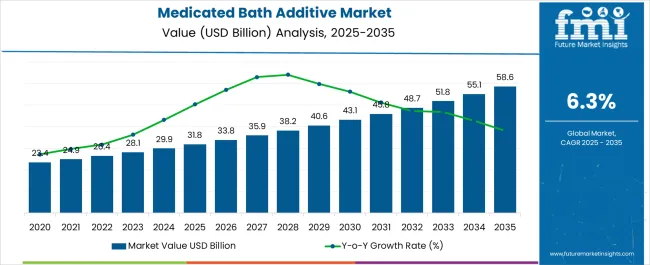
The medicated bath Additive market is projected to experience a CAGR of 6.6% during the forecast period. By 2034, the market value is estimated to reach US$ 56.7 billion, up from US$ 29.8 billion in 2024. The market value was estimated at US$ 28.0 billion at the end of 2023.

The medicated bath Additive market is witnessing significant growth owing to the surging demand for therapeutic products that can effectively treat diverse skin-related ailments and provide numerous benefits, such as stress relief, relaxation, and enhanced skin health. Furthermore, the market is expected to experience a further boost due to the rising preference for natural and organic products.

Market Analysis of the Medicated Bath Additive:

Growing awareness about personal hygiene issues, the need for improving skin tone, and boosting hair growth in both genders has increased the demand for bathing Additive. The market for medicated bath Additive is expected to grow significantly due to the growing trend of skincare routines. Therefore, there is a need to develop affordable bathing Additive products that can cater to the increasing demand in the market.

Attributes Details
Medicated Bath Additive Market Value for 2024 US$ 29.8 billion
Medicated Bath Additive Market Value for 2034 US$ 56.7 billion
Medicated Bath Additive Market Forecast CAGR for 2024 to 2034 6.6%

Don't pay for what you don't need

Customize your report by selecting specific countries or regions and save 30%!

Sales Analysis of Medicated Bath Additive from 2019 to 2023 Vs Market Outlook for 2024 to 2034

In 2023, medicated bath Additive accounted for around 59.3% of the total worth of the global market for bath and shower products, valued at US$ 44.7 billion.

The bath Additive increased at a CAGR of 5.7% from 2019 to 2023. The desire for a luxurious lifestyle, knowledge of personal hygiene, and worries about bacterial infections contribute to the market growth.

Attributes Key Statistics
Medicated Bath Additive Market Value for 2033 US$ 28.0 billion
Estimated Growth (2019 to 2023) 5.7% CAGR

The wide range of products available is driving the medicated bath Additive industry. Additionally, consumers are interested in bath soaps and shower gels with various fragrances and moisturizing properties. Consumers are prioritizing personal hygiene due to the need to protect against illnesses such as colds, Lassa fever, cholera, and other diseases. The increased awareness of the harmful effects of toxic chemicals on the skin has led key manufacturers to offer bath Additive with natural ingredients and fragrances, another factor contributing to the industry's growth.

  • For instance, according to the World Health Organization (WHO) recorded data on 23 October 2020 between March and October, over 50,250 people were impacted by the intervention in the government and humanitarian sectors with the intervention to wash hands properly and take care of personal hygiene.

Notable corporations are focused on launching innovative products in eco-friendly packaging to expand their range of offerings. In response to consumers' rising living standards, manufacturers are introducing premium products that feature unique and exotic ingredients.

The sales of medicated bath Additive worldwide have risen due to the surge of COVID-19 and online distribution channels. The global demand for cleaning products has increased significantly due to the pandemic.

Consumption Analysis of the Medicated Bath Additive Market

  • The demand for bath and shower products is expected to increase because bathing Additive cleanse the body and prevent bacterial, fungal, and parasitic infections. The bath and shower industry is also growing due to the implementation of effective marketing strategies, active social media promotion, and sponsorships from leading manufacturers.
  • There is a growing trend among consumers to opt for bathing Additive made of organic substances. Additionally, customers are increasingly choosing cruelty-free products, thereby boosting the market growth of bathing Additive in the forecast period. Moreover, the market expansion is driven by the rising disposable income and rapid urbanization.
  • Market players have ample opportunities for global expansion through ongoing innovations, product launches, and the development of products that cater specifically to men and women. The demand for services related to bathing Additive is expected to increase significantly during the forecasted period as key players focus on launching their products in environmentally friendly, sustainable packaging that can be recycled.
  • The application of chemical additions in bath soaps and shower gels is impeding the expansion of the bathing Additive market. Adverse side effects linked to some substances are causing concern. DIY methods and techniques encouraging consumers to produce organic goods at home are expected to hinder the market growth rate for bath and shower products. The coronavirus outbreak has severely impacted the market for bathing Additive.
Sabyasachi Ghosh
Sabyasachi Ghosh

Principal Consultant

Talk to Analyst

Find your sweet spots for generating winning opportunities in this market.

Comparative Analysis of the Adjacent Market

According to Future Market Insights, the medicated bath Additive market has three other related markets growing and presenting critical opportunities for players in the coming decade. The analysis finds that the demand for medicated bath Additive will surpass that of their counterparts due to solid growth and driving forces in the market.

Medicated Bath Additive Market:

Attributes Medicated Bath Additive Market
CAGR (2024 to 2034) 6.6%
Growth Factors
  • Rising demand for therapeutic products and the increasing popularity of natural and organic options.
Future Opportunities
  • Market players are expanding globally with innovative product launches and gender-specific offerings.
  • Demand for eco-friendly, recyclable packaging for bathing Additive is expected to rise.

Baby Bath and Shower Products Market:

Attributes Baby Bath and Shower Products Market
CAGR (2024 to 2034) 7.2%
Growth Factors
  • Sustainability is driving the use of eco-friendly packaging and products.
Future Opportunities
  • Adding interactive features to bath and shower products for kids creates a significant opportunity for manufacturers.

Preoperative Bathing Solution Market:

Attributes Preoperative Bathing Solution Market
CAGR (2024 to 2034) 4.6%
Growth Factors
  • SSIs are a critical concern in healthcare, requiring effective prevention strategies.
  • Infection control is increasingly important for all parties involved.
Future Opportunities
  • Effective infection control measures are becoming more necessary as the global number of surgical procedures rises.
  • The growing demand for surgical operations has resulted in expanded market opportunities.

Category-wise Insights

Bath Soaps Boosts the Global Medicated Bath Additive Market Growth

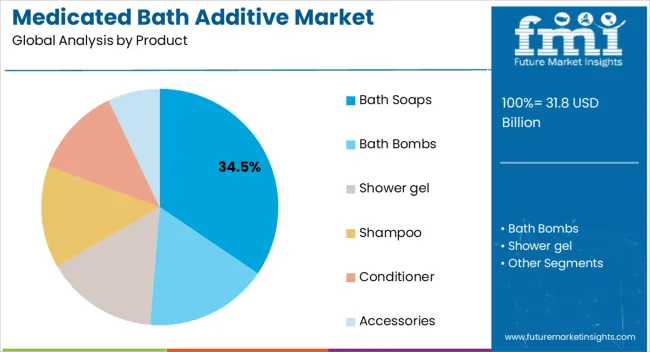
The medicated bath Additive are segmented into the following segments based on the product types: bath bombs, bath soaps, shower gel, shampoo, conditioner, and accessories.

In the global medicated bath Additive market in 2034, the bath soap product segment is expected to demonstrate remarkable growth and attain a market share of 33.2%. This segment is predicted to achieve a CAGR of about 6.5% by the end of the forecast period.

The popularity of bath soaps is attributed to the availability of soaps made from natural ingredients, which hold the highest value in this product segment. The trend toward using natural and herbal products has gained significant momentum, driving the demand for bath soaps and contributing to its maximum revenue generation within the product segment.

Product Type CAGR
Bath Bombs 7.0%
Bath Soaps 6.5%
Shower gel 7.3%
Shampoo 5.9%
Conditioner 6.9%
Accessories 5.6%

Manufacturers Prefer the General Stores for the Distribution of Medicated Bath Additive Products

The global market for medicated bath Additive is divided into several groups according to the consumer-accessible distribution channels. These include retail pharmacies, supermarkets/hypermarkets, online sales, general stores, and cosmetic stores. Among these, general stores have a substantial market share of 30.0% in 2023. This is because general stores offer a wide array of hair growth products from various brands and are conveniently located within residential areas, making them easily accessible to consumers. They have gained a strong foothold in the distribution channel hierarchy and are often preferred by a significant portion of the market.

Distribution Channel CAGR
Retail Pharmacies 5.4%
Supermarket/Hypermarket 6.0%
Online Sales 7.9%
General Stores 6.5%
Cosmetic Stores 7.7%

Get the data you need at a Fraction of the cost

Personalize your report by choosing insights you need
and save 40%!

Country-wise Insights

An analysis of the medicated bath Additive market is presented by country, with a focus on the United States, Germany, China, India, and the United Kingdom. The table displays the CAGR for each country, which indicates the anticipated growth of medicated bath Additive in each country until 2034.

Countries CAGR
United States 18.2%
China 5.6%
Germany 7.0%
India 11.9%
United Kingdom 4.7%

Utilization of Natural Materials in Medicated Bath Additive Products Favors United States Market

The United States dominates the global medicated bath Additive market, with a CAGR of 18.2% in 2024. This is due to the increasing demand for these products and significant investments by industry players. Moreover, manufacturers in the United States prioritize using safe and gentle ingredients on both adult and baby skin during production.

In the United States, manufacturers place a high priority on using ingredients throughout production that will not harm either a baby's or an adult's skin.

Rising Demand for Premium Medicated Bath Additive Product Boosting the Market in China

China's market for medicated bath Additives is expected to experience a moderate growth rate due to the country's increasing number of organic product producers. The market in China is expanding at a rapid pace, accounting for a CAGR of 5.6% of the global market. Organic cosmetics sales in China are expected to increase due to rising consumer awareness, changing lifestyles, higher disposable income, and improved health and environmental concerns.

Bathing Additive Innovation in Germany to Drive Sales of Medicated Bath Additive Products

The German medicated bath Additive market holds a CAGR of 7.0% of the global market in 2024 and is expected to grow at a lucrative rate during the forecast period. The market is expanding primarily due to ongoing product advancements, robust marketing campaigns, rising personal hygiene awareness, developing luxury and premium brands, and a solid social media presence. Additionally, around 8% of the value of German imports in terms of bath soaps in 2019 came from emerging nations. German manufacturers mainly focus on producing bathing Additive, especially bath soaps, propelling the market.

For instance, According to the CBI Ministry of Foreign Affairs on 20 August 2020, With a 15% share of all European imports, Germany continued to be the region's leading market for soap in 2019.

Changing Consumer Lifestyles Advancing the Medicated Bath Additive Market in India

India accounted for the CAGR of 11.9% in the global market, expecting continued profitable growth in the region. India's growing market share of bathing Additive is expected to continue its profitable growth in the coming years, primarily driven by government initiatives promoting cleanliness and hygiene.

Dettol is one of the companies that has actively supported the campaign by educating the rural population about their range of affordable products. The manufacturers have also responded to growing environmental concerns by developing eco-friendly products with natural ingredients, biodegradable, and refillable packaging.

Medicated Bath Additive Sector Advancing the Market Size in the United Kingdom

The United Kingdom holds a significant position in the global market. This prompts manufacturers to develop and execute diverse marketing strategies throughout the country. The launch of new products and changing consumer preferences, fuel market growth. As a result, key companies are investing substantial funds in the market to maximize production within the United Kingdom.
Competitive Landscape

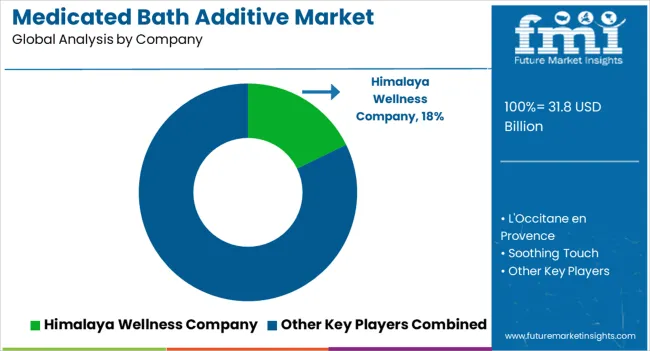
The production of medicated bath Additive is a fiercely competitive industry, where numerous small and large players compete for market share. This has resulted in a highly fragmented market, with companies resorting to strategies such as mergers, acquisitions, partnerships, and collaborations to stay ahead of the competition. Additionally, new product releases and innovation are commonplace as companies strive to meet customer demands and expand their customer base. The key players in the market include Unilever, P&G, L'Oréal, Johnson & Johnson, and Beiersdorf AG, among others.

Instances of key developmental strategies by the industry players in the market are given below:

  • On April 1, 2021, Olay Body launched three new Premium Body Care Collections: the dermatologist-designed collection, the Olay Cleansing & Renewing Body Care Duo with Retinol, and the Olay premium exfoliating body wash collection.
  • On 20 April 2021, Grapefruit Body Wash Refillable Pouch was introduced by Kiehl's. This body wash contains aloe vera, which is moisturizing and reparative, as well as salicylic acid, which fights acne, and moisturizing glycerin.

Key Companies in the Medicated Bath Additive Market

  • L'Occitane en Provence
  • Soothing Touch
  • Shanghai Jahwa United Co., Ltd
  • Kneipp
  • Westlab ltd
  • THE MOHER SOAP CO.
  • Borghese Inc
  • PrettyValley
  • Unilever
  • Reckitt Benckiser
  • L'Oreal Paris
  • Himalaya Wellness Company

Key Market Segments Covered in Medicated Bath Additive Industry Research

By Product:

  • Bath Bombs
  • Bath Soaps
  • Shower gel
  • Shampoo
  • Conditioner
  • Accessories

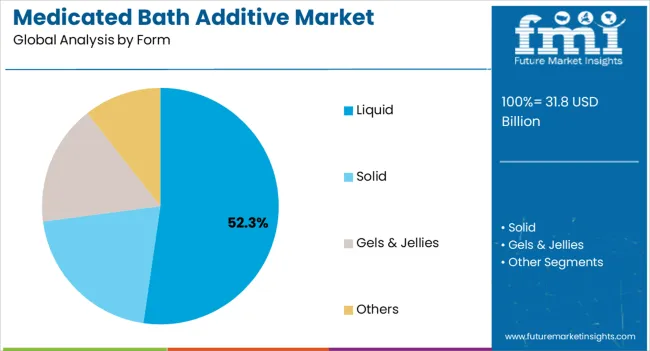
By Form:

  • Solid
  • Gels & Jellies
  • Liquid
  • Others

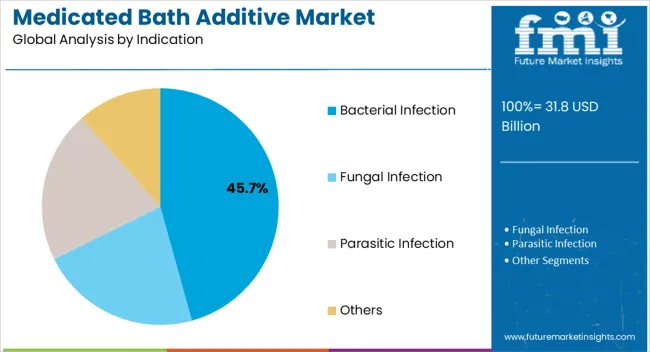
By Indication:

  • Bacterial Infection
  • Fungal Infection
  • Parasitic Infection
  • Others

By Gender:

  • Male
  • Female

By Distribution Channel:

  • Retail Pharmacies
  • Supermarket/Hypermarket
  • Online Sales
  • General Stores
  • Cosmetic Stores

By Region:

  • North America
  • Europe
  • Asia Pacific
  • Latin America
  • The Middle East & Africa

Frequently Asked Questions

What are the Key Trends Shaping the Medicated Bath Additive Industry?

The growth in bacterial and fungal infections, rising pollution, and awareness about personal hygiene.

What is the United States Market Outlook for Medicated Bath Additive?

The United States accounted for about 89.9% of the North American medicated bath Additive market in 2023.

What is the Sales Forecast for the Medicated Bath Additive Market Through 2034?

The market is expected to reach US$ 56.7 billion by the end of 2034.

How much is the Medicated Bath Additive Market Worth in 2024?

The global market is likely to be worth US$ 29.8 billion in 2024.

Which Countries are the Key Producers of Medicated Bath Additive?

Medicated bath Additive are mostly produced in the United States and India.

Table of Content

1. Executive Summary

    1.1. Global Market Outlook

    1.2. Demand Side Trends

    1.3. Supply Side Trends

    1.4. Market Round Offs

    1.5. FMI Analysis and Recommendations

2. Market Overview

    2.1. Market Coverage / Taxonomy

    2.2. Market Definition / Scope / Limitations

    2.3. Inclusions/Exclusions

3. Brand Mapping Analysis

    3.1. Price v/s Product

    3.2. Value for Money

    3.3. Top of Mind Bathing Additives Brands

    3.4. Brand Portfolio-by Key Players

    3.5. Brand Loyalty Mapping

    3.6. Usage Pattern Overview

    3.7. Branded vs Unbranded-Market Mix

4. Distribution Channel Wise Key Brand Positioning

    4.1. Global Top Retailers and their Brand Offerings

        4.1.1. Retail Pharmacies

        4.1.2. Supermarket/Hypermarket

        4.1.3. Online Sales

        4.1.4. General Stores

        4.1.5. Cosmetic Stores

    4.2. Retail Pricing Strategies

5. Consumer Buying Behavior Analysis

    5.1. Functionality and Product Demand

        5.1.1. Bath Bombs

        5.1.2. Bath Soups

        5.1.3. Shower gel

        5.1.4. Shampoo

        5.1.5. Conditioner

        5.1.6. Accessories

    5.2. What factors do you consider when deciding to purchase bathing additives?

    5.3. How important are product certifications when choosing bathing additives?

    5.4. How important is the brand reputation and recognition when selecting bathing additives?

    5.5. What marketing channels do you prefer for learning about new bathing additives?

    5.6. How often do you purchase new bathing additives?

        5.6.1. Once or More Every Month

        5.6.2. Once Every 2 months

        5.6.3. Once Every 6 Months

        5.6.4. Once a Year

        5.6.5. Less Than Once A Year

6. Market Trends & Dynamics

    6.1. Per Capita Spending on Bathing Additives

    6.2. Key Trends Impacting the Market

    6.3. Product Innovation / Development Trends

        6.3.1. Latest Trends and Demands

        6.3.2. Latest Innovations and New Launches

    6.4. Future Prospects of Organic Cosmetics Industry

    6.5. Market Dynamics

        6.5.1. Drivers

        6.5.2. Restraints

        6.5.3. Opportunity Analysis

7. Value Added Insights

    7.1. Product Adoption / Usage Analysis

    7.2. New Product Launches

    7.3. Value chain Analysis

    7.4. PESTEL Analysis

    7.5. Porter’s Analysis

    7.6. Product Features/ USPs

    7.7. Key Promotional Strategies, By Key Manufacturers

    7.8. Regulatory Landscape

8. Market Background

    8.1. Macro-Economic Factors

        8.1.1. Global GDP Growth Outlook

        8.1.2. Global Healthcare Expenditure

        8.1.3. Global Bath and Shower Products Market Overview

    8.2. Forecast Factors - Relevance & Impact

        8.2.1. Top Companies Historical Growth

        8.2.2. Key Player’s Historic Growth

        8.2.3. Market Consolidation Activities

        8.2.4. New Product Launches / Approvals

        8.2.5. Rising Prevalence of Skin Disease

        8.2.6. Increasing Demand of Herbal Products

        8.2.7. Collaborations and Agreements between Manufacturers

9. Global Market Demand Analysis 2017 to 2022 and Forecast, 2023 to 2033

    9.1. Historical Market Volume (Units) Analysis, 2017 to 2022

    9.2. Current and Future Market Volume (Units) Projections, 2023 to 2033

        9.2.1. Y-o-Y Growth Trend Analysis *Per Capita Consumption

10. Global Market - Pricing Analysis

    10.1. Regional Pricing Analysis By Product

    10.2. Global Average Pricing Analysis Benchmark

    10.3. Pricing Assumptions

11. Global Market Demand (in Value or Size in US$ Million) Analysis 2017 to 2022 and Forecast, 2023 to 2033

    11.1. Historical Market Value (US$ Million) Analysis, 2017 to 2022

    11.2. Current and Future Market Value (US$ Million) Projections, 2023 to 2033

        11.2.1. Y-o-Y Growth Trend Analysis

        11.2.2. Absolute $ Opportunity Analysis

12. Global Market Analysis 2017 to 2022 and Forecast 2023 to 2033, by Product 

    12.1. Introduction / Key Findings

    12.2. Historical Market Size (US$ Million) and Volume (Units) Analysis By Product, 2017 to 2022

    12.3. Current and Future Market Size (US$ Million) and Volume (Units) Analysis and Forecast By Product, 2023 to 2033

        12.3.1. Bath Bombs

        12.3.2. Bath Soups

        12.3.3. Shower gel

        12.3.4. Shampoo

        12.3.5. Conditioner

        12.3.6. Accessories

    12.4. Market Attractiveness Analysis By Product

13. Global Market Analysis 2017 to 2022 and Forecast 2023 to 2033, By Form

    13.1. Introduction / Key Findings

    13.2. Historical Market Size (US$ Million) Analysis By Form, 2017 to 2022

    13.3. Current and Future Market Size (US$ Million) Analysis and Forecast By Form, 2023 to 2033

        13.3.1. Solid

        13.3.2. Gels & Jellies

        13.3.3. Liquid

        13.3.4. Others

    13.4. Market Attractiveness Analysis By Form

14. Global Market Analysis 2017 to 2022 and Forecast 2023 to 2033, By Indication

    14.1. Introduction / Key Findings

    14.2. Historical Market Size (US$ Million) Analysis By Indication, 2017 to 2022

    14.3. Current and Future Market Size (US$ Million) Analysis and Forecast By Indication, 2023 to 2033

        14.3.1. Bacterial Infection

        14.3.2. Fungal Infection

        14.3.3. Parasitic Infection

        14.3.4. Others

    14.4. Market Attractiveness Analysis By Indication

15. Global Market Analysis 2017 to 2022 and Forecast 2023 to 2033, By Gender

    15.1. Introduction / Key Findings

    15.2. Historical Market Size (US$ Million) Analysis By Gender, 2017 to 2022

    15.3. Current and Future Market Size (US$ Million) Analysis and Forecast By Gender, 2023 to 2033

        15.3.1. Male

        15.3.2. Female

    15.4. Market Attractiveness Analysis By Gender

16. Global Market Analysis 2017 to 2022 and Forecast 2023 to 2033, By Distribution Channel

    16.1. Introduction / Key Findings

    16.2. Historical Market Size (US$ Million) Analysis By Distribution Channel, 2017 to 2022

    16.3. Current and Future Market Size (US$ Million) Analysis and Forecast By Distribution Channel, 2023 to 2033

        16.3.1. Retail Pharmacies

        16.3.2. Supermarket/Hypermarket

        16.3.3. Online Sales

        16.3.4. General Stores

        16.3.5. Cosmetic Stores

    16.4. Market Attractiveness Analysis By Distribution Channel

17. Global Market Analysis 2017 to 2022 and Forecast 2023 to 2033, by Region

    17.1. Introduction

    17.2. Historical Market Size (US$ Million) Analysis By Region, 2017 to 2022

    17.3. Current and Future Market Size (US$ Million) and Volume (Units) Analysis and Forecast By Region, 2023 to 2033

        17.3.1. North America

        17.3.2. Latin America

        17.3.3. Europe

        17.3.4. South Asia

        17.3.5. East Asia

        17.3.6. Oceania

        17.3.7. Middle East & Africa

    17.4. Market Attractiveness Analysis By Region

18. North America Market Analysis 2017 to 2022 and Forecast 2023 to 2033

    18.1. Introduction

    18.2. Historical Market Size (US$ Million) and Volume (Units) Trend Analysis By Market Taxonomy, 2017 to 2022

    18.3. Current and Future Market Size (US$ Million) and Volume (Units) Analysis and Forecast By Market Taxonomy, 2023 to 2033

        18.3.1. By Country

            18.3.1.1. USA

            18.3.1.2. Canada

        18.3.2. By Product

        18.3.3. By Form

        18.3.4. By Indication

        18.3.5. By Gender

        18.3.6. By Distribution Channel

    18.4. Market Attractiveness Analysis

        18.4.1. By Country

        18.4.2. By Product

        18.4.3. By Form

        18.4.4. By Indication

        18.4.5. By Gender

        18.4.6. By Distribution Channel

    18.5. Market Trends

    18.6. Market Drivers & Restraints – Intensity Mapping

    18.7. Country Level Analysis & Forecast

        18.7.1. USA Market

            18.7.1.1. Introduction

            18.7.1.2. Market Analysis and Forecast by Market Taxonomy

                18.7.1.2.1. By Product Type

                18.7.1.2.2. By Form

                18.7.1.2.3. By Indication

                18.7.1.2.4. By Gender

                18.7.1.2.5. By Distribution Channel

        18.7.2. Canada Market

            18.7.2.1. Introduction

            18.7.2.2. Market Analysis and Forecast by Market Taxonomy

                18.7.2.2.1. By Product Type

                18.7.2.2.2. By Form

                18.7.2.2.3. By Indication

                18.7.2.2.4. By Gender

                18.7.2.2.5. By Distribution Channel

19. Latin America Market Analysis 2017 to 2022 and Forecast 2023 to 2033

    19.1. Introduction

    19.2. Historical Market Size (US$ Million) and Volume (Units) Trend Analysis By Market Taxonomy, 2017 to 2022

    19.3. Current and Future Market Size (US$ Million) and Volume (Units) Analysis and Forecast By Market Taxonomy, 2023 to 2033

        19.3.1. By Country

            19.3.1.1. Brazil

            19.3.1.2. Mexico

            19.3.1.3. Argentina

            19.3.1.4. Rest of LATAM

        19.3.2. By Product

        19.3.3. By Form

        19.3.4. By Indication

        19.3.5. By Gender

        19.3.6. By Distribution Channel

    19.4. Market Attractiveness Analysis

        19.4.1. By Country

        19.4.2. By Product

        19.4.3. By Form

        19.4.4. By Indication

        19.4.5. By Gender

        19.4.6. By Distribution Channel

    19.5. Market Trends

    19.6. Market Drivers & Restraints – Intensity Mapping

    19.7. Country Level Analysis & Forecast

        19.7.1. Brazil Market

            19.7.1.1. Introduction

            19.7.1.2. Market Analysis and Forecast by Market Taxonomy

                19.7.1.2.1. By Product Type

                19.7.1.2.2. By Form

                19.7.1.2.3. By Indication

                19.7.1.2.4. By Gender

                19.7.1.2.5. By Distribution Channel

        19.7.2. Mexico Market

            19.7.2.1. Introduction

            19.7.2.2. Market Analysis and Forecast by Market Taxonomy

                19.7.2.2.1. By Product Type

                19.7.2.2.2. By Form

                19.7.2.2.3. By Indication

                19.7.2.2.4. By Gender

                19.7.2.2.5. By Distribution Channel

        19.7.3. Argentina Market

            19.7.3.1. Introduction

            19.7.3.2. Market Analysis and Forecast by Market Taxonomy

                19.7.3.2.1. By Product Type

                19.7.3.2.2. By Form

                19.7.3.2.3. By Indication

                19.7.3.2.4. By Gender

                19.7.3.2.5. By Distribution Channel

20. Europe Market Analysis 2017 to 2022 and Forecast 2023 to 2033

    20.1. Introduction

    20.2. Historical Market Size (US$ Million) and Volume (Units) Trend Analysis By Market Taxonomy, 2017 to 2022

    20.3. Current and Future Market Size (US$ Million) and Volume (Units) Analysis and Forecast By Market Taxonomy, 2023 to 2033

        20.3.1. By Country

            20.3.1.1. UK

            20.3.1.2. Germany

            20.3.1.3. France

            20.3.1.4. Italy

            20.3.1.5. Spain

            20.3.1.6. BENELUX

            20.3.1.7. Russia

            20.3.1.8. Rest of Europe

        20.3.2. By Product

        20.3.3. By Form

        20.3.4. By Indication

        20.3.5. By Gender

        20.3.6. By Distribution Channel

    20.4. Market Attractiveness Analysis

        20.4.1. By Country

        20.4.2. By Product

        20.4.3. By Form

        20.4.4. By Indication

        20.4.5. By Gender

        20.4.6. By Distribution Channel

    20.5. Market Trends

    20.6. Market Drivers & Restraints – Intensity Mapping

    20.7. Country Level Analysis & Forecast

        20.7.1. UK Market

            20.7.1.1. Introduction

            20.7.1.2. Market Analysis and Forecast by Market Taxonomy

                20.7.1.2.1. By Product Type

                20.7.1.2.2. By Form

                20.7.1.2.3. By Indication

                20.7.1.2.4. By Gender

                20.7.1.2.5. By Distribution Channel

        20.7.2. Germany Market

            20.7.2.1. Introduction

            20.7.2.2. Market Analysis and Forecast by Market Taxonomy

                20.7.2.2.1. By Product Type

                20.7.2.2.2. By Form

                20.7.2.2.3. By Indication

                20.7.2.2.4. By Gender

                20.7.2.2.5. By Distribution Channel

        20.7.3. France Market

            20.7.3.1. Introduction

            20.7.3.2. Market Analysis and Forecast by Market Taxonomy

                20.7.3.2.1. By Product Type

                20.7.3.2.2. By Form

                20.7.3.2.3. By Indication

                20.7.3.2.4. By Gender

                20.7.3.2.5. By Distribution Channel

        20.7.4. Spain Market

            20.7.4.1. Introduction

            20.7.4.2. Market Analysis and Forecast by Market Taxonomy

                20.7.4.2.1. By Product Type

                20.7.4.2.2. By Form

                20.7.4.2.3. By Indication

                20.7.4.2.4. By Gender

                20.7.4.2.5. By Distribution Channel

        20.7.5. Italy Market

            20.7.5.1. Introduction

            20.7.5.2. Market Analysis and Forecast by Market Taxonomy

                20.7.5.2.1. By Product Type

                20.7.5.2.2. By Form

                20.7.5.2.3. By Indication

                20.7.5.2.4. By Gender

                20.7.5.2.5. By Distribution Channel

        20.7.6. BENELUX Market

            20.7.6.1. Introduction

            20.7.6.2. Market Analysis and Forecast by Market Taxonomy

                20.7.6.2.1. By Product Type

                20.7.6.2.2. By Form

                20.7.6.2.3. By Indication

                20.7.6.2.4. By Gender

                20.7.6.2.5. By Distribution Channel

        20.7.7. Russia Market

            20.7.7.1. Introduction

            20.7.7.2. Market Analysis and Forecast by Market Taxonomy

                20.7.7.2.1. By Product Type

                20.7.7.2.2. By Form

                20.7.7.2.3. By Indication

                20.7.7.2.4. By Gender

                20.7.7.2.5. By Distribution Channel

21. East Asia Market Analysis 2017 to 2022 and Forecast 2023 to 2033

    21.1. Introduction

    21.2. Historical Market Size (US$ Million) and Volume (Units) Trend Analysis By Market Taxonomy, 2017 to 2022

    21.3. Current and Future Market Size (US$ Million) and Volume (Units) Analysis and Forecast By Market Taxonomy, 2023 to 2033

        21.3.1. By Country

            21.3.1.1. China

            21.3.1.2. Japan

            21.3.1.3. South Korea

        21.3.2. By Product

        21.3.3. By Form

        21.3.4. By Indication

        21.3.5. By Gender

        21.3.6. By Distribution Channel

    21.4. Market Attractiveness Analysis

        21.4.1. By Country

        21.4.2. By Product

        21.4.3. By Form

        21.4.4. By Indication

        21.4.5. By Gender

        21.4.6. By Distribution Channel

    21.5. Market Trends

    21.6. Market Drivers & Restraints – Intensity Mapping

    21.7. Country Level Analysis & Forecast

        21.7.1. China Market

            21.7.1.1. Introduction

            21.7.1.2. Market Analysis and Forecast by Market Taxonomy

                21.7.1.2.1. By Product Type

                21.7.1.2.2. By Form

                21.7.1.2.3. By Indication

                21.7.1.2.4. By Gender

                21.7.1.2.5. By Distribution Channel

        21.7.2. Japan Market

            21.7.2.1. Introduction

            21.7.2.2. Market Analysis and Forecast by Market Taxonomy

                21.7.2.2.1. By Product Type

                21.7.2.2.2. By Form

                21.7.2.2.3. By Indication

                21.7.2.2.4. By Gender

                21.7.2.2.5. By Distribution Channel

        21.7.3. South Korea Market

            21.7.3.1. Introduction

            21.7.3.2. Market Analysis and Forecast by Market Taxonomy

                21.7.3.2.1. By Product Type

                21.7.3.2.2. By Form

                21.7.3.2.3. By Indication

                21.7.3.2.4. By Gender

                21.7.3.2.5. By Distribution Channel

22. South Asia Market Analysis 2017 to 2022 and Forecast 2023 to 2033

    22.1. Introduction

    22.2. Historical Market Size (US$ Million) and Volume (Units) Trend Analysis By Market Taxonomy, 2017 to 2022

    22.3. Current and Future Market Size (US$ Million) and Volume (Units) Analysis and Forecast By Market Taxonomy, 2023 to 2033

        22.3.1. By Country

            22.3.1.1. India

            22.3.1.2. Indonesia

            22.3.1.3. Thailand

            22.3.1.4. Malaysia

            22.3.1.5. Rest of South Asia

        22.3.2. By Product

        22.3.3. By Form

        22.3.4. By Indication

        22.3.5. By Gender

        22.3.6. By Distribution Channel

    22.4. Market Attractiveness Analysis

        22.4.1. By Country

        22.4.2. By Product

        22.4.3. By Form

        22.4.4. By Indication

        22.4.5. By Gender

        22.4.6. By Distribution Channel

    22.5. Market Trends

    22.6. Market Drivers & Restraints – Intensity Mapping

    22.7. Country Level Analysis & Forecast

        22.7.1. India Market

            22.7.1.1. Introduction

            22.7.1.2. Market Analysis and Forecast by Market Taxonomy

                22.7.1.2.1. By Product Type

                22.7.1.2.2. By Form

                22.7.1.2.3. By Indication

                22.7.1.2.4. By Gender

                22.7.1.2.5. By Distribution Channel

        22.7.2. Indonesia Market

            22.7.2.1. Introduction

            22.7.2.2. Market Analysis and Forecast by Market Taxonomy

                22.7.2.2.1. By Product Type

                22.7.2.2.2. By Form

                22.7.2.2.3. By Indication

                22.7.2.2.4. By Gender

                22.7.2.2.5. By Distribution Channel

        22.7.3. Thailand Market

            22.7.3.1. Introduction

            22.7.3.2. Market Analysis and Forecast by Market Taxonomy

                22.7.3.2.1. By Product Type

                22.7.3.2.2. By Form

                22.7.3.2.3. By Indication

                22.7.3.2.4. By Gender

                22.7.3.2.5. By Distribution Channel

        22.7.4. Malaysia Market

            22.7.4.1. Introduction

            22.7.4.2. Market Analysis and Forecast by Market Taxonomy

                22.7.4.2.1. By Product Type

                22.7.4.2.2. By Form

                22.7.4.2.3. By Indication

                22.7.4.2.4. By Gender

                22.7.4.2.5. By Distribution Channel

23. Oceania Market Analysis 2017 to 2022 and Forecast 2023 to 2033

    23.1. Introduction

    23.2. Historical Market Size (US$ Million) and Volume (Units) Trend Analysis By Market Taxonomy, 2017 to 2022

    23.3. Current and Future Market Size (US$ Million) and Volume (Units) Analysis and Forecast By Market Taxonomy, 2023 to 2033

        23.3.1. By Country

            23.3.1.1. Australia

            23.3.1.2. New Zealand

        23.3.2. By Product

        23.3.3. By Form

        23.3.4. By Indication

        23.3.5. By Gender

        23.3.6. By Distribution Channel

    23.4. Market Attractiveness Analysis

        23.4.1. By Country

        23.4.2. By Product

        23.4.3. By Form

        23.4.4. By Indication

        23.4.5. By Gender

        23.4.6. By Distribution Channel

    23.5. Market Trends

    23.6. Market Drivers & Restraints – Intensity Mapping

    23.7. Country Level Analysis & Forecast

        23.7.1. Australia Market

            23.7.1.1. Introduction

            23.7.1.2. Market Analysis and Forecast by Market Taxonomy

                23.7.1.2.1. By Product Type

                23.7.1.2.2. By Form

                23.7.1.2.3. By Indication

                23.7.1.2.4. By Gender

                23.7.1.2.5. By Distribution Channel

        23.7.2. New Zealand Market

            23.7.2.1. Introduction

            23.7.2.2. Market Analysis and Forecast by Market Taxonomy

                23.7.2.2.1. By Product Type

                23.7.2.2.2. By Form

                23.7.2.2.3. By Indication

                23.7.2.2.4. By Gender

                23.7.2.2.5. By Distribution Channel

24. Middle East & Africa Market Analysis 2017 to 2022 and Forecast 2023 to 2033

    24.1. Introduction

    24.2. Historical Market Size (US$ Million) and Volume (Units) Trend Analysis By Market Taxonomy, 2017 to 2022

    24.3. Current and Future Market Size (US$ Million) and Volume (Units) Analysis and Forecast By Market Taxonomy, 2023 to 2033

        24.3.1. By Country

            24.3.1.1. GCC Countries

            24.3.1.2. Türkiye

            24.3.1.3. South Africa

            24.3.1.4. North Africa

            24.3.1.5. Rest of MEA

        24.3.2. By Product

        24.3.3. By Form

        24.3.4. By Indication

        24.3.5. By Gender

        24.3.6. By Distribution Channel

    24.4. Market Attractiveness Analysis

        24.4.1. By Country

        24.4.2. By Product

        24.4.3. By Form

        24.4.4. By Indication

        24.4.5. By Gender

        24.4.6. By Distribution Channel

    24.5. Market Trends

    24.6. Market Drivers & Restraints – Intensity Mapping

    24.7. Country Level Analysis & Forecast

        24.7.1. GCC Countries Market

            24.7.1.1. Introduction

            24.7.1.2. Market Analysis and Forecast by Market Taxonomy

                24.7.1.2.1. By Product Type

                24.7.1.2.2. By Form

                24.7.1.2.3. By Indication

                24.7.1.2.4. By Gender

                24.7.1.2.5. By Distribution Channel

        24.7.2. Türkiye Market

            24.7.2.1. Introduction

            24.7.2.2. Market Analysis and Forecast by Market Taxonomy

                24.7.2.2.1. By Product Type

                24.7.2.2.2. By Form

                24.7.2.2.3. By Indication

                24.7.2.2.4. By Gender

                24.7.2.2.5. By Distribution Channel

        24.7.3. South Africa Market

            24.7.3.1. Introduction

            24.7.3.2. Market Analysis and Forecast by Market Taxonomy

                24.7.3.2.1. By Product Type

                24.7.3.2.2. By Form

                24.7.3.2.3. By Indication

                24.7.3.2.4. By Gender

                24.7.3.2.5. By Distribution Channel

        24.7.4. North Africa Market

            24.7.4.1. Introduction

            24.7.4.2. Market Analysis and Forecast by Market Taxonomy

                24.7.4.2.1. By Product Type

                24.7.4.2.2. By Form

                24.7.4.2.3. By Indication

                24.7.4.2.4. By Gender

                24.7.4.2.5. By Distribution Channel

25. Market Structure Analysis

    25.1. Market Analysis by Tier of Companies

    25.2. Market Share Analysis of Top Players

    25.3. Market Presence Analysis

26. Competition Analysis

    26.1. Competition Dashboard

    26.2. Branding and Promotional Strategies, By Key Players

    26.3. Key Development Analysis

    26.4. Competition Deep Dive

        26.4.1. L'Occitane en Provence

            26.4.1.1. Overview

            26.4.1.2. Product Portfolio

            26.4.1.3. Key Financials

            26.4.1.4. Sales Footprint

            26.4.1.5. Strategy Overview

                26.4.1.5.1. Marketing Strategy

                26.4.1.5.2. Component Type Strategy

                26.4.1.5.3. Channel Strategy

        26.4.2. Soothing Touch

        26.4.3. Shanghai Jahwa United Co.,

        26.4.4. Kneipp

        26.4.5. Westlab ltd

        26.4.6. THE MOHER SOAP CO.

        26.4.7. Borghese Inc

        26.4.8. PrettyValley,

        26.4.9. Unilever

        26.4.10. Reckitt Benckise

        26.4.11. L'Oreal Paris

        26.4.12. Himalaya Wellness Company

        26.4.13. Henkel

        26.4.14. Natura&Co

        26.4.15. Procter & Gamble

        26.4.16. Lion Corporation

        26.4.17. Johnson & Johnson Services, Inc

        26.4.18. Beiersdorf AG

        26.4.19. Estée Lauder

        26.4.20. Plum Island Soap Co

        26.4.21. Alticor

        26.4.22. Wipro Consumer Care and Lighting

        26.4.23. ADA Cosmetics

        26.4.24. AVON PRODUCTS

        26.4.25. Lush Retail Ltd

27. Assumptions and Acronyms Used

28. Research Methodology

List of Tables

Table 01: Global Market Value (US$ Million) Analysis and Forecast 2017 to 2033, by Product

Table 02: Global Market Volume (Units) Analysis and Forecast 2017 to 2033, by Product

Table 03: Global Market Value (US$ Million) Analysis and Forecast 2017 to 2033, by Form

Table 04: Global Market Value (US$ Million) Analysis and Forecast 2017 to 2033, by Indication

Table 05: Global Market Value (US$ Million) Analysis and Forecast 2017 to 2033, by Gender

Table 06: Global Market Value (US$ Million) Analysis and Forecast 2017 to 2033, by Distribution Channel

Table 07: North America Market Value (US$ Million) Analysis 2017 to 2022 and Forecast 2023 to 2033, by Country

Table 08: North America Market Value (US$ Million) Analysis and Forecast 2017 to 2033, by Product

Table 09: North America Market Volume (Units) Analysis and Forecast 2017 to 2033, by Product

Table 10: North America Market Value (US$ Million) Analysis and Forecast 2017 to 2033, by Form

Table 11: North America Market Value (US$ Million) Analysis and Forecast 2017 to 2033, by Indication

Table 12: North America Market Value (US$ Million) Analysis and Forecast 2017 to 2033, by Gender

Table 13: North America Market Value (US$ Million) Analysis and Forecast 2017 to 2033, by Distribution Channel

Table 14: Latin America Market Value (US$ Million) Analysis 2017 to 2022 and Forecast 2023 to 2033, by Country

Table 15: Latin America Market Value (US$ Million) Analysis and Forecast 2017 to 2033, by Product

Table 16: Latin America Market Volume (Units) Analysis and Forecast 2017 to 2033, by Product

Table 17: Latin America Market Value (US$ Million) Analysis and Forecast 2017 to 2033, by Form

Table 18: Latin America Market Value (US$ Million) Analysis and Forecast 2017 to 2033, by Indication

Table 19: Latin America Market Value (US$ Million) Analysis and Forecast 2017 to 2033, by Gender

Table 20: Latin America Market Value (US$ Million) Analysis and Forecast 2017 to 2033, by Distribution Channel

Table 21: Europe Market Value (US$ Million) Analysis 2017 to 2022 and Forecast 2023 to 2033, by Country

Table 22: Europe Market Value (US$ Million) Analysis and Forecast 2017 to 2033, by Product

Table 23: Europe Market Volume (Units) Analysis and Forecast 2017 to 2033, by Product

Table 24: Europe Market Value (US$ Million) Analysis and Forecast 2017 to 2033, by Form

Table 25: Europe Market Value (US$ Million) Analysis and Forecast 2017 to 2033, by Indication

Table 26: Europe Market Value (US$ Million) Analysis and Forecast 2017 to 2033, by Gender

Table 27: Europe Market Value (US$ Million) Analysis and Forecast 2017 to 2033, by Distribution Channel

Table 28: South Asia Market Value (US$ Million) Analysis 2017 to 2022 and Forecast 2023 to 2033, by Country

Table 29: South Asia Market Value (US$ Million) Analysis and Forecast 2017 to 2033, by Product

Table 30: South Asia Market Volume (Units) Analysis and Forecast 2017 to 2033, by Product

Table 31: South Asia Market Value (US$ Million) Analysis and Forecast 2017 to 2033, by Form

Table 32: South Asia Market Value (US$ Million) Analysis and Forecast 2017 to 2033, by Indication

Table 33: South Asia Market Value (US$ Million) Analysis and Forecast 2017 to 2033, by Gender

Table 34: South Asia Market Value (US$ Million) Analysis and Forecast 2017 to 2033, by Distribution Channel

Table 35: East Asia Market Value (US$ Million) Analysis 2017 to 2022 and Forecast 2023 to 2033, by Country

Table 36: East Asia Market Value (US$ Million) Analysis and Forecast 2017 to 2033, by Product

Table 37: East Asia Market Volume (Units) Analysis and Forecast 2017 to 2033, by Product

Table 38: East Asia Market Value (US$ Million) Analysis and Forecast 2017 to 2033, by Form

Table 39: East Asia Market Value (US$ Million) Analysis and Forecast 2017 to 2033, by Indication

Table 40: East Asia Market Value (US$ Million) Analysis and Forecast 2017 to 2033, by Gender

Table 41: East Asia Market Value (US$ Million) Analysis and Forecast 2017 to 2033, by Distribution Channel

Table 42: Oceania Market Value (US$ Million) Analysis 2017 to 2022 and Forecast 2023 to 2033, by Country

Table 43: Oceania Market Value (US$ Million) Analysis and Forecast 2017 to 2033, by Product

Table 44: Oceania Market Volume (Units) Analysis and Forecast 2017 to 2033, by Product

Table 45: Oceania Market Value (US$ Million) Analysis and Forecast 2017 to 2033, by Form

Table 46: Oceania Market Value (US$ Million) Analysis and Forecast 2017 to 2033, by Indication

Table 47: Oceania Market Value (US$ Million) Analysis and Forecast 2017 to 2033, by Gender

Table 48: Oceania Market Value (US$ Million) Analysis and Forecast 2017 to 2033, by Distribution Channel

Table 49: Middle East & Africa Market Value (US$ Million) Analysis 2017 to 2022 and Forecast 2023 to 2033, by Country

Table 50: Middle East & Africa Market Value (US$ Million) Analysis and Forecast 2017 to 2033, by Product

Table 51: Middle East & Africa Market Volume (Units) Analysis and Forecast 2017 to 2033, by Product

Table 52: Middle East & Africa Market Value (US$ Million) Analysis and Forecast 2017 to 2033, by Form

Table 53: Middle East & Africa Market Value (US$ Million) Analysis and Forecast 2017 to 2033, by Indication

Table 54: Middle East & Africa Market Value (US$ Million) Analysis and Forecast 2017 to 2033, by Gender

Table 55: Middle East & Africa Market Value (US$ Million) Analysis and Forecast 2017 to 2033, by Distribution Channel

List of Charts

Figure 01: Global Market Volume (Units), 2017 to 2022

Figure 02: Global Market Volume (Units) & Y-o-Y Growth (%) Analysis, 2023 to 2033

Figure 03: Pricing Analysis per unit (US$), in 2023

Figure 04: Pricing Forecast per unit (US$), in 2033

Figure 05: Global Market Value (US$ Million) Analysis, 2017 to 2022

Figure 06: Global Market Forecast & Y-o-Y Growth, 2023 to 2033

Figure 07: Global Market Absolute $ Opportunity (US$ Million) Analysis, 2023 to 2033

Figure 08: Global Market Value Share (%) Analysis 2023 and 2033, by Product

Figure 09: Global Market Y-o-Y Growth (%) Analysis 2023 to 2033, by Product

Figure 10: Global Market Attractiveness Analysis 2023 to 2033, by Product

Figure 11: Global Market Value Share (%) Analysis 2023 and 2033, by Form

Figure 12: Global Market Y-o-Y Growth (%) Analysis 2023 to 2033, by Form

Figure 13: Global Market Attractiveness Analysis 2023 to 2033, by Form

Figure 14: Global Market Value Share (%) Analysis 2023 and 2033, by Indication

Figure 15: Global Market Y-o-Y Growth (%) Analysis 2023 to 2033, by Indication

Figure 16: Global Market Attractiveness Analysis 2023 to 2033, by Indication

Figure 17: Global Market Value Share (%) Analysis 2023 and 2033, by Gender

Figure 18: Global Market Y-o-Y Growth (%) Analysis 2023 to 2033, by Gender

Figure 19: Global Market Attractiveness Analysis 2023 to 2033, by Gender

Figure 20: Global Market Value Share (%) Analysis 2023 and 2033, by Distribution Channel

Figure 21: Global Market Y-o-Y Growth (%) Analysis 2023 to 2033, by Distribution Channel

Figure 22: Global Market Attractiveness Analysis 2023 to 2033, by Distribution Channel

Figure 23: Global Market Value Share (%) Analysis 2023 and 2033, by Region

Figure 24: Global Market Y-o-Y Growth (%) Analysis 2023 to 2033, by Region

Figure 25: Global Market Attractiveness Analysis 2023 to 2033, by Region

Figure 26: North America Market Value (US$ Million) Analysis, 2017 to 2022

Figure 27: North America Market Value (US$ Million) Forecast, 2023 to 2033

Figure 28: North America Market Value Share, by Product (2023 E)

Figure 29: North America Market Value Share, by Form (2023 E)

Figure 30: North America Market Value Share, by Indication (2023 E)

Figure 31: North America Market Value Share, by Gender (2023 E)

Figure 32: North America Market Value Share, by Distribution Channel (2023 E)

Figure 33: North America Market Value Share, by Country (2023 E)

Figure 34: North America Market Attractiveness Analysis by Product, 2023 to 2033

Figure 35: North America Market Attractiveness Analysis by Form, 2023 to 2033

Figure 36: North America Market Attractiveness Analysis by Indication, 2023 to 2033

Figure 37: North America Market Attractiveness Analysis by Gender, 2023 to 2033

Figure 38: North America Market Attractiveness Analysis by Distribution Channel, 2023 to 2033

Figure 39: North America Market Attractiveness Analysis by Country, 2023 to 2033

Figure 40: USA Market Value Proportion Analysis, 2022

Figure 41: Global Vs. USA Growth Comparison, 2022 to 2033

Figure 42: USA Market Share Analysis (%) by Product, 2022 to 2033

Figure 43: USA Market Share Analysis (%) by Form, 2022 to 2033

Figure 44: USA Market Share Analysis (%) by Indication, 2022 to 2033

Figure 45: USA Market Share Analysis (%) by Gender, 2022 to 2033

Figure 46: USA Market Share Analysis (%) by Distribution Channel, 2022 to 2033

Figure 47: Canada Market Value Proportion Analysis, 2022

Figure 48: Global Vs. Canada. Growth Comparison, 2022 to 2033

Figure 49: Canada Market Share Analysis (%) by Product, 2022 to 2033

Figure 50: Canada Market Share Analysis (%) by Form, 2022 to 2033

Figure 51: Canada Market Share Analysis (%) by Indication, 2022 to 2033

Figure 52: Canada Market Share Analysis (%) by Gender, 2022 to 2033

Figure 53: Canada Market Share Analysis (%) by Distribution Channel, 2022 to 2033

Figure 54: Latin America Market Value (US$ Million) Analysis, 2017 to 2022

Figure 55: Latin America Market Value (US$ Million) Forecast, 2023 to 2033

Figure 56: Latin America Market Value Share, by Product (2023 E)

Figure 57: Latin America Market Value Share, by Form (2023 E)

Figure 58: Latin America Market Value Share, by Indication (2023 E)

Figure 59: Latin America Market Value Share, by Gender (2023 E)

Figure 60: Latin America Market Value Share, by Distribution Channel (2023 E)

Figure 61: Latin America Market Value Share, by Country (2023 E)

Figure 62: Latin America Market Attractiveness Analysis by Product, 2023 to 2033

Figure 63: Latin America Market Attractiveness Analysis by Form, 2023 to 2033

Figure 64: Latin America Market Attractiveness Analysis by Indication, 2023 to 2033

Figure 65: Latin America Market Attractiveness Analysis by Gender, 2023 to 2033

Figure 66: Latin America Market Attractiveness Analysis by Distribution Channel, 2023 to 2033

Figure 67: Latin America Market Attractiveness Analysis by Country, 2023 to 2033

Figure 68: Mexico Market Value Proportion Analysis, 2022

Figure 69: Global Vs Mexico Growth Comparison, 2022 to 2033

Figure 70: Mexico Market Share Analysis (%) by Product, 2022 to 2033

Figure 71: Mexico Market Share Analysis (%) by Form, 2022 to 2033

Figure 72: Mexico Market Share Analysis (%) by Indication, 2022 to 2033

Figure 73: Mexico Market Share Analysis (%) by Gender, 2022 to 2033

Figure 74: Mexico Market Share Analysis (%) by Distribution Channel, 2022 to 2033

Figure 75: Brazil Market Value Proportion Analysis, 2022

Figure 76: Global Vs. Brazil. Growth Comparison, 2022 to 2033

Figure 77: Brazil Market Share Analysis (%) by Product, 2022 to 2033

Figure 78: Brazil Market Share Analysis (%) by Form, 2022 to 2033

Figure 79: Brazil Market Share Analysis (%) by Indication, 2022 to 2033

Figure 80: Brazil Market Share Analysis (%) by Gender, 2022 to 2033

Figure 81: Brazil Market Share Analysis (%) by Distribution Channel, 2022 to 2033

Figure 82: Argentina Market Value Proportion Analysis, 2022

Figure 83: Global Vs Argentina Growth Comparison, 2022 to 2033

Figure 84: Argentina Market Share Analysis (%) by Product, 2022 to 2033

Figure 85: Argentina Market Share Analysis (%) by Form, 2022 to 2033

Figure 86: Argentina Market Share Analysis (%) by Indication, 2022 to 2033

Figure 87: Argentina Market Share Analysis (%) by Gender, 2022 to 2033

Figure 88: Argentina Market Share Analysis (%) by Distribution Channel, 2022 to 2033

Figure 89: Europe Market Value (US$ Million) Analysis, 2017 to 2022

Figure 90: Europe Market Value (US$ Million) Forecast, 2023 to 2033

Figure 91: Europe Market Value Share, by Product (2023 E)

Figure 92: Europe Market Value Share, by Form (2023 E)

Figure 93: Europe Market Value Share, by Indication (2023 E)

Figure 94: Europe Market Value Share, by Gender (2023 E)

Figure 95: Europe Market Value Share, by Distribution Channel (2023 E)

Figure 96: Europe Market Value Share, by Country (2023 E)

Figure 97: Europe Market Attractiveness Analysis by Product, 2022 to 2033

Figure 98: Europe Market Attractiveness Analysis by Form, 2022 to 2033

Figure 99: Europe Market Attractiveness Analysis by Indication, 2022 to 2033

Figure 100: Europe Market Attractiveness Analysis by Gender, 2022 to 2033

Figure 101: Europe Market Attractiveness Analysis by Distribution Channel, 2022 to 2033

Figure 102: Europe Market Attractiveness Analysis by Country, 2022 to 2033

Figure 103: UK Market Value Proportion Analysis, 2022

Figure 104: Global Vs. UK Growth Comparison, 2022 to 2033

Figure 105: UK Market Share Analysis (%) by Product, 2022 to 2033

Figure 106: UK Market Share Analysis (%) by Form, 2022 to 2033

Figure 107: UK Market Share Analysis (%) by Indication, 2022 to 2033

Figure 108: UK Market Share Analysis (%) by Gender, 2022 to 2033

Figure 109: UK Market Share Analysis (%) by Distribution Channel, 2022 to 2033

Figure 110: Germany Market Value Proportion Analysis, 2022

Figure 111: Global Vs. Germany Growth Comparison, 2022 to 2033

Figure 112: Germany Market Share Analysis (%) by Product, 2022 to 2033

Figure 113: Germany Market Share Analysis (%) by Form, 2022 to 2033

Figure 114: Germany Market Share Analysis (%) by Indication, 2022 to 2033

Figure 115: Germany Market Share Analysis (%) by Gender, 2022 to 2033

Figure 116: Germany Market Share Analysis (%) by Distribution Channel, 2022 to 2033

Figure 117: Italy Market Value Proportion Analysis, 2022

Figure 118: Global Vs. Italy Growth Comparison, 2022 to 2033

Figure 119: Italy Market Share Analysis (%) by Product, 2022 to 2033

Figure 120: Italy Market Share Analysis (%) by Form, 2022 to 2033

Figure 121: Italy Market Share Analysis (%) by Indication, 2022 to 2033

Figure 122: Italy Market Share Analysis (%) by Gender, 2022 to 2033

Figure 123: Italy Market Share Analysis (%) by Distribution Channel, 2022 to 2033

Figure 124: France Market Value Proportion Analysis, 2022

Figure 125: Global Vs France Growth Comparison, 2022 to 2033

Figure 126: France Market Share Analysis (%) by Product, 2022 to 2033

Figure 127: France Market Share Analysis (%) by Form, 2022 to 2033

Figure 128: France Market Share Analysis (%) by Indication, 2022 to 2033

Figure 129: France Market Share Analysis (%) by Gender, 2022 to 2033

Figure 130: France Market Share Analysis (%) by Distribution Channel, 2022 to 2033

Figure 131: Spain Market Value Proportion Analysis, 2022

Figure 132: Global Vs Spain Growth Comparison, 2022 to 2033

Figure 133: Spain Market Share Analysis (%) by Product, 2022 to 2033

Figure 134: Spain Market Share Analysis (%) by Form, 2022 to 2033

Figure 135: Spain Market Share Analysis (%) by Indication, 2022 to 2033

Figure 136: Spain Market Share Analysis (%) by Gender, 2022 to 2033

Figure 137: Spain Market Share Analysis (%) by Distribution Channel, 2022 to 2033

Figure 138: Russia Market Value Proportion Analysis, 2022

Figure 139: Global Vs Russia Growth Comparison, 2022 to 2033

Figure 140: Russia Market Share Analysis (%) by Product, 2022 to 2033

Figure 141: Russia Market Share Analysis (%) by Form, 2022 to 2033

Figure 142: Russia Market Share Analysis (%) by Indication, 2022 to 2033

Figure 143: Russia Market Share Analysis (%) by Gender, 2022 to 2033

Figure 144: Russia Market Share Analysis (%) by Distribution Channel, 2022 to 2033

Figure 145: BENELUX Market Value Proportion Analysis, 2022

Figure 146: Global Vs BENELUX Growth Comparison, 2022 to 2033

Figure 147: BENELUX Market Share Analysis (%) by Product, 2022 to 2033

Figure 148: BENELUX Market Share Analysis (%) by Form, 2022 to 2033

Figure 149: BENELUX Market Share Analysis (%) by Indication, 2022 to 2033

Figure 150: BENELUX Market Share Analysis (%) by Gender, 2022 to 2033

Figure 151: BENELUX Market Share Analysis (%) by Distribution Channel, 2022 to 2033

Figure 152: East Asia Market Value (US$ Million) Analysis, 2017 to 2022

Figure 153: East Asia Market Value (US$ Million) Forecast, 2023 to 2033

Figure 154: East Asia Market Value Share, by Product (2023 E)

Figure 155: East Asia Market Value Share, by Form (2023 E)

Figure 156: East Asia Market Value Share, by Indication (2023 E)

Figure 157: East Asia Market Value Share, by Gender (2023 E)

Figure 158: East Asia Market Value Share, by Distribution Channel (2023 E)

Figure 159: East Asia Market Value Share, by Country (2023 E)

Figure 160: East Asia Market Attractiveness Analysis by Product, 2023 to 2033

Figure 161: East Asia Market Attractiveness Analysis by Form, 2023 to 2033

Figure 162: East Asia Market Attractiveness Analysis by Indication, 2023 to 2033

Figure 163: East Asia Market Attractiveness Analysis by Gender, 2023 to 2033

Figure 164: East Asia Market Attractiveness Analysis by Distribution Channel, 2023 to 2033

Figure 165: East Asia Market Attractiveness Analysis by Country, 2023 to 2033

Figure 166: China Market Value Proportion Analysis, 2022

Figure 167: Global Vs. China Growth Comparison, 2022 to 2033

Figure 168: China Market Share Analysis (%) by Product, 2022 to 2033

Figure 169: China Market Share Analysis (%) by Form, 2022 to 2033

Figure 170: China Market Share Analysis (%) by Indication, 2022 to 2033

Figure 171: China Market Share Analysis (%) by Gender, 2022 to 2033

Figure 172: China Market Share Analysis (%) by Distribution Channel, 2022 to 2033

Figure 173: Japan Market Value Proportion Analysis, 2022

Figure 174: Global Vs. Japan Growth Comparison, 2022 to 2033

Figure 175: Japan Market Share Analysis (%) by Product, 2022 to 2033

Figure 176: Japan Market Share Analysis (%) by Form, 2022 to 2033

Figure 177: Japan Market Share Analysis (%) by Indication, 2022 to 2033

Figure 178: Japan Market Share Analysis (%) by Gender, 2022 to 2033

Figure 179: Japan Market Share Analysis (%) by Distribution Channel, 2022 to 2033

Figure 180: South Korea Market Value Proportion Analysis, 2022

Figure 181: Global Vs South Korea Growth Comparison, 2022 to 2033

Figure 182: South Korea Market Share Analysis (%) by Product, 2022 to 2033

Figure 183: South Korea Market Share Analysis (%) by Form, 2022 to 2033

Figure 184: South Korea Market Share Analysis (%) by Indication, 2022 to 2033

Figure 185: South Korea Market Share Analysis (%) by Gender, 2022 to 2033

Figure 186: South Korea Market Share Analysis (%) by Distribution Channel, 2022 to 2033

Figure 187: South Asia Market Value (US$ Million) Analysis, 2017 to 2022

Figure 188: South Asia Market Value (US$ Million) Forecast, 2023 to 2033

Figure 189: South Asia Market Value Share, by Product (2023 E)

Figure 190: South Asia Market Value Share, by Form (2023 E)

Figure 191: South Asia Market Value Share, by Indication (2023 E)

Figure 192: South Asia Market Value Share, by Gender (2023 E)

Figure 193: South Asia Market Value Share, by Distribution Channel (2023 E)

Figure 194: South Asia Market Value Share, by Country (2023 E)

Figure 195: South Asia Market Attractiveness Analysis by Product, 2023 to 2033

Figure 196: South Asia Market Attractiveness Analysis by Form, 2023 to 2033

Figure 197: South Asia Market Attractiveness Analysis by Indication, 2023 to 2033

Figure 198: South Asia Market Attractiveness Analysis by Gender, 2023 to 2033

Figure 199: South Asia Market Attractiveness Analysis by Distribution Channel, 2023 to 2033

Figure 200: South Asia Market Attractiveness Analysis by Country, 2023 to 2033

Figure 201: India Market Value Proportion Analysis, 2022

Figure 202: Global Vs. India Growth Comparison, 2022 to 2033

Figure 203: India Market Share Analysis (%) by Product, 2022 to 2033

Figure 204: India Market Share Analysis (%) by Form, 2022 to 2033

Figure 205: India Market Share Analysis (%) by Indication, 2022 to 2033

Figure 206: India Market Share Analysis (%) by Gender, 2022 to 2033

Figure 207: India Market Share Analysis (%) by Distribution Channel, 2022 to 2033

Figure 208: Indonesia Market Value Proportion Analysis, 2022

Figure 209: Global Vs. Indonesia Growth Comparison, 2022 to 2033

Figure 210: Indonesia Market Share Analysis (%) by Product, 2022 to 2033

Figure 211: Indonesia Market Share Analysis (%) by Form, 2022 to 2033

Figure 212: Indonesia Market Share Analysis (%) by Indication, 2022 to 2033

Figure 213: Indonesia Market Share Analysis (%) by Gender, 2022 to 2033

Figure 214: Indonesia Market Share Analysis (%) by Distribution Channel, 2022 to 2033

Figure 215: Malaysia Market Value Proportion Analysis, 2022

Figure 216: Global Vs. Malaysia Growth Comparison, 2022 to 2033

Figure 217: Malaysia Market Share Analysis (%) by Product, 2022 to 2033

Figure 218: Malaysia Market Share Analysis (%) by Form, 2022 to 2033

Figure 219: Malaysia Market Share Analysis (%) by Indication, 2022 to 2033

Figure 220: Malaysia Market Share Analysis (%) by Gender, 2022 to 2033

Figure 221: Malaysia Market Share Analysis (%) by Distribution Channel, 2022 to 2033

Figure 222: Thailand Market Value Proportion Analysis, 2022

Figure 223: Global Vs. Thailand Growth Comparison, 2022 to 2033

Figure 224: Thailand Market Share Analysis (%) by Product, 2022 to 2033

Figure 225: Thailand Market Share Analysis (%) by Form, 2022 to 2033

Figure 226: Thailand Market Share Analysis (%) by Indication, 2022 to 2033

Figure 227: Thailand Market Share Analysis (%) by Gender, 2022 to 2033

Figure 228: Thailand Market Share Analysis (%) by Distribution Channel, 2022 to 2033

Figure 229: Oceania Market Value (US$ Million) Analysis, 2017 to 2022

Figure 230: Oceania Market Value (US$ Million) Forecast, 2022 to 2033

Figure 231: Oceania Market Value Share, by Product (2023 E)

Figure 232: Oceania Market Value Share, by Form (2023 E)

Figure 233: Oceania Market Value Share, by Indication (2023 E)

Figure 234: Oceania Market Value Share, by Gender (2023 E)

Figure 235: Oceania Market Value Share, by Distribution Channel (2023 E)

Figure 236: Oceania Market Value Share, by Country (2023 E)

Figure 237: Oceania Market Attractiveness Analysis by Product, 2022 to 2033

Figure 238: Oceania Market Attractiveness Analysis by Form, 2022 to 2033

Figure 239: Oceania Market Attractiveness Analysis by Indication, 2022 to 2033

Figure 240: Oceania Market Attractiveness Analysis by Gender, 2022 to 2033

Figure 241: Oceania Market Attractiveness Analysis by Distribution Channel, 2022 to 2033

Figure 242: Oceania Market Attractiveness Analysis by Country, 2022 to 2033

Figure 243: Australia Market Value Proportion Analysis, 2022

Figure 244: Global Vs. Australia Growth Comparison, 2022 to 2033

Figure 245: Australia Market Share Analysis (%) by Product, 2022 to 2033

Figure 246: Australia Market Share Analysis (%) by Form, 2022 to 2033

Figure 247: Australia Market Share Analysis (%) by Indication, 2022 to 2033

Figure 248: Australia Market Share Analysis (%) by Gender, 2022 to 2033

Figure 249: Australia Market Share Analysis (%) by Distribution Channel, 2022 to 2033

Figure 250: New Zealand Market Value Proportion Analysis, 2022

Figure 251: Global Vs New Zealand Growth Comparison, 2022 to 2033

Figure 252: New Zealand Market Share Analysis (%) by Product, 2022 to 2033

Figure 253: New Zealand Market Share Analysis (%) by Form, 2022 to 2033

Figure 254: New Zealand Market Share Analysis (%) by Indication, 2022 to 2033

Figure 255: New Zealand Market Share Analysis (%) by Gender, 2022 to 2033

Figure 256: New Zealand Market Share Analysis (%) by Distribution Channel, 2022 to 2033

Figure 257: Middle East & Africa Market Value (US$ Million) Analysis, 2017 to 2022

Figure 258: Middle East & Africa Market Value (US$ Million) Forecast, 2022 to 2033

Figure 259: Middle East & Africa Market Value Share, by Product (2023 E)

Figure 260: Middle East & Africa Market Value Share, by Form (2023 E)

Figure 261: Middle East & Africa Market Value Share, by Indication (2023 E)

Figure 262: Middle East & Africa Market Value Share, by Gender (2023 E)

Figure 263: Middle East & Africa Market Value Share, by Distribution Channel (2023 E)

Figure 264: Middle East & Africa Market Value Share, by Country (2023 E)

Figure 265: Middle East & Africa Market Attractiveness Analysis by Product, 2022 to 2033

Figure 266: Middle East & Africa Market Attractiveness Analysis by Form, 2022 to 2033

Figure 267: Middle East & Africa Market Attractiveness Analysis by Indication, 2022 to 2033

Figure 268: Middle East & Africa Market Attractiveness Analysis by Gender, 2022 to 2033

Figure 269: Middle East & Africa Market Attractiveness Analysis by Distribution Channel, 2022 to 2033

Figure 270: Middle East & Africa Market Attractiveness Analysis by Country, 2022 to 2033

Figure 271: GCC Countries Market Value Proportion Analysis, 2022

Figure 272: Global Vs GCC Countries Growth Comparison, 2022 to 2033

Figure 273: GCC Countries Market Share Analysis (%) by Product, 2022 to 2033

Figure 274: GCC Countries Market Share Analysis (%) by Form, 2022 to 2033

Figure 275: GCC Countries Market Share Analysis (%) by Indication, 2022 to 2033

Figure 276: GCC Countries Market Share Analysis (%) by Gender, 2022 to 2033

Figure 277: GCC Countries Market Share Analysis (%) by Distribution Channel, 2022 to 2033

Figure 278: Türkiye Market Value Proportion Analysis, 2022

Figure 279: Global Vs. Türkiye Growth Comparison, 2022 to 2033

Figure 280: Türkiye Market Share Analysis (%) by Product, 2022 to 2033

Figure 281: Türkiye Market Share Analysis (%) by Form, 2022 to 2033

Figure 282: Türkiye Market Share Analysis (%) by Indication, 2022 to 2033

Figure 283: Türkiye Market Share Analysis (%) by Gender, 2022 to 2033

Figure 284: Türkiye Market Share Analysis (%) by Distribution Channel, 2022 to 2033

Figure 285: South Africa Market Value Proportion Analysis, 2022

Figure 286: Global Vs. South Africa Growth Comparison, 2022 to 2033

Figure 287: South Africa Market Share Analysis (%) by Product, 2022 to 2033

Figure 288: South Africa Market Share Analysis (%) by Form, 2022 to 2033

Figure 289: South Africa Market Share Analysis (%) by Indication, 2022 to 2033

Figure 290: South Africa Market Share Analysis (%) by Gender, 2022 to 2033

Figure 291: South Africa Market Share Analysis (%) by Distribution Channel, 2022 to 2033

Figure 292: North Africa Market Value Proportion Analysis, 2022

Figure 293: Global Vs North Africa Growth Comparison, 2022 to 2033

Figure 294: North Africa Market Share Analysis (%) by Product, 2022 to 2033

Figure 295: North Africa Market Share Analysis (%) by Form, 2022 to 2033

Figure 296: North Africa Market Share Analysis (%) by Indication, 2022 to 2033

Figure 297: North Africa Market Share Analysis (%) by Gender, 2022 to 2033

Figure 298: North Africa Market Share Analysis (%) by Distribution Channel, 2022 to 2033

Recommendations

Healthcare

Preoperative Bathing Solution Market

Published : July 2023

Consumer Product

Baby Bath and Shower Products Market

Published : May 2023

Explore Healthcare Insights

View Reports

Medicated Bath Additive Market