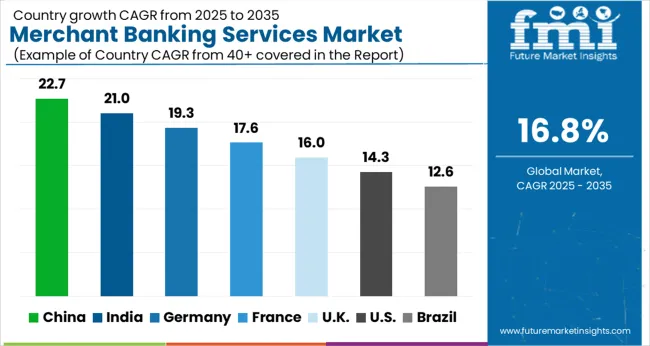
The merchant banking services market is estimated to be valued at USD 68.9 billion in 2025 and is projected to reach USD 325.7 billion by 2035, registering a compound annual growth rate (CAGR) of 16.8% over the forecast period.
Corporate finance officers evaluate merchant banking partnerships based on sector expertise, transaction execution capabilities, and global network reach when engaging advisory services for acquisitions, divestitures, and capital raising initiatives across diverse industry verticals. Service selection involves analyzing deal origination capabilities, valuation methodologies, and regulatory navigation expertise while considering relationship management quality, fee structures, and completion track records necessary for complex transaction success. Engagement decisions balance advisory costs against value creation potential including optimal pricing achievement, strategic positioning enhancement, and risk mitigation that influence overall transaction outcomes and shareholder value optimization.
Service delivery requires specialized financial modeling capabilities, due diligence coordination, and regulatory compliance management that ensure transaction structuring meets client objectives while addressing market conditions and stakeholder requirements throughout complex deal processes. Operations coordination involves managing deal teams, documentation preparation, and stakeholder communication while maintaining confidentiality protocols and regulatory disclosure requirements across multiple jurisdictions. Quality assurance procedures address valuation accuracy, compliance verification, and execution timeline management that ensure successful transaction completion while protecting client interests and reputation throughout competitive bidding processes.
Cross-functional coordination involves investment bankers, industry specialists, and regulatory experts collaborating to optimize transaction structures that balance client objectives with market feasibility while addressing specific sector dynamics and regulatory constraints. Transaction execution encompasses pitch preparation, buyer identification, and negotiation management while coordinating with legal counsel, accounting firms, and regulatory authorities. Training initiatives address financial analysis techniques, presentation skills, and client relationship management essential for maintaining service quality and competitive positioning throughout dynamic market conditions.
Technology advancement prioritizes data analytics integration, virtual deal room capabilities, and automated valuation modeling that improve transaction efficiency while enhancing due diligence accuracy and stakeholder communication throughout complex deal processes. Service providers develop proprietary databases, market intelligence platforms, and client relationship management systems that optimize deal origination while maintaining competitive intelligence and client service quality. Innovation encompasses artificial intelligence-supported analysis, blockchain transaction verification, and digital asset advisory services that expand service capabilities while addressing emerging market requirements.
Service specialization addresses middle-market transactions requiring tailored advisory approaches, cross-border deals needing multi-jurisdictional expertise, and growth capital arrangements demanding flexible structuring solutions that leverage specialized merchant banking capabilities for diverse client objectives. Advisory teams coordinate with industry consultants, valuation specialists, and tax advisors to establish comprehensive transaction support that addresses customer-specific requirements while maintaining execution efficiency and regulatory compliance.
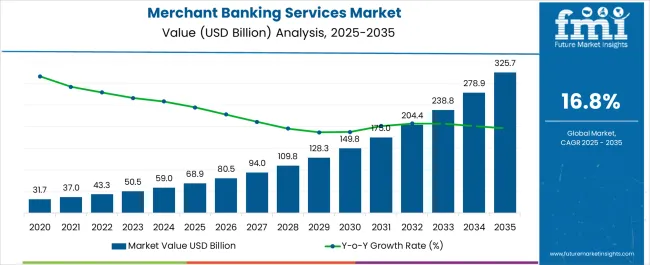
| Metric | Value |
|---|---|
| Merchant Banking Services Market Estimated Value in (2025 E) | USD 68.9 billion |
| Merchant Banking Services Market Forecast Value in (2035 F) | USD 325.7 billion |
| Forecast CAGR (2025 to 2035) | 16.8% |
The merchant banking services market is experiencing consistent expansion supported by the increasing complexity of financial transactions, rising demand for corporate advisory solutions, and the growing role of financial institutions in capital structuring. Strategic shifts in global investment flows, coupled with heightened cross border activities, are creating opportunities for specialized merchant banking functions.
Regulatory frameworks that encourage transparency and compliance have further enhanced trust in structured financial services. The integration of digital platforms and analytics is improving client engagement and operational efficiency, allowing service providers to offer tailored solutions with greater precision.
With businesses seeking support in areas such as fundraising, mergers, and asset optimization, the outlook for the sector remains favorable. Long term growth is expected as companies and institutions continue to align with merchant banking solutions for effective financial planning, capital allocation, and market positioning.
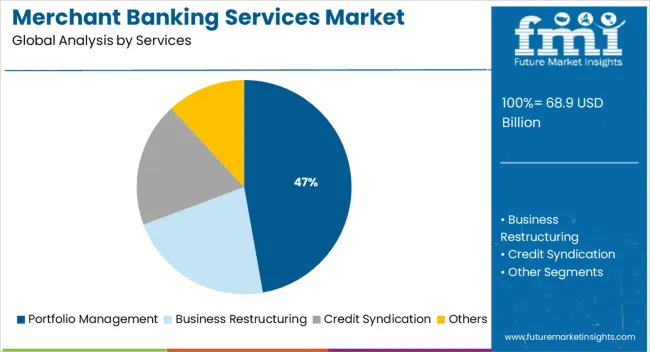
The portfolio management services segment is projected to contribute 47.20% of total market revenue by 2025, positioning it as the leading services category. Growth is being driven by rising demand for professional management of financial assets, diversification strategies, and structured investment approaches.
Investors and corporate clients are increasingly seeking expert guidance to mitigate risks and achieve optimized returns. The capacity of portfolio management services to integrate market analytics, sectoral insights, and customized investment plans has reinforced their adoption.
Enhanced transparency and performance tracking tools have further supported client trust, ensuring this segment remains dominant within the services category.
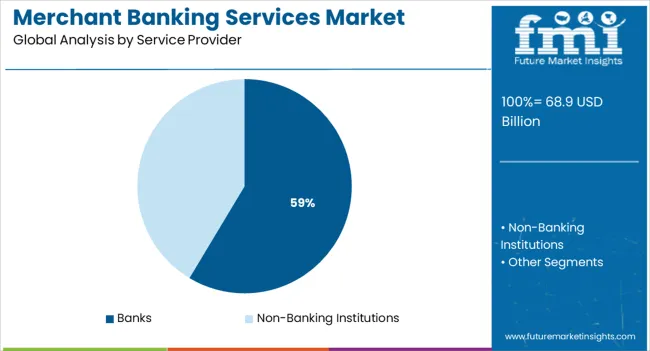
The banks segment is expected to hold 58.60% of total market revenue by 2025 under the service provider category, making it the largest contributor. Banks have leveraged their extensive infrastructure, regulatory expertise, and client networks to deliver merchant banking solutions at scale.
Their established credibility and integrated financial product offerings have strengthened adoption among institutional and corporate clients. Furthermore, banks are increasingly embedding advisory and merchant banking functions into digital ecosystems, providing clients with seamless access to financing and strategic advisory services.
This combination of trust, capability, and accessibility has consolidated the leadership of banks as the dominant service providers in the merchant banking services market.
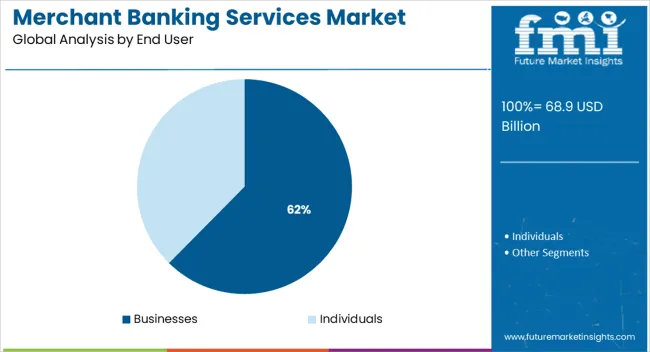
The businesses segment is projected to account for 62.40% of overall revenue by 2025 within the end user category, securing its position as the largest demand contributor. This dominance is attributed to the rising need for corporate advisory, capital restructuring, and funding solutions across industries.
Businesses are increasingly engaging merchant banking services to support expansion strategies, mergers, acquisitions, and debt management. Additionally, the complexity of global financial transactions and heightened competition are prompting companies to rely on expert merchant bankers for long term sustainability.
By enabling access to tailored investment strategies, risk mitigation frameworks, and capital market insights, merchant banking services have become integral to business financial planning, positioning this segment as the primary growth driver in the end user category.
The market is likely to be negatively affected by the high costs associated with merchant banking services, which makes them costly in comparison to traditional banking services.
Additionally, merchant banking services are inaccessible to the masses, since their services are restricted to wealthy individuals only. These rich people are commonly called high net worth individuals (HNWIs), who meet the standard of least asset size requirements.
Further, merchant banking services do not guarantee success and have associated risks. In addition to this, based on business clients, merchant banks do not assist in raising funds for start-ups.
| Attributes | Details |
|---|---|
| Merchant Banking Services Market Value (2025) | USD 50.53 billion |
| Merchant Banking Services Market Forecast Value (2035) | USD 238.77 billion |
| Merchant Banking Services Market CAGR (2025 to 2035) | 16.8% |
The market attained a market revenue of USD 68.9 billion in 2025. The market growth in the historical period has been governed by several factors, including surging trade financing, fundraising, and the recent increase in IPO participation.
By 2035, the market is estimated to attain USD 238.77 billion, expanding at a CAGR of 16.8% in the stipulated time frame. Future Market Insights inspects the latest trends shaping the market during the given time duration:
| Year | Expected Valuation |
|---|---|
| 2025 | USD 68.93 billion |
| 2035 | USD 109.84 billion |
| 2035 | USD 204.42 billion |
The market, in the forthcoming years, is projected to be driven by rising merchant banking operations globally. The merchant bankers are operating as promoters of industrial firms. Merchant bankers help enterprises formulate ideas, prepare feasibility reports, identify projects, and fetch government incentives and approvals.
In addition to this, merchant bankers advise clients, chiefly consisting of institutional investors, about investment decisions. Wide adoption of these services the world over, the market is projected to be pushed forward in the coming years.
Based on services, the business restructuring segment is projected to head the merchant banking services market over the forecast period. Business restructuring service is employed to modify management and operations to better align with corporate plans and invigorate them to yield more profits.
For example, restructuring business operations to utilize debt in an environment with low-interest-rate may be more feasible than disbursing equity.
Additionally, merchant banks help in complex restructurings like demergers and spinoffs to procure business value. Several benefits of business restructuring are projected to boost their demand over the forecast period.
The credit syndication segment is a considerably growing segment in the merchant banking services industry. Credit syndication combines debt with a solitary lending source, a consortium, or a financial institution.
The expanding deployment of merchant banks for credit syndication can be credited to its capacity to decrease the debt amount and enhance balance sheets. In addition to this, merchant banks help unite foreign and local currency loans.
Based on service providers, the banks are projected to dominate the market over the next 10 years. The banks in total hold a large share of the merchant banking services market. The segment is being pulled by the large scale of operations.
Further, banks are entrusted with their ability to optimally utilize resources and funds to yield maximum return on investments. In addition to this, banks are under strict regulations, as a result leaving less room for oversight.
The segment of non-banking institutions is projected to exhibit significant growth in terms of CAGR over the stipulated time frame. Non-banking institutions segment comprises investment firms, private companies, or proprietary ownerships.
The frequently used non-banking institutions, besides investment firms, is insurance and hedge funds companies. The main distinguishing feature of non-banking entities is that they assist in procuring capital, but are not entirely licensed to be considered as banks, hence not allowed to accept deposits.
The business segment is anticipated to lead the market during the forecast period. The segment growth of businesses can be attributed to the many business clients deploying merchant banking services.
These businesses include pension funds, global corporates, government institutions, and charity organizations. The surge in demand for merchant banking services by business clients for active portfolio management to reduce the risk and create a return on equity.
Additionally, the advisory services and consulting provided by merchant banks may help businesses in evaluating the cost and advantages of projects to estimate the payback period. Consequently, the demand for merchant banking services from businesses is projected to rise.
The individual segment is predicted to witness significant growth over the upcoming years. Merchant banks fundamentally help HNIs with portfolio management. These services consist of buying and selling primary securities contained in their portfolio while adjusting to evolving market conditions.
The individual segment is projected to be driven by the creation and implementation of investment strategies to meet certain investment objectives.
The North America merchant banking services market is projected to hold a dominating share of the global market. The region is densely populated with global companies like Tesla, Apple Inc., and Google, which are operating across the globe. Additionally, the region is observing significant exertion by local companies to enter new markets.
This can be illustrated by Panatonni, which is a real estate development company, which entered the India market in July 2025. The North America market is further being driven by the developed business environment and strong capital market in the region. market in July 2025.
North America market is further being driven by the developed business environment and strong capital market in the region.
The Asia Pacific merchant banking services market is predicted to emerge as a significant market, in terms of CAGR, in the next decade. The market growth can be ascribed to an increase in income levels, favorable demographics, and expanding regional businesses.
According to the global Foreign Direct Investment (FDI) Annual Report, the Asia Pacific region witnessed an increase of 17% in the FDIs in Greenfield projects in the year 2024. The leading merchant banking service providers like JPMorgan Chase & Co. have widened their scope of offerings in the Asia Pacific region to tap into the potential opportunity. Greenfield projects in the year 2024.
The leading merchant banking service providers like JPMorgan Chase & Co. have widened their scope of offerings in Asia Pacific region to tap into the potential opportunity.
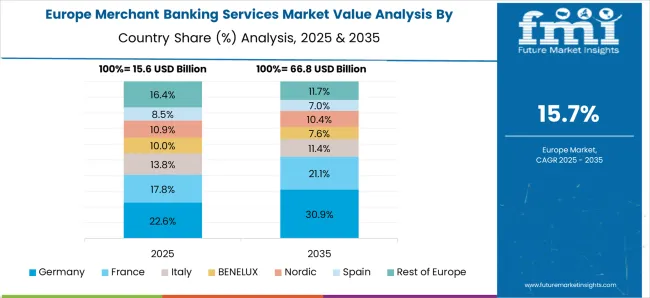
The Europe merchant banking services market is driven by the growing demand for truly embedded finance offerings. Several merchant banks providing high professional standards, long term commitment, and transparent practices in the region, are pushing the market growth.
Increasing demand for long-term success and significant growth from high-value businesses and individuals is anticipated to yield industry expansion. Merchant banking services are being sought to offer cutting-edge digital banking services rooted in regulatory expertise.
According to Statista Research Department, the combined wealth of High-Net-Worth Individuals (HNWIs) in Europe amounted to about USD 17.46 trillion in 2024. In the same year, the United Kingdom, Germany, and France were the top three countries with HNWIs. The surging HNWIs in the region are pushing the market development in the Europe region.
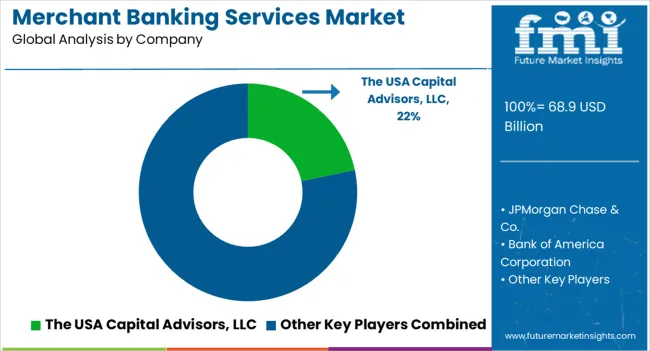
The merchant banking services market is highly competitive, driven by increasing corporate financing needs, mergers and acquisitions, and private equity investments across global markets. JPMorgan Chase & Co., Bank of America Corporation, and Morgan Stanley lead the industry with comprehensive merchant banking portfolios that include capital raising, advisory services, and structured finance solutions for mid-to-large enterprises. Their strong global presence and access to institutional capital allow them to cater to complex cross-border transactions and long-term investment strategies.
Credit Suisse Group AG, HSBC Bank USA N.A., and the Royal Bank of Canada further strengthen market competitiveness through specialized investment advisory, risk management, and debt structuring capabilities. These institutions leverage deep market expertise to support corporate expansions and equity syndications across diverse industries.
DBS Bank Ltd. and NIBL Ace Capital Limited represent the growing influence of Asian financial institutions, providing tailored merchant banking services across emerging markets with a focus on trade finance and corporate restructuring. Bryant Park Capital and USA Capital Advisors LLC contribute to the mid-market segment, offering customized advisory and capital-raising services for small and mid-sized enterprises.
| Attributes | Details |
|---|---|
| Forecast Period | 2025 to 2035 |
| Historical Data Available for | 2020 to 2025 |
| Market Analysis | USD million/ billion for Value |
| By Product | Portfolio Management, Business Restructuring, Credit Syndication, Others |
| By Application | Banks, Non-banking Institutions |
| By End User | Businesses, Individuals |
| By Region | North America; Latin America; Europe; Asia Pacific; The Middle East and Africa |
| Key Countries Covered | The United States, Brazil, Mexico, Canada, the United Kingdom, Germany, France, Spain, Italy, Russia, Argentina, Brunei, Cambodia, Indonesia, Laos, Malaysia, Myanmar, the Philippines, Singapore, Thailand, Vietnam, Australia, Poland, China, New Zealand, Japan, GCC countries, South Africa, others |
| Key Players |
The USA Capital Advisors LLC, JPMorgan Chase & Co., Bank of America Corporation, DBS Bank Ltd., NIBL Ace Capital Limited, Bryant Park Capital, Morgan Stanley, Credit Suisse Group AG, HSBC Bank USA N.A., Royal Bank of Canada |
| Additional Attributes |
Dollar sales by product, application, and end user, regional adoption across Asia Pacific, Europe, North America, competitive landscape, digital platforms, ESG-linked financing, regulatory compliance, AI-driven deal analytics, and innovative financing structures. |
The global merchant banking services market is estimated to be valued at USD 68.9 billion in 2025.
The market size for the merchant banking services market is projected to reach USD 325.7 billion by 2035.
The merchant banking services market is expected to grow at a 16.8% CAGR between 2025 and 2035.
The key product types in merchant banking services market are portfolio management, business restructuring, credit syndication and others.
In terms of service provider, banks segment to command 58.6% share in the merchant banking services market in 2025.


Full Research Suite comprises of:
Market outlook & trends analysis
Interviews & case studies
Strategic recommendations
Vendor profiles & capabilities analysis
5-year forecasts
8 regions and 60+ country-level data splits
Market segment data splits
12 months of continuous data updates
DELIVERED AS:
PDF EXCEL ONLINE
Merchant Hydrogen Generation Market Size and Share Forecast Outlook 2025 to 2035
Chemical Merchant Hydrogen Generation Market Size and Share Forecast Outlook 2025 to 2035
Electrolysis Merchant Hydrogen Generation Market Size and Share Forecast Outlook 2025 to 2035
Nuclear Powered Merchant Vessel Market Size and Share Forecast Outlook 2025 to 2035
Petroleum Refinery Merchant Hydrogen Generation Market Size and Share Forecast Outlook 2025 to 2035
Banking as a Service (BaaS) Platform Market Size and Share Forecast Outlook 2025 to 2035
Open Banking & BaaS – Revolutionizing European FinTech
UK Banking as a Service (BaaS) Platform Market Growth - Trends & Forecast 2025 to 2035
Open Banking Market Analysis - Size, Share, and Forecast 2025 to 2035
Core Banking Solution Market Report – Growth & Forecast 2017-2027
Japan Banking as a Service (BaaS) Platform Market Growth - Trends & Forecast 2025 to 2035
Korea Banking-as-a-Service (BaaS) Platform Market Growth – Trends & Forecast 2025 to 2035
Blood Banking Equipment Market Analysis – Size, Share & Forecast 2024-2034
Embedded Banking Market Size and Share Forecast Outlook 2025 to 2035
Latin America Banking as a Service (BaaS) Platform Market - Growth & Demand 2025 to 2035
Blockchain in Banking Market
Western Europe Banking-as-a-Service (BaaS) Platform Market - Growth & Demand 2025 to 2035
Europe Embedded Banking Market - Trends & Forecast 2025 to 2035
High Density (HD) Cell Banking Market Size and Share Forecast Outlook 2025 to 2035
In Vitro Fertilization Banking Services Market - Trends, Demand & Forecast 2025 to 2035

Thank you!
You will receive an email from our Business Development Manager. Please be sure to check your SPAM/JUNK folder too.
Chat With
MaRIA