The NVMe Over Fiber Channel Market is estimated to be valued at USD 69.8 billion in 2025 and is projected to reach USD 595.0 billion by 2035, registering a compound annual growth rate (CAGR) of 23.9% over the forecast period.
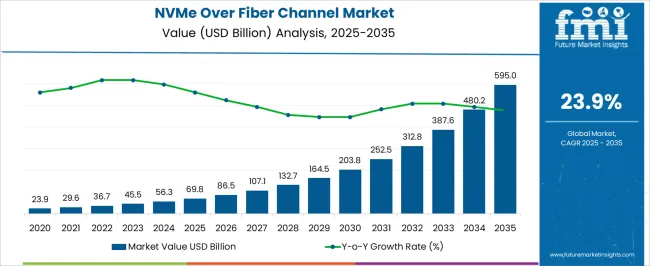
| Metric | Value |
|---|---|
| NVMe Over Fiber Channel Market Estimated Value in (2025 E) | USD 69.8 billion |
| NVMe Over Fiber Channel Market Forecast Value in (2035 F) | USD 595.0 billion |
| Forecast CAGR (2025 to 2035) | 23.9% |
The NVMe over fiber channel market is expanding rapidly due to the rising need for low latency, high throughput storage solutions in modern IT infrastructures. Enterprises are increasingly focused on accelerating data access and supporting workloads such as artificial intelligence, analytics, and cloud computing, all of which demand robust storage architectures.
The adoption of NVMe technology across industries has been reinforced by the transition from legacy systems to flash-based environments that ensure faster performance and reduced application downtime. Regulatory requirements for secure data handling and the proliferation of data intensive industries such as banking, healthcare, and telecommunications are further stimulating demand.
Investments in scalable storage infrastructure are creating favorable conditions for NVMe over fiber channel solutions, positioning the market for consistent growth as enterprises prioritize performance optimization, energy efficiency, and seamless integration with existing storage area networks.
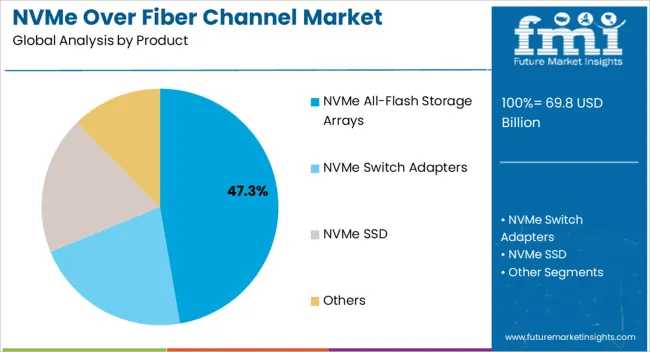
The NVMe all flash storage arrays segment is expected to contribute 47.30% of total market revenue by 2025 within the product category, making it the leading product segment. This growth is attributed to the ability of all flash arrays to deliver unparalleled performance, higher input output operations per second, and faster data processing compared to hybrid alternatives.
Their energy efficiency and reduced footprint have further supported their adoption among enterprises seeking cost optimized high performance storage.
In addition, advancements in deduplication, compression, and thin provisioning technologies have enhanced storage utilization, reinforcing demand for NVMe all flash storage arrays.
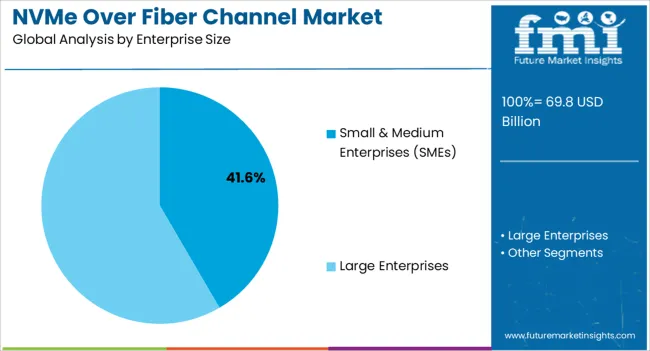
The small and medium enterprises segment is projected to hold 41.60% of total revenue by 2025 under the enterprise size category. This dominance is being driven by the growing adoption of digital transformation strategies and the increased reliance on cost effective scalable storage solutions.
SMEs are increasingly deploying NVMe over fiber channel technology to support cloud migration, virtualization, and big data analytics without compromising speed or reliability. Their preference for flexible subscription models and reduced infrastructure maintenance costs has further accelerated adoption.
As SMEs continue to expand their IT capabilities, NVMe solutions are becoming central to enabling operational efficiency and competitive agility.
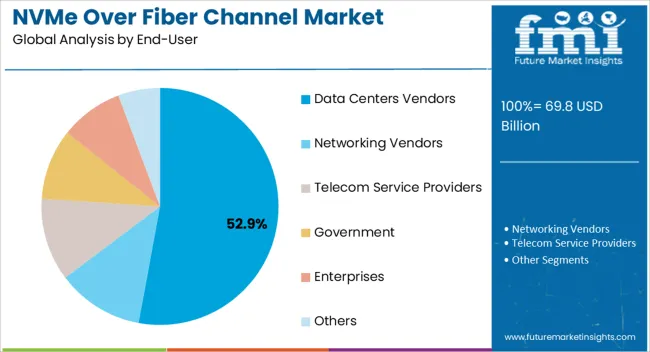
The data centers vendors segment is expected to account for 52.90% of total market revenue by 2025, positioning it as the dominant end user category. This growth is being fueled by the exponential rise in data generation and the demand for real time processing across industries.
Data centers require high performance storage systems to ensure seamless delivery of cloud services, digital platforms, and content distribution networks. NVMe over fiber channel technology enables superior scalability, reduced latency, and consistent workload management, which are essential for large scale operations.
As hyperscale and colocation providers continue to expand globally, the role of NVMe enabled storage is becoming critical, solidifying data centers vendors as the leading end user segment.
The global NVMe over fiber channel market size is expected to rise at a CAGR of 23.9% during the forecast period 2025 to 2035. The global market valuation is anticipated to reach over USD 388,623.5 million by 2035.
Initially, traditional SSDs were used more commonly across various applications. However, with the introduction of NVMe SSD, there has been a huge rise in the switch towards NVMe SSDs. One of the major differences between SSDs and NVMe SSDs is that traditional SSDs store data with the help of integrated circuits whereas, NVMe is an interface used to access the data which is stored, at a much higher speed.
NVMe is more progressive than SSDs. It is therefore better encrypted and faster than the traditional SSDs. Consequently, the high demand for NVMe SSD is expected to drive the growth of the market on a global scale. The global market was exhibiting a CAGR of 21.8% over the historical period.
In 2025, the amount of data created and replicated has touched a new high. With a huge rise in data-generating devices such as wearable electronics, smartphones, connected devices, and others, there has been an exponential rise in data generation.
Moreover, with the growing popularity of cloud computing and the Internet of Things, there has been a massive rise in the overall volumes of data captured, created, copied, and consumed globally. Furthermore, the volume of digital data generated over the next five years is anticipated to be much greater than the volume of data generated since the advent of digital storage.
With such a massive rise in data generation, there arises a need for efficient data processing and storage tools and technologies. NVMe over fiber channel offers a highly optimized storage solution while reducing the latencies. Owing to this, NVMe technologies are increasingly being used in SSDs, servers, and storage appliances, thereby driving market growth.
Adoption of Sophisticated Technology to Drive The Market Growth
Companies operating in the market are delivering NVMe compatible products and solutions proactively, to help end users maneuver through the ever-changing requirements.
With the technological advancements in NVMe, there has been a rise in the use of NVMe technologies in SSDs, servers, and storage appliances. Companies have been working with software development teams to cater to their demand for customization, aimed at meeting their frequently-changing industry specific requirements.
United States to Take Over the Market
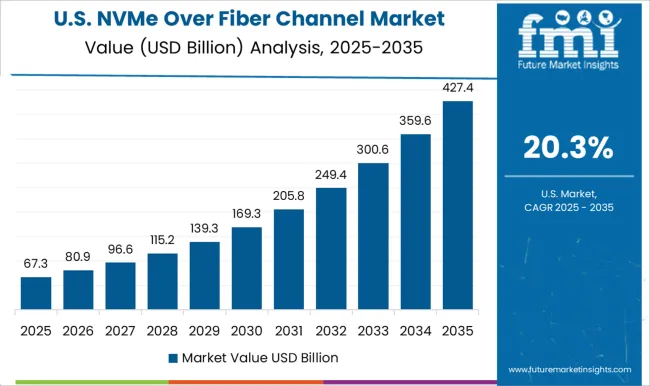
According to the Future Market Insights analysis, the overall NVMe over fiber channel spending in the United States alone is likely to increase at a rate of 21% between 2025 and 2035, with a market value of USD 5,190 million in 2025.
The United States will emerge as the largest market for the NVMe over fiber channel in North America, due to the strong presence of providers such as Intel Corporation, Cisco Systems, and IBM Corporation. The growth in the region is majorly attributed to the early acceptance of advanced and upcoming technologies in the region. Furthermore, the growing adoption of NVMe for Big Data, IoT, Artificial Intelligence, and Blockchain across data-driven organizations has led to a huge rise in demand for NVMe over fiber channel. Thereby driving the growth in the region.
The rising penetration of smartphones and internet in the country also contributed to the rise in data generation. With such a massive rise in data generation, there arises a need for efficient data processing and storage tools and technologies. Thereby driving market growth. United States has emerged as a leading market, accounted for over 21.1% of the total demand registered in 2025.
High Demand of Reduced Latencies to Boost the Nation’s Market
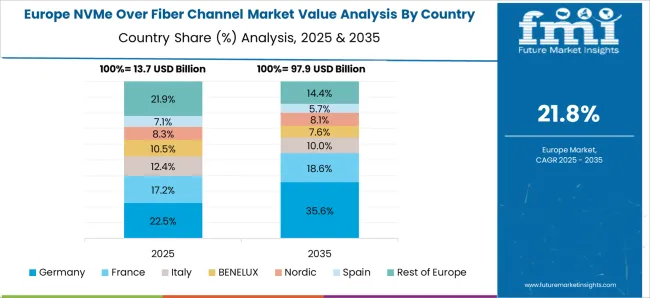
The market in Germany is anticipated to be valued at around USD 17,500 million by 2035. In recent years, many SMEs in European countries including the United Kingdom, France, and Germany are deploying NVMe over fiber channel products owing to the growing demand for reduced latencies and improved response times as compared to the traditional SSDs.
Germany, the United Kingdom, and other countries in Europe are projected to observe a significant amount of growth in the market for NVMe over fiber channel due to the changing dynamics of computing for the developers of tablets, notebooks, and laptops. Moreover, there has been a rise in emphasis on saving the time of consumers by speeding up data transfer. Owing to this, the demand for NVMe over fiber channel in the Europe market is anticipated to rise significantly in the coming years.
Emergence of Advanced Technologies to Propel The Chinese Imdustry Growth
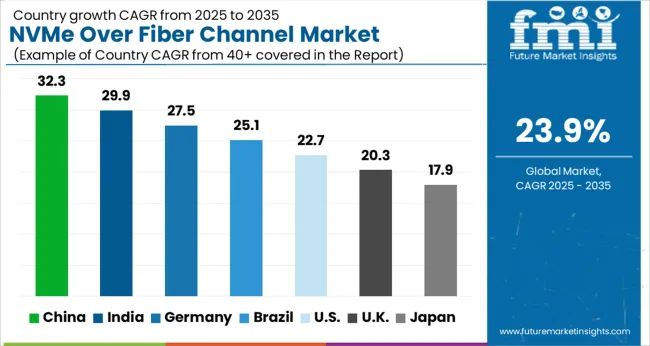
According to the Future Market Insights analysis, the market in the China is projected to rise at a CAGR of 25.5% over the upcoming decades from 2025 and 2035, with a market value of around USD 2,211.7 million in 2025. China, Japan, and South Korea are offering growth opportunities for NVMe over fiber channels owing to the rising number of internet users coupled with the growing popularity of digitization across East Asia.
In the wake of this pandemic, there has been an increase in demand for digitization to run businesses across the globe. The growing need for prompt communication for the efficient functioning of businesses has resulted in the generation of huge volumes of data, which is further responsible for driving the growth of NVMe over fiber channel deployment. Companies operating across China are focused on implementing advanced digital technologies and products to cope with rising data generation and reduce latencies, to improve business efficiency.
High Penetration of Internet Users to Expand the Market Growth
The market in India is anticipated to witness growth in revenue from around USD 69.8 million in 2025 to USD 12,810 million by 2035. The demand for NVMe over fiber channel has increased rapidly across various industry verticals in major economies of South Asia and the Pacific including India, Singapore, Malaysia, Indonesia, Australia, and New Zealand, which has created growth opportunities for the market.
In India, there has been a significant growth in the adoption of NVMe over fiber channel in the fields of IT & telecom, BFSI, and healthcare, among other industries. The growth can be attributed to the increasing number of internet users due to the rise in digitalization in the region.
The demand for NVMe over fiber channel is projected to exponentially grow as small and large enterprises seek efficient storage and processing of data. Furthermore, rapid growth in the enterprise end-user segment is further expected to drive the market. The market in India is projected to rise at a CAGR of 27.9% from 2025 to 2035.
Benefits of NVMe all-flash storage arrays to Drive Market Growth
Based on product, the market is segmented into NVMe all-flash storage arrays, NVMe switch adapters, NVMe SSD, and others. Out of which, the NVMe all-flash storage arrays segment is anticipated to grow at the highest CAGR of 25.9% over the forecast period. This widespread adoption is mainly due to the advantages provided by NVMe all-flash storage arrays.
NVMe SSDs are anticipated to hold the largest share of the market and were presented in the market as a storage device that provides reduced latency and faster read/write operations as compared to HDDs. NVMe is an interface that was designed specifically for SSDs, and NVMe SSDs were introduced to provide better data storage and processing operations, and the lowest latency possible when compared with HDDs and traditional SSDs.
NVME over fiber channel has registered 58% higher IOPS speed and 34% lower latency, which clearly states the advantages of the NVME over fiber channel application. The NVMe SSD also provides an improvement in CPU performance, faster data movement, and increased operational efficiency of the complete system. These benefits of solid-state drives are providing more traction to the segment in the market. NVMe SSD Segment accounted for the maximum market share of 36.1%.
Optimized Data Processing Solutions to Propel the Segment Growth
In terms of enterprise size, the market is segmented into small and medium enterprises (SMEs) and large enterprises. The large enterprises segment is expected to hold the largest share of the market accounting for USD 15,429.3 million in 2025, while growing at a considerable CAGR of 23% between 2025 and 2035.
The growth of the segment can be primarily attributed to the growing demand for efficient data processing solutions from enterprises, data center vendors, and telecom service providers. However, the small and medium enterprises segment is expected to grow at a CAGR of 24.9% until 2035.
High Speed Data Transfer to Drive the Segment Growth
In terms of end users, the market is segmented as data center vendors, networking vendors, telecom service providers, government, enterprises, and others. With the growing popularity of the internet and automation across all industries, there has been a rise in demand for NVMe over fiber channels in data centers and enterprises.
The data center vendor’s end user segment is dominating the global NVMe over fiber channel and it is estimated to account for 37.4% of the total market value share by the end of 2025. With the growing popularity of high speed data transfer and increasing implementation of advanced technologies across the globe, there has been a simultaneous rise in demand for NVMe over fiber channel as well.
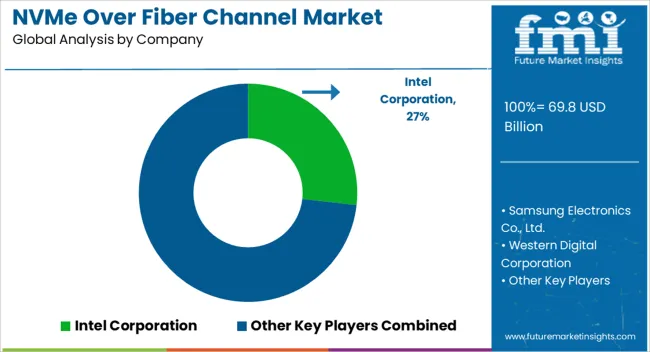
Companies offering NVMe over fiber channel are aiming at innovation and strategic partnerships with other software vendors to expand their portfolios while addressing the demand of an expanding customer pool.
Introduction of new solutions and services and strategic partnerships are key strategies adopted by the top players in the NVMe over fiber channel landscape. Solid investments are being made in the research and development segment by the global players in the market which is expected to provide substantial market developments.
The inclination of established players in the market happens to be toward the development of advanced memory technologies to fulfill the specific requirements of the customers, cultivating the demand for innovative and advanced products in the market.
NVMe over fiber channel providers are also focusing on entering into partnerships with technology and digital solution providers to target innovations within the market. The strategy helps companies to broaden their geographic reach with additional service portfolios.
| Attribute | Details |
|---|---|
| Forecast Period | 2025 to 2035 |
| Historical Data Available for | 2020 to 2025 |
| Market Analysis | USD million for Value |
| Regions Covered | North America; Latin America; Europe; South Asia; East Asia; Oceania; Middle East & Africa |
| Key Countries Covered | United States, Canada, Brazil, Mexico, Germany, United Kingdom, France, Spain, Italy, India, Malaysia, Singapore, Thailand, China, Japan, South Korea, Australia, New Zealand, GCC Countries, South Africa, Israel |
| Key Segments Covered | Product, Enterprise Size, End-User, Region |
| Key Companies Profiled | Intel Corporation; Samsung Electronics Co., Ltd.; Western Digital Corporation; Dell EMC; Hewlett Packard Enterprise; IBM; Cisco Systems Inc.; Microchip Technology Inc.; Broadcom Inc.; Marvell Technology Group |
| Customization & Pricing | Available upon Request |
The global NVMe over fiber channel market is estimated to be valued at USD 69.8 billion in 2025.
The market size for the NVMe over fiber channel market is projected to reach USD 595.0 billion by 2035.
The NVMe over fiber channel market is expected to grow at a 23.9% CAGR between 2025 and 2035.
The key product types in NVMe over fiber channel market are NVMe all-flash storage arrays, NVMe switch adapters, NVMe ssd and others.
In terms of enterprise size, small & medium enterprises (smes) segment to command 41.6% share in the NVMe over fiber channel market in 2025.


Our Research Products

The "Full Research Suite" delivers actionable market intel, deep dives on markets or technologies, so clients act faster, cut risk, and unlock growth.

The Leaderboard benchmarks and ranks top vendors, classifying them as Established Leaders, Leading Challengers, or Disruptors & Challengers.

Locates where complements amplify value and substitutes erode it, forecasting net impact by horizon

We deliver granular, decision-grade intel: market sizing, 5-year forecasts, pricing, adoption, usage, revenue, and operational KPIs—plus competitor tracking, regulation, and value chains—across 60 countries broadly.

Spot the shifts before they hit your P&L. We track inflection points, adoption curves, pricing moves, and ecosystem plays to show where demand is heading, why it is changing, and what to do next across high-growth markets and disruptive tech

Real-time reads of user behavior. We track shifting priorities, perceptions of today’s and next-gen services, and provider experience, then pace how fast tech moves from trial to adoption, blending buyer, consumer, and channel inputs with social signals (#WhySwitch, #UX).

Partner with our analyst team to build a custom report designed around your business priorities. From analysing market trends to assessing competitors or crafting bespoke datasets, we tailor insights to your needs.
Supplier Intelligence
Discovery & Profiling
Capacity & Footprint
Performance & Risk
Compliance & Governance
Commercial Readiness
Who Supplies Whom
Scorecards & Shortlists
Playbooks & Docs
Category Intelligence
Definition & Scope
Demand & Use Cases
Cost Drivers
Market Structure
Supply Chain Map
Trade & Policy
Operating Norms
Deliverables
Buyer Intelligence
Account Basics
Spend & Scope
Procurement Model
Vendor Requirements
Terms & Policies
Entry Strategy
Pain Points & Triggers
Outputs
Pricing Analysis
Benchmarks
Trends
Should-Cost
Indexation
Landed Cost
Commercial Terms
Deliverables
Brand Analysis
Positioning & Value Prop
Share & Presence
Customer Evidence
Go-to-Market
Digital & Reputation
Compliance & Trust
KPIs & Gaps
Outputs
Full Research Suite comprises of:
Market outlook & trends analysis
Interviews & case studies
Strategic recommendations
Vendor profiles & capabilities analysis
5-year forecasts
8 regions and 60+ country-level data splits
Market segment data splits
12 months of continuous data updates
DELIVERED AS:
PDF EXCEL ONLINE
RF-over-fiber Market – Connectivity & 5G Trends 2025 to 2035
Fiber Optic Probe Hydrophone (FOPH) Market Size and Share Forecast Outlook 2025 to 2035
Fiberglass Centrifugal Fan Market Size and Share Forecast Outlook 2025 to 2035
Over-night Hair Treatment Products Market Size and Share Forecast Outlook 2025 to 2035
Fiber to the Home Market Size and Share Forecast Outlook 2025 to 2035
Over-the-Counter Pain Medication Market Size and Share Forecast Outlook 2025 to 2035
Fiber Based Packaging Market Size and Share Forecast Outlook 2025 to 2035
Fiber Lid Market Forecast and Outlook 2025 to 2035
Fiberglass Tanks Market Size and Share Forecast Outlook 2025 to 2035
Fiber Sorter Market Size and Share Forecast Outlook 2025 to 2035
Fiber Reinforced Polymer Panel and Sheet Market Size and Share Forecast Outlook 2025 to 2035
Fiber Optic Tester Market Size and Share Forecast Outlook 2025 to 2035
Fiber Laser Market Size and Share Forecast Outlook 2025 to 2035
Fiberglass Market Size and Share Forecast Outlook 2025 to 2035
Fiber Spinning Equipment Market Size and Share Forecast Outlook 2025 to 2035
Fiber Reinforced Plastic (FRP) Panels & Sheets Market Size and Share Forecast Outlook 2025 to 2035
Fiberglass Fabric Market Size and Share Forecast Outlook 2025 to 2035
Fiber Optic Connectivity Market Size and Share Forecast Outlook 2025 to 2035
Fiber Optic Collimating Lens Market Size and Share Forecast Outlook 2025 to 2035
Overload Protection Tools Market Analysis - Size, Share, and Forecast Outlook 2025 to 2035

Thank you!
You will receive an email from our Business Development Manager. Please be sure to check your SPAM/JUNK folder too.
Chat With
MaRIA