Reports

- Global Locations -

Headquarters

Future Market Insights, Inc.

Christiana Corporate, 200
Continental Drive, Suite 401,
Newark, Delaware - 19713,
United States

T: +1-845-579-5705

Americas

Future Market Insights, Inc.

616 Corporate Way, Suite 2-9018,
Valley Cottage, NY 10989, United States

T: +1-347-918-3531

MEA

Future Market Insights

1602-6 Jumeirah Bay X2 Tower, Plot No: JLT-PH2-X2A,
Jumeirah Lakes Towers, Dubai,
United Arab Emirates

Europe

Future Market Insights

3rd Floor, 207 Regent Street,
W1B 3HH London
United Kingdom

T: + 44 (0) 20 8123 9659
D: +44 (0) 20 3287 4268

Asia Pacific

Future Market Insights

IndiaLand Global Tech Park, Unit UG-1, Behind Grand HighStreet, Phase 1, Hinjawadi, MH, Pune – 411057, India

Hangover Cure Product Market Outlook for 2024 to 2034

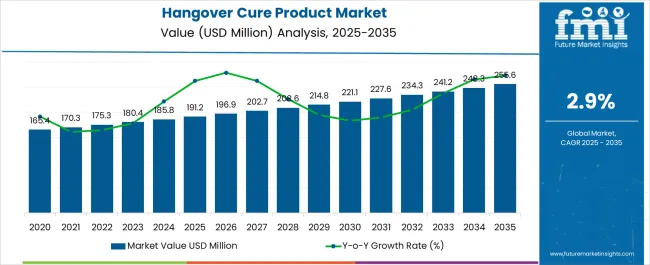
The hangover cure product market reached US$ 2,112.8 million in 2023. The demand for hangover cure products is anticipated to rise at a CAGR of 8.20% from 2023 to 2033. The total valuation of the market is predicted to increase from US$ 2,221.6 million in 2024 to US$ 4,885.9 million by 2034.

Attributes Key Insights
Hangover Cure Product Market Size (2023) US$ 2,112.8 million
Estimated Market Value (2024) US$ 2,221.6 million
Projected Market Revenue (2034) US$ 4,885.9 million
Value-based CAGR (2024 to 2034) 8.20%

Don't pay for what you don't need

Customize your report by selecting specific countries or regions and save 30%!

Key Market Highlights

The global hangover cure product market is very likely to experience exponential growth in the coming future. This rapid surge in demand is attributed to:

  • Increased occurrence of hangovers due to the rising trend of social drinking and celebratory events
  • Rising consumer lifestyles involving late-night socializing, clubbing, and alcohol consumption in urban and semi-urban setups
  • Expanding consumer base encompassing not only frequent partygoers but also individuals with occasional alcohol consumption
  • Increasing number of innovative hangover cure formulations by key players in the international market
  • Increasing ease of purchasing hangover cure products due to the booming eCommerce sector in developing and underdeveloped economies
  • Effective marketing and branding strategies, including endorsements by influencers and celebrities

All these factors have collectively contributed to the remarkable trajectory of the hangover cure product market.

Consumption Analysis of the Hangover Cure Product Market

In the last few years, there has been an increased demand for hangover cure products in the international marketplace. The consumer pool of this market generally comprises:

  • Social drinkers and partygoers who consume alcohol regularly and often seek effective solutions to alleviate or prevent hangover symptoms
  • Individuals participating in celebratory events where alcohol consumption is prevalent
  • Occasional drinkers who consume alcohol on specific occasions are interested in minimizing the impact on their well-being
  • Individuals engaged in fitness and wellness activities may turn to hangover cure products after socializing, aiming to counteract the adverse effects of alcohol
  • People on vacations or business trips, where social events and alcohol consumption are common
Sudip Saha
Sudip Saha

Principal Consultant

Talk to Analyst

Find your sweet spots for generating winning opportunities in this market.

Historical Analysis of the Hangover Cure Product Market

Attributes Key Statistics
Hangover Cure Product Market Value (2019) US$ 1,643.3 million
Historical Market Value (2023) US$ 2,112.8 million
HCAGR (2019 to 2023) 6.50%

The hangover cure product relies heavily on consumer drinking habits, socializing patterns, and the overall lifestyle choices of the target demographic, which includes people in all age groups. The market also follows health and wellness trends in the world. As more individuals worldwide adopted the global drinking culture, the demand for these products increased during the historical period. In the last few years, the hangover cure product market has seen a series of ups and downs.

During the pandemic, when the world faced sudden shutdowns, there was a noticeable plunge in demand for hangover cure products. As people stopped socializing in bars and restaurants, there was a decrease in the consumption of alcoholic beverages in the initial phases of the pandemic. Supply chain disruptions also adversely impacted the market. However, as the world adapted to this new normal, people started spending more time in their homes, resulting in more alcohol consumption.

Post-pandemic, the market experienced remarkable growth due to the revival of the hospitality sector. The financial situation of many economies also improved, which meant that people had more disposable income to spend on socializing and partying. This period proved to be very beneficial for the market as consumers all over the world sought effective remedies to alleviate post-celebration effects.

Factors Adversely Affecting the Hangover Cure Product Market

Various factors are responsible for restraining the market growth. Some of them are as follows:

  • Ongoing war-like situations in the European and Middle Eastern countries have significantly destroyed the supply chain in that region. Disruptions in the supply chain have impacted the market's ability to meet consumer demand.
  • Decreased social activities due to pandemic or political unrest in the region also
  • affected the hangover cure product market by leading to a reduction in gatherings and events.
  • During fiscal downturns or recessionary economic times, it is observed that consumers cut down on alcohol consumption and discretionary spending, including non-essential products like hangover cures.
  • Commercial hangover cure products face the largest competition from home remedies, which are often cost-effective and easily accessible. This is one of the biggest restraints for this market.

Get the data you need at a Fraction of the cost

Personalize your report by choosing insights you need
and save 40%!

Comparative Analysis of Adjacent Markets

The section provides a comprehensive study of the alcohol industry and has come up with two more markets, the sugar alcohol market and the low-alcohol beverages market, that have the potential to give rigorous competition to the hangover cure product market. The growth rates and other attributes influencing these markets are mentioned in the table below. Along with this, future opportunities for market players have also been jotted down. Based on these numbers, it can be confidently projected that the market for hangover cure products is very likely to overpower the other two over the coming decade.

Hangover Cure Product Market:

Attributes Hangover Cure Product Market
CAGR (2024 to 2034) 8.20%
Growth Factors
  • Increasing alcohol consumption across the world
  • The rise of Western corporate culture in developing and underdeveloped countries
Future Opportunities
  • Key market players are developing innovative formulations with added health benefits, such as vitamins, electrolytes, and natural ingredients
  • They are also partnering with wellness brands or influencers in the health and fitness industry to tap into new consumer segments

Sugar Alcohol Market:

Attributes Sugar Alcohol Market
CAGR (2023 to 2033) 4.20%
Growth Factors
  • Growing consumer demand for foods and beverages low in calories and sugar
  • Growing numbers of obese and diabetic individuals across the world
Future Opportunities
  • Key market players are investing in expanding the range of products incorporating sugar alcohols, including beverages, confectionery, baked goods, and dairy products.
  • They are also integrating sugar alcohols into functional food and beverages, such as energy drinks or nutritional snacks, to cater to the demands of health-conscious consumers

Low-alcohol Beverages Market:

Attributes Low-alcohol Beverages Market
CAGR (2023 to 2033) 5.30%
Growth Factors
  • Increased knowledge of the harmful effects of high-alcohol beverages
  • Consumers are increasingly seeking healthier, tastier, and innovative low-alcohol drinks that satisfy their health goals
Future Opportunities
  • Key market players are creating innovative low-alcohol beverage formulations that provide unique flavors, functional benefits, and an enhanced drinking experience.
  • They are also collaborating with craft brewers and distillers to create high-quality, artisanal, low-alcohol beverages that can tap into the craft beverage trend

Category-wise Insights

Hangover Tablets and Capsules Gaining Traction in the Global Marketplace

Attributes Details
Top Product Tablets and Capsules
Market Share in 2024 35.60%

In recent years, it has been observed that there has been a significant surge in demand for hangover tablets and capsules, as they offer a hassle-free alternative to traditional remedies. This growing traction can also be attributed to precise and easily manageable dosages of ingredients in the tablets believed to alleviate hangover symptoms.

The increased demand is also due to the on-the-go compactness of tablets, which suits the preferences of today’s youth. On the basis of product, tablets/capsules dominate the hangover cure product market with a whopping share of 35.60% in 2024.

Hangover Remedies to Set the Trend Among the Urban Youth Population

Attributes Details
Top Type Hangover Remedies
Market Share in 2024 69.40%

As individuals lead busy lives filled with social engagements and celebrations, the need for effective recovery solutions from the aftermath of alcohol consumption has intensified. The rise of health consciousness is one of the main drivers behind the popularity of hangover remedies.

With an increasing emphasis on overall well-being, consumers are drawn to products formulated with natural and functional ingredients. Based on type, the hangover remedies segment dominates the hangover cure product market, with a share of 69.40%.

Country-wise Insights

The section provides an analysis of the hangover cure product market by countries, including China, India, Australia, the United States, and Germany. The table presents the CAGR for each country, indicating the expected growth of the market in that country through 2034.

Countries CAGR (2024 to 2034)
China 10.10%
India 9.00%
Australia 8.50%
United States 7.40%
Germany 6.60%

Increasing Westernized Corporate Culture Fueling Sales of Hangover Cure Products in China

China is one of the leading countries in Asia for the hangover cure product market. The market in China is anticipated to grow at a CAGR of 10.10% over the forecast period.

China is home to one of the largest populations in the world, with a majority of them in the drinking age. The cultural significance of socializing and celebrations, often accompanied by alcohol consumption, contributes to the demand for effective recovery solutions. The Chinese population is also increasingly accepting the Westernized corporate culture, which involves parties where alcohol consumption is very common. All these factors are collectively contributing to market growth for hangover cure products.

Enhanced Overall Drinking Experience Stimulating Market Growth in India

The Indian market is estimated to register a CAGR of 9.00% through 2034. India is known for its cultural diversity, which includes festivals, gatherings, functions, etc. These events contribute to increased instances of alcohol consumption, thus contributing to the overall market for hangover cure products.

The market growth can also be attributed to the rise in disposable incomes of the Indian middle class, inclined to explore and invest in products that enhance their overall drinking experience.

Relaxing Trend of Vacation Driving Hangover Cure Product Market in Australia

The hangover cure product market has a very bright future in the Australian region. It is anticipated that the market is bound to grow at a remarkable CAGR of 8.5% over the forecast period.

More than 80% of the Australian population resides in the coastal region. These areas are famous for their vibrant beach experience and alcohol consumption. This is one of the main reasons for the market’s significant performance in Australia. Apart from this, millions of tourists visit Australia throughout the year to have a relaxing vacation, further contributing to the market.
Novel Formulations by Startups Propelling the United States Market

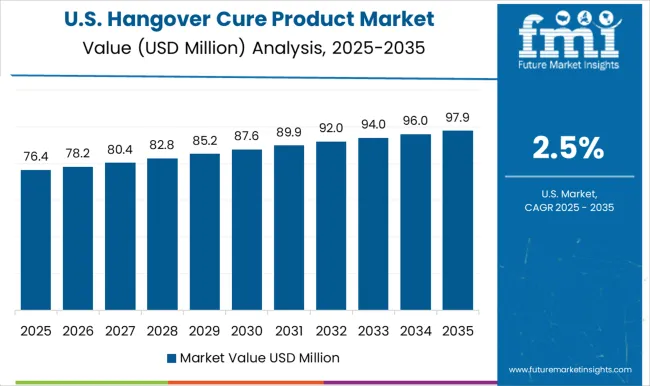
The hangover cure product market in the United States is anticipated to grow at a significant CAGR of 7.40% from 2024 to 2034. The United States market is also accentuated by numerous startups and established brands continuously introducing novel formulations and delivery methods.
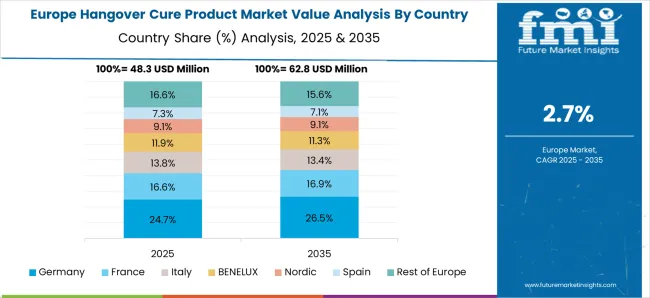
Rising Health Concerns Among Drinking Population Driving Market in Germany

The German hangover cure product market is anticipated to exhibit a modest CAGR of 6.60% over the forecast period.

With a rich tradition for beer festivals and social gatherings, Germany offers great opportunities for the market to thrive. Besides this, the German people are concerned about their health and thus seek hangover cure products that not only address the aftereffects of alcohol consumption but are also made up of natural, clean-label ingredients. These factors have led to an exponential expansion of the hangover cure product market in Germany.
Competitive Landscape in the Hangover Cure Product Market

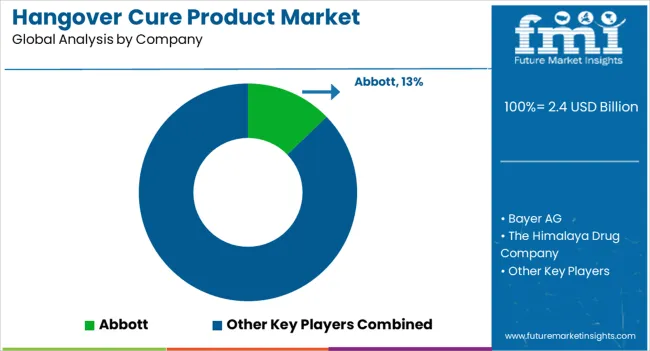
The market for hangover cure products is still in its nascent stages, with a very few companies in the international market. There is no single company that has complete dominance in the international marketplace. This gives a huge opportunity for local small-scale brands to gain a strong foothold in their respective areas.

Key market players are also focusing on producing novel formulations to cater to consumer demand. They are adopting strategies to expand their market reach and increase awareness about hangover cure products.

Recent Developments

  • In 2023, Indian startup Danta Ventures Private Limited, gained praise at GIS for its innovative hangover cure, which is a colloidal solution with featured nanoparticles delivering multi-scale oxygen particles, reducing stress on the body and preventing hangovers.
  • In 2022, Swedish brand Myrkl introduced a hangover-curing pill that claimed to break down 70% of alcohol in the body within 60 minutes and reduce the effects of a hangover.

Key Companies

  • Abbott
  • Bayer AG
  • More Labs
  • The Himalaya Drug Company
  • Rally Labs LLC (Blowfish)
  • Flyby
  • Drinkwel, LLC
  • Cheers Health
  • Liquid I.V., Inc.
  • DOTSHOT
  • AfterDrink Ltd.
  • Toniiq
  • Purple Tree Labs
  • No Days Wasted
  • LES Labs (Detoxx)
  • EZ Lifestyle (Over EZ)
  • DrinkAde
  • Kaplan Laboratory, LLC (H-PROOF)
  • Bytox
  • Cheal Hangover Patch
  • Party Patch
  • Rebound Hangover Patch
  • TRIO Patch
  • SmartPatches
  • D-Tox Hangover Patches
  • La Mend, Inc. (The Good Patch)
  • RallyPatch, LLC
  • Ozmo Patch
  • Wet Buffalo Patch
  • LiveToShine
  • AWKN

Key Market Segmentation

By Products:

  • Solutions
  • Tablets/Capsules
  • Powder
  • Patches

By Types:

  • Hangover Prevention
  • Hangover Remedies

By Distribution Channels:

  • Online
  • Offline

By Regions:

  • Europe
  • Asia Pacific
  • North America
  • Latin America
  • Middle East and Africa

Frequently Asked Questions

What was the Value of the Hangover Cure Product Market in 2023?

The global hangover cure product market was valued at US$ 2,112.8 million in 2023.

How Big is the Market in 2024?

The market is estimated to be valued at US$ 2221.6 million by 2024.

At What Rate will the Demand for Hangover Cure Products Rise through 2034?

The hangover cure product demand is anticipated to rise at an 8.20% CAGR through 2034

What is the Expected Size of the Market by 2034?

The market is expected to reach US$ 4,885.9 million by 2034.

Which is the Most Preferred Hangover Cure Product in the International Market?

Tablets/capsules are the most preferred product type in this market.

Table of Content

1. Executive Summary

    1.1. Global Market Outlook

    1.2. Demand-side Trends

    1.3. Supply-side Trends

    1.4. Technology Roadmap Analysis

    1.5. Analysis and Recommendations

2. Market Overview

    2.1. Market Coverage / Taxonomy

    2.2. Market Definition / Scope / Limitations

3. Market Background

    3.1. Market Dynamics

        3.1.1. Drivers

        3.1.2. Restraints

        3.1.3. Opportunity

        3.1.4. Trends

    3.2. Scenario Forecast

        3.2.1. Demand in Optimistic Scenario

        3.2.2. Demand in Likely Scenario

        3.2.3. Demand in Conservative Scenario

    3.3. Opportunity Map Analysis

    3.4. Product Life Cycle Analysis

    3.5. Supply Chain Analysis

        3.5.1. Supply Side Participants and their Roles

            3.5.1.1. Producers

            3.5.1.2. Mid-Level Participants (Traders/ Agents/ Brokers)

            3.5.1.3. Wholesalers and Distributors

        3.5.2. Value Added and Value Created at Node in the Supply Chain

        3.5.3. List of Raw Material Suppliers

        3.5.4. List of Existing and Potential Buyer’s

    3.6. Investment Feasibility Matrix

    3.7. Value Chain Analysis

        3.7.1. Profit Margin Analysis

        3.7.2. Wholesalers and Distributors

        3.7.3. Retailers

    3.8. PESTLE and Porter’s Analysis

    3.9. Regulatory Landscape

        3.9.1. By Key Regions

        3.9.2. By Key Countries

    3.10. Regional Parent Market Outlook

    3.11. Production and Consumption Statistics

    3.12. Import and Export Statistics

4. Global Market Analysis 2019 to 2023 and Forecast, 2024 to 2034

    4.1. Historical Market Size Value (US$ Million) & Volume (Units) Analysis, 2019 to 2023

    4.2. Current and Future Market Size Value (US$ Million) & Volume (Units) Projections, 2024 to 2034

        4.2.1. Y-o-Y Growth Trend Analysis

        4.2.2. Absolute $ Opportunity Analysis

5. Global Market Analysis 2019 to 2023 and Forecast 2024 to 2034, By Product

    5.1. Introduction / Key Findings

    5.2. Historical Market Size Value (US$ Million) & Volume (Units) Analysis By Product, 2019 to 2023

    5.3. Current and Future Market Size Value (US$ Million) & Volume (Units) Analysis and Forecast By Product, 2024 to 2034

        5.3.1. Solutions

        5.3.2. Tablets/Capsules

        5.3.3. Powder

        5.3.4. Patches

    5.4. Y-o-Y Growth Trend Analysis By Product, 2019 to 2023

    5.5. Absolute $ Opportunity Analysis By Product, 2024 to 2034

6. Global Market Analysis 2019 to 2023 and Forecast 2024 to 2034, By Type

    6.1. Introduction / Key Findings

    6.2. Historical Market Size Value (US$ Million) & Volume (Units) Analysis By Type, 2019 to 2023

    6.3. Current and Future Market Size Value (US$ Million) & Volume (Units) Analysis and Forecast By Type, 2024 to 2034

        6.3.1. Hangover Prevention

        6.3.2. Hangover Remedies

    6.4. Y-o-Y Growth Trend Analysis By Type, 2019 to 2023

    6.5. Absolute $ Opportunity Analysis By Type, 2024 to 2034

7. Global Market Analysis 2019 to 2023 and Forecast 2024 to 2034, By Distribution Channel

    7.1. Introduction / Key Findings

    7.2. Historical Market Size Value (US$ Million) & Volume (Units) Analysis By Distribution Channel, 2019 to 2023

    7.3. Current and Future Market Size Value (US$ Million) & Volume (Units) Analysis and Forecast By Distribution Channel, 2024 to 2034

        7.3.1. Online

        7.3.2. Offline

    7.4. Y-o-Y Growth Trend Analysis By Distribution Channel, 2019 to 2023

    7.5. Absolute $ Opportunity Analysis By Distribution Channel, 2024 to 2034

8. Global Market Analysis 2019 to 2023 and Forecast 2024 to 2034, By Region

    8.1. Introduction

    8.2. Historical Market Size Value (US$ Million) & Volume (Units) Analysis By Region, 2019 to 2023

    8.3. Current Market Size Value (US$ Million) & Volume (Units) Analysis and Forecast By Region, 2024 to 2034

        8.3.1. North America

        8.3.2. Latin America

        8.3.3. Western Europe

        8.3.4. Eastern Europe

        8.3.5. South Asia and Pacific

        8.3.6. East Asia

        8.3.7. Middle East and Africa

    8.4. Market Attractiveness Analysis By Region

9. North America Market Analysis 2019 to 2023 and Forecast 2024 to 2034, By Country

    9.1. Historical Market Size Value (US$ Million) & Volume (Units) Trend Analysis By Market Taxonomy, 2019 to 2023

    9.2. Market Size Value (US$ Million) & Volume (Units) Forecast By Market Taxonomy, 2024 to 2034

        9.2.1. By Country

            9.2.1.1. USA

            9.2.1.2. Canada

        9.2.2. By Product

        9.2.3. By Type

        9.2.4. By Distribution Channel

    9.3. Market Attractiveness Analysis

        9.3.1. By Country

        9.3.2. By Product

        9.3.3. By Type

        9.3.4. By Distribution Channel

    9.4. Key Takeaways

10. Latin America Market Analysis 2019 to 2023 and Forecast 2024 to 2034, By Country

    10.1. Historical Market Size Value (US$ Million) & Volume (Units) Trend Analysis By Market Taxonomy, 2019 to 2023

    10.2. Market Size Value (US$ Million) & Volume (Units) Forecast By Market Taxonomy, 2024 to 2034

        10.2.1. By Country

            10.2.1.1. Brazil

            10.2.1.2. Mexico

            10.2.1.3. Rest of Latin America

        10.2.2. By Product

        10.2.3. By Type

        10.2.4. By Distribution Channel

    10.3. Market Attractiveness Analysis

        10.3.1. By Country

        10.3.2. By Product

        10.3.3. By Type

        10.3.4. By Distribution Channel

    10.4. Key Takeaways

11. Western Europe Market Analysis 2019 to 2023 and Forecast 2024 to 2034, By Country

    11.1. Historical Market Size Value (US$ Million) & Volume (Units) Trend Analysis By Market Taxonomy, 2019 to 2023

    11.2. Market Size Value (US$ Million) & Volume (Units) Forecast By Market Taxonomy, 2024 to 2034

        11.2.1. By Country

            11.2.1.1. Germany

            11.2.1.2. UK

            11.2.1.3. France

            11.2.1.4. Spain

            11.2.1.5. Italy

            11.2.1.6. Rest of Western Europe

        11.2.2. By Product

        11.2.3. By Type

        11.2.4. By Distribution Channel

    11.3. Market Attractiveness Analysis

        11.3.1. By Country

        11.3.2. By Product

        11.3.3. By Type

        11.3.4. By Distribution Channel

    11.4. Key Takeaways

12. Eastern Europe Market Analysis 2019 to 2023 and Forecast 2024 to 2034, By Country

    12.1. Historical Market Size Value (US$ Million) & Volume (Units) Trend Analysis By Market Taxonomy, 2019 to 2023

    12.2. Market Size Value (US$ Million) & Volume (Units) Forecast By Market Taxonomy, 2024 to 2034

        12.2.1. By Country

            12.2.1.1. Poland

            12.2.1.2. Russia

            12.2.1.3. Czech Republic

            12.2.1.4. Romania

            12.2.1.5. Rest of Eastern Europe

        12.2.2. By Product

        12.2.3. By Type

        12.2.4. By Distribution Channel

    12.3. Market Attractiveness Analysis

        12.3.1. By Country

        12.3.2. By Product

        12.3.3. By Type

        12.3.4. By Distribution Channel

    12.4. Key Takeaways

13. South Asia and Pacific Market Analysis 2019 to 2023 and Forecast 2024 to 2034, By Country

    13.1. Historical Market Size Value (US$ Million) & Volume (Units) Trend Analysis By Market Taxonomy, 2019 to 2023

    13.2. Market Size Value (US$ Million) & Volume (Units) Forecast By Market Taxonomy, 2024 to 2034

        13.2.1. By Country

            13.2.1.1. India

            13.2.1.2. Bangladesh

            13.2.1.3. Australia

            13.2.1.4. New Zealand

            13.2.1.5. Rest of South Asia and Pacific

        13.2.2. By Product

        13.2.3. By Type

        13.2.4. By Distribution Channel

    13.3. Market Attractiveness Analysis

        13.3.1. By Country

        13.3.2. By Product

        13.3.3. By Type

        13.3.4. By Distribution Channel

    13.4. Key Takeaways

14. East Asia Market Analysis 2019 to 2023 and Forecast 2024 to 2034, By Country

    14.1. Historical Market Size Value (US$ Million) & Volume (Units) Trend Analysis By Market Taxonomy, 2019 to 2023

    14.2. Market Size Value (US$ Million) & Volume (Units) Forecast By Market Taxonomy, 2024 to 2034

        14.2.1. By Country

            14.2.1.1. China

            14.2.1.2. Japan

            14.2.1.3. South Korea

        14.2.2. By Product

        14.2.3. By Type

        14.2.4. By Distribution Channel

    14.3. Market Attractiveness Analysis

        14.3.1. By Country

        14.3.2. By Product

        14.3.3. By Type

        14.3.4. By Distribution Channel

    14.4. Key Takeaways

15. Middle East and Africa Market Analysis 2019 to 2023 and Forecast 2024 to 2034, By Country

    15.1. Historical Market Size Value (US$ Million) & Volume (Units) Trend Analysis By Market Taxonomy, 2019 to 2023

    15.2. Market Size Value (US$ Million) & Volume (Units) Forecast By Market Taxonomy, 2024 to 2034

        15.2.1. By Country

            15.2.1.1. GCC Countries

            15.2.1.2. South Africa

            15.2.1.3. Israel

            15.2.1.4. Rest of MEA

        15.2.2. By Product

        15.2.3. By Type

        15.2.4. By Distribution Channel

    15.3. Market Attractiveness Analysis

        15.3.1. By Country

        15.3.2. By Product

        15.3.3. By Type

        15.3.4. By Distribution Channel

    15.4. Key Takeaways

16. Key Countries Market Analysis

    16.1. USA

        16.1.1. Pricing Analysis

        16.1.2. Market Share Analysis, 2023

            16.1.2.1. By Product

            16.1.2.2. By Type

            16.1.2.3. By Distribution Channel

    16.2. Canada

        16.2.1. Pricing Analysis

        16.2.2. Market Share Analysis, 2023

            16.2.2.1. By Product

            16.2.2.2. By Type

            16.2.2.3. By Distribution Channel

    16.3. Brazil

        16.3.1. Pricing Analysis

        16.3.2. Market Share Analysis, 2023

            16.3.2.1. By Product

            16.3.2.2. By Type

            16.3.2.3. By Distribution Channel

    16.4. Mexico

        16.4.1. Pricing Analysis

        16.4.2. Market Share Analysis, 2023

            16.4.2.1. By Product

            16.4.2.2. By Type

            16.4.2.3. By Distribution Channel

    16.5. Germany

        16.5.1. Pricing Analysis

        16.5.2. Market Share Analysis, 2023

            16.5.2.1. By Product

            16.5.2.2. By Type

            16.5.2.3. By Distribution Channel

    16.6. UK

        16.6.1. Pricing Analysis

        16.6.2. Market Share Analysis, 2023

            16.6.2.1. By Product

            16.6.2.2. By Type

            16.6.2.3. By Distribution Channel

    16.7. France

        16.7.1. Pricing Analysis

        16.7.2. Market Share Analysis, 2023

            16.7.2.1. By Product

            16.7.2.2. By Type

            16.7.2.3. By Distribution Channel

    16.8. Spain

        16.8.1. Pricing Analysis

        16.8.2. Market Share Analysis, 2023

            16.8.2.1. By Product

            16.8.2.2. By Type

            16.8.2.3. By Distribution Channel

    16.9. Italy

        16.9.1. Pricing Analysis

        16.9.2. Market Share Analysis, 2023

            16.9.2.1. By Product

            16.9.2.2. By Type

            16.9.2.3. By Distribution Channel

    16.10. Poland

        16.10.1. Pricing Analysis

        16.10.2. Market Share Analysis, 2023

            16.10.2.1. By Product

            16.10.2.2. By Type

            16.10.2.3. By Distribution Channel

    16.11. Russia

        16.11.1. Pricing Analysis

        16.11.2. Market Share Analysis, 2023

            16.11.2.1. By Product

            16.11.2.2. By Type

            16.11.2.3. By Distribution Channel

    16.12. Czech Republic

        16.12.1. Pricing Analysis

        16.12.2. Market Share Analysis, 2023

            16.12.2.1. By Product

            16.12.2.2. By Type

            16.12.2.3. By Distribution Channel

    16.13. Romania

        16.13.1. Pricing Analysis

        16.13.2. Market Share Analysis, 2023

            16.13.2.1. By Product

            16.13.2.2. By Type

            16.13.2.3. By Distribution Channel

    16.14. India

        16.14.1. Pricing Analysis

        16.14.2. Market Share Analysis, 2023

            16.14.2.1. By Product

            16.14.2.2. By Type

            16.14.2.3. By Distribution Channel

    16.15. Bangladesh

        16.15.1. Pricing Analysis

        16.15.2. Market Share Analysis, 2023

            16.15.2.1. By Product

            16.15.2.2. By Type

            16.15.2.3. By Distribution Channel

    16.16. Australia

        16.16.1. Pricing Analysis

        16.16.2. Market Share Analysis, 2023

            16.16.2.1. By Product

            16.16.2.2. By Type

            16.16.2.3. By Distribution Channel

    16.17. New Zealand

        16.17.1. Pricing Analysis

        16.17.2. Market Share Analysis, 2023

            16.17.2.1. By Product

            16.17.2.2. By Type

            16.17.2.3. By Distribution Channel

    16.18. China

        16.18.1. Pricing Analysis

        16.18.2. Market Share Analysis, 2023

            16.18.2.1. By Product

            16.18.2.2. By Type

            16.18.2.3. By Distribution Channel

    16.19. Japan

        16.19.1. Pricing Analysis

        16.19.2. Market Share Analysis, 2023

            16.19.2.1. By Product

            16.19.2.2. By Type

            16.19.2.3. By Distribution Channel

    16.20. South Korea

        16.20.1. Pricing Analysis

        16.20.2. Market Share Analysis, 2023

            16.20.2.1. By Product

            16.20.2.2. By Type

            16.20.2.3. By Distribution Channel

    16.21. GCC Countries

        16.21.1. Pricing Analysis

        16.21.2. Market Share Analysis, 2023

            16.21.2.1. By Product

            16.21.2.2. By Type

            16.21.2.3. By Distribution Channel

    16.22. South Africa

        16.22.1. Pricing Analysis

        16.22.2. Market Share Analysis, 2023

            16.22.2.1. By Product

            16.22.2.2. By Type

            16.22.2.3. By Distribution Channel

    16.23. Israel

        16.23.1. Pricing Analysis

        16.23.2. Market Share Analysis, 2023

            16.23.2.1. By Product

            16.23.2.2. By Type

            16.23.2.3. By Distribution Channel

17. Market Structure Analysis

    17.1. Competition Dashboard

    17.2. Competition Benchmarking

    17.3. Market Share Analysis of Top Players

        17.3.1. By Regional

        17.3.2. By Product

        17.3.3. By Type

        17.3.4. By Distribution Channel

18. Competition Analysis

    18.1. Competition Deep Dive

        18.1.1. Abbott

            18.1.1.1. Overview

            18.1.1.2. Product Portfolio

            18.1.1.3. Profitability by Market Segments

            18.1.1.4. Sales Footprint

            18.1.1.5. Strategy Overview

                18.1.1.5.1. Marketing Strategy

                18.1.1.5.2. Product Strategy

                18.1.1.5.3. Channel Strategy

        18.1.2. Bayer AG

            18.1.2.1. Overview

            18.1.2.2. Product Portfolio

            18.1.2.3. Profitability by Market Segments

            18.1.2.4. Sales Footprint

            18.1.2.5. Strategy Overview

                18.1.2.5.1. Marketing Strategy

                18.1.2.5.2. Product Strategy

                18.1.2.5.3. Channel Strategy

        18.1.3. More Labs

            18.1.3.1. Overview

            18.1.3.2. Product Portfolio

            18.1.3.3. Profitability by Market Segments

            18.1.3.4. Sales Footprint

            18.1.3.5. Strategy Overview

                18.1.3.5.1. Marketing Strategy

                18.1.3.5.2. Product Strategy

                18.1.3.5.3. Channel Strategy

        18.1.4. The Himalaya Drug Company

            18.1.4.1. Overview

            18.1.4.2. Product Portfolio

            18.1.4.3. Profitability by Market Segments

            18.1.4.4. Sales Footprint

            18.1.4.5. Strategy Overview

                18.1.4.5.1. Marketing Strategy

                18.1.4.5.2. Product Strategy

                18.1.4.5.3. Channel Strategy

        18.1.5. Rally Labs LLC (Blowfish)

            18.1.5.1. Overview

            18.1.5.2. Product Portfolio

            18.1.5.3. Profitability by Market Segments

            18.1.5.4. Sales Footprint

            18.1.5.5. Strategy Overview

                18.1.5.5.1. Marketing Strategy

                18.1.5.5.2. Product Strategy

                18.1.5.5.3. Channel Strategy

        18.1.6. Flyby

            18.1.6.1. Overview

            18.1.6.2. Product Portfolio

            18.1.6.3. Profitability by Market Segments

            18.1.6.4. Sales Footprint

            18.1.6.5. Strategy Overview

                18.1.6.5.1. Marketing Strategy

                18.1.6.5.2. Product Strategy

                18.1.6.5.3. Channel Strategy

        18.1.7. Drinkwel, LLC

            18.1.7.1. Overview

            18.1.7.2. Product Portfolio

            18.1.7.3. Profitability by Market Segments

            18.1.7.4. Sales Footprint

            18.1.7.5. Strategy Overview

                18.1.7.5.1. Marketing Strategy

                18.1.7.5.2. Product Strategy

                18.1.7.5.3. Channel Strategy

        18.1.8. Cheers Health

            18.1.8.1. Overview

            18.1.8.2. Product Portfolio

            18.1.8.3. Profitability by Market Segments

            18.1.8.4. Sales Footprint

            18.1.8.5. Strategy Overview

                18.1.8.5.1. Marketing Strategy

                18.1.8.5.2. Product Strategy

                18.1.8.5.3. Channel Strategy

        18.1.9. Liquid I.V., Inc.

            18.1.9.1. Overview

            18.1.9.2. Product Portfolio

            18.1.9.3. Profitability by Market Segments

            18.1.9.4. Sales Footprint

            18.1.9.5. Strategy Overview

                18.1.9.5.1. Marketing Strategy

                18.1.9.5.2. Product Strategy

                18.1.9.5.3. Channel Strategy

        18.1.10. DOTSHOT

            18.1.10.1. Overview

            18.1.10.2. Product Portfolio

            18.1.10.3. Profitability by Market Segments

            18.1.10.4. Sales Footprint

            18.1.10.5. Strategy Overview

                18.1.10.5.1. Marketing Strategy

                18.1.10.5.2. Product Strategy

                18.1.10.5.3. Channel Strategy

        18.1.11. AfterDrink Ltd.

            18.1.11.1. Overview

            18.1.11.2. Product Portfolio

            18.1.11.3. Profitability by Market Segments

            18.1.11.4. Sales Footprint

            18.1.11.5. Strategy Overview

                18.1.11.5.1. Marketing Strategy

                18.1.11.5.2. Product Strategy

                18.1.11.5.3. Channel Strategy

19. Assumptions & Acronyms Used

20. Research Methodology

List of Tables

Table 1: Global Market Value (US$ Million) Forecast by Region, 2019 to 2034

Table 2: Global Market Volume (Units) Forecast by Region, 2019 to 2034

Table 3: Global Market Value (US$ Million) Forecast by Product, 2019 to 2034

Table 4: Global Market Volume (Units) Forecast by Product, 2019 to 2034

Table 5: Global Market Value (US$ Million) Forecast by Type, 2019 to 2034

Table 6: Global Market Volume (Units) Forecast by Type, 2019 to 2034

Table 7: Global Market Value (US$ Million) Forecast by Distribution Channel, 2019 to 2034

Table 8: Global Market Volume (Units) Forecast by Distribution Channel, 2019 to 2034

Table 9: North America Market Value (US$ Million) Forecast by Country, 2019 to 2034

Table 10: North America Market Volume (Units) Forecast by Country, 2019 to 2034

Table 11: North America Market Value (US$ Million) Forecast by Product, 2019 to 2034

Table 12: North America Market Volume (Units) Forecast by Product, 2019 to 2034

Table 13: North America Market Value (US$ Million) Forecast by Type, 2019 to 2034

Table 14: North America Market Volume (Units) Forecast by Type, 2019 to 2034

Table 15: North America Market Value (US$ Million) Forecast by Distribution Channel, 2019 to 2034

Table 16: North America Market Volume (Units) Forecast by Distribution Channel, 2019 to 2034

Table 17: Latin America Market Value (US$ Million) Forecast by Country, 2019 to 2034

Table 18: Latin America Market Volume (Units) Forecast by Country, 2019 to 2034

Table 19: Latin America Market Value (US$ Million) Forecast by Product, 2019 to 2034

Table 20: Latin America Market Volume (Units) Forecast by Product, 2019 to 2034

Table 21: Latin America Market Value (US$ Million) Forecast by Type, 2019 to 2034

Table 22: Latin America Market Volume (Units) Forecast by Type, 2019 to 2034

Table 23: Latin America Market Value (US$ Million) Forecast by Distribution Channel, 2019 to 2034

Table 24: Latin America Market Volume (Units) Forecast by Distribution Channel, 2019 to 2034

Table 25: Western Europe Market Value (US$ Million) Forecast by Country, 2019 to 2034

Table 26: Western Europe Market Volume (Units) Forecast by Country, 2019 to 2034

Table 27: Western Europe Market Value (US$ Million) Forecast by Product, 2019 to 2034

Table 28: Western Europe Market Volume (Units) Forecast by Product, 2019 to 2034

Table 29: Western Europe Market Value (US$ Million) Forecast by Type, 2019 to 2034

Table 30: Western Europe Market Volume (Units) Forecast by Type, 2019 to 2034

Table 31: Western Europe Market Value (US$ Million) Forecast by Distribution Channel, 2019 to 2034

Table 32: Western Europe Market Volume (Units) Forecast by Distribution Channel, 2019 to 2034

Table 33: Eastern Europe Market Value (US$ Million) Forecast by Country, 2019 to 2034

Table 34: Eastern Europe Market Volume (Units) Forecast by Country, 2019 to 2034

Table 35: Eastern Europe Market Value (US$ Million) Forecast by Product, 2019 to 2034

Table 36: Eastern Europe Market Volume (Units) Forecast by Product, 2019 to 2034

Table 37: Eastern Europe Market Value (US$ Million) Forecast by Type, 2019 to 2034

Table 38: Eastern Europe Market Volume (Units) Forecast by Type, 2019 to 2034

Table 39: Eastern Europe Market Value (US$ Million) Forecast by Distribution Channel, 2019 to 2034

Table 40: Eastern Europe Market Volume (Units) Forecast by Distribution Channel, 2019 to 2034

Table 41: South Asia and Pacific Market Value (US$ Million) Forecast by Country, 2019 to 2034

Table 42: South Asia and Pacific Market Volume (Units) Forecast by Country, 2019 to 2034

Table 43: South Asia and Pacific Market Value (US$ Million) Forecast by Product, 2019 to 2034

Table 44: South Asia and Pacific Market Volume (Units) Forecast by Product, 2019 to 2034

Table 45: South Asia and Pacific Market Value (US$ Million) Forecast by Type, 2019 to 2034

Table 46: South Asia and Pacific Market Volume (Units) Forecast by Type, 2019 to 2034

Table 47: South Asia and Pacific Market Value (US$ Million) Forecast by Distribution Channel, 2019 to 2034

Table 48: South Asia and Pacific Market Volume (Units) Forecast by Distribution Channel, 2019 to 2034

Table 49: East Asia Market Value (US$ Million) Forecast by Country, 2019 to 2034

Table 50: East Asia Market Volume (Units) Forecast by Country, 2019 to 2034

Table 51: East Asia Market Value (US$ Million) Forecast by Product, 2019 to 2034

Table 52: East Asia Market Volume (Units) Forecast by Product, 2019 to 2034

Table 53: East Asia Market Value (US$ Million) Forecast by Type, 2019 to 2034

Table 54: East Asia Market Volume (Units) Forecast by Type, 2019 to 2034

Table 55: East Asia Market Value (US$ Million) Forecast by Distribution Channel, 2019 to 2034

Table 56: East Asia Market Volume (Units) Forecast by Distribution Channel, 2019 to 2034

Table 57: Middle East and Africa Market Value (US$ Million) Forecast by Country, 2019 to 2034

Table 58: Middle East and Africa Market Volume (Units) Forecast by Country, 2019 to 2034

Table 59: Middle East and Africa Market Value (US$ Million) Forecast by Product, 2019 to 2034

Table 60: Middle East and Africa Market Volume (Units) Forecast by Product, 2019 to 2034

Table 61: Middle East and Africa Market Value (US$ Million) Forecast by Type, 2019 to 2034

Table 62: Middle East and Africa Market Volume (Units) Forecast by Type, 2019 to 2034

Table 63: Middle East and Africa Market Value (US$ Million) Forecast by Distribution Channel, 2019 to 2034

Table 64: Middle East and Africa Market Volume (Units) Forecast by Distribution Channel, 2019 to 2034

List of Charts

Figure 1: Global Market Value (US$ Million) by Product, 2024 to 2034

Figure 2: Global Market Value (US$ Million) by Type, 2024 to 2034

Figure 3: Global Market Value (US$ Million) by Distribution Channel, 2024 to 2034

Figure 4: Global Market Value (US$ Million) by Region, 2024 to 2034

Figure 5: Global Market Value (US$ Million) Analysis by Region, 2019 to 2034

Figure 6: Global Market Volume (Units) Analysis by Region, 2019 to 2034

Figure 7: Global Market Value Share (%) and BPS Analysis by Region, 2024 to 2034

Figure 8: Global Market Y-o-Y Growth (%) Projections by Region, 2024 to 2034

Figure 9: Global Market Value (US$ Million) Analysis by Product, 2019 to 2034

Figure 10: Global Market Volume (Units) Analysis by Product, 2019 to 2034

Figure 11: Global Market Value Share (%) and BPS Analysis by Product, 2024 to 2034

Figure 12: Global Market Y-o-Y Growth (%) Projections by Product, 2024 to 2034

Figure 13: Global Market Value (US$ Million) Analysis by Type, 2019 to 2034

Figure 14: Global Market Volume (Units) Analysis by Type, 2019 to 2034

Figure 15: Global Market Value Share (%) and BPS Analysis by Type, 2024 to 2034

Figure 16: Global Market Y-o-Y Growth (%) Projections by Type, 2024 to 2034

Figure 17: Global Market Value (US$ Million) Analysis by Distribution Channel, 2019 to 2034

Figure 18: Global Market Volume (Units) Analysis by Distribution Channel, 2019 to 2034

Figure 19: Global Market Value Share (%) and BPS Analysis by Distribution Channel, 2024 to 2034

Figure 20: Global Market Y-o-Y Growth (%) Projections by Distribution Channel, 2024 to 2034

Figure 21: Global Market Attractiveness by Product, 2024 to 2034

Figure 22: Global Market Attractiveness by Type, 2024 to 2034

Figure 23: Global Market Attractiveness by Distribution Channel, 2024 to 2034

Figure 24: Global Market Attractiveness by Region, 2024 to 2034

Figure 25: North America Market Value (US$ Million) by Product, 2024 to 2034

Figure 26: North America Market Value (US$ Million) by Type, 2024 to 2034

Figure 27: North America Market Value (US$ Million) by Distribution Channel, 2024 to 2034

Figure 28: North America Market Value (US$ Million) by Country, 2024 to 2034

Figure 29: North America Market Value (US$ Million) Analysis by Country, 2019 to 2034

Figure 30: North America Market Volume (Units) Analysis by Country, 2019 to 2034

Figure 31: North America Market Value Share (%) and BPS Analysis by Country, 2024 to 2034

Figure 32: North America Market Y-o-Y Growth (%) Projections by Country, 2024 to 2034

Figure 33: North America Market Value (US$ Million) Analysis by Product, 2019 to 2034

Figure 34: North America Market Volume (Units) Analysis by Product, 2019 to 2034

Figure 35: North America Market Value Share (%) and BPS Analysis by Product, 2024 to 2034

Figure 36: North America Market Y-o-Y Growth (%) Projections by Product, 2024 to 2034

Figure 37: North America Market Value (US$ Million) Analysis by Type, 2019 to 2034

Figure 38: North America Market Volume (Units) Analysis by Type, 2019 to 2034

Figure 39: North America Market Value Share (%) and BPS Analysis by Type, 2024 to 2034

Figure 40: North America Market Y-o-Y Growth (%) Projections by Type, 2024 to 2034

Figure 41: North America Market Value (US$ Million) Analysis by Distribution Channel, 2019 to 2034

Figure 42: North America Market Volume (Units) Analysis by Distribution Channel, 2019 to 2034

Figure 43: North America Market Value Share (%) and BPS Analysis by Distribution Channel, 2024 to 2034

Figure 44: North America Market Y-o-Y Growth (%) Projections by Distribution Channel, 2024 to 2034

Figure 45: North America Market Attractiveness by Product, 2024 to 2034

Figure 46: North America Market Attractiveness by Type, 2024 to 2034

Figure 47: North America Market Attractiveness by Distribution Channel, 2024 to 2034

Figure 48: North America Market Attractiveness by Country, 2024 to 2034

Figure 49: Latin America Market Value (US$ Million) by Product, 2024 to 2034

Figure 50: Latin America Market Value (US$ Million) by Type, 2024 to 2034

Figure 51: Latin America Market Value (US$ Million) by Distribution Channel, 2024 to 2034

Figure 52: Latin America Market Value (US$ Million) by Country, 2024 to 2034

Figure 53: Latin America Market Value (US$ Million) Analysis by Country, 2019 to 2034

Figure 54: Latin America Market Volume (Units) Analysis by Country, 2019 to 2034

Figure 55: Latin America Market Value Share (%) and BPS Analysis by Country, 2024 to 2034

Figure 56: Latin America Market Y-o-Y Growth (%) Projections by Country, 2024 to 2034

Figure 57: Latin America Market Value (US$ Million) Analysis by Product, 2019 to 2034

Figure 58: Latin America Market Volume (Units) Analysis by Product, 2019 to 2034

Figure 59: Latin America Market Value Share (%) and BPS Analysis by Product, 2024 to 2034

Figure 60: Latin America Market Y-o-Y Growth (%) Projections by Product, 2024 to 2034

Figure 61: Latin America Market Value (US$ Million) Analysis by Type, 2019 to 2034

Figure 62: Latin America Market Volume (Units) Analysis by Type, 2019 to 2034

Figure 63: Latin America Market Value Share (%) and BPS Analysis by Type, 2024 to 2034

Figure 64: Latin America Market Y-o-Y Growth (%) Projections by Type, 2024 to 2034

Figure 65: Latin America Market Value (US$ Million) Analysis by Distribution Channel, 2019 to 2034

Figure 66: Latin America Market Volume (Units) Analysis by Distribution Channel, 2019 to 2034

Figure 67: Latin America Market Value Share (%) and BPS Analysis by Distribution Channel, 2024 to 2034

Figure 68: Latin America Market Y-o-Y Growth (%) Projections by Distribution Channel, 2024 to 2034

Figure 69: Latin America Market Attractiveness by Product, 2024 to 2034

Figure 70: Latin America Market Attractiveness by Type, 2024 to 2034

Figure 71: Latin America Market Attractiveness by Distribution Channel, 2024 to 2034

Figure 72: Latin America Market Attractiveness by Country, 2024 to 2034

Figure 73: Western Europe Market Value (US$ Million) by Product, 2024 to 2034

Figure 74: Western Europe Market Value (US$ Million) by Type, 2024 to 2034

Figure 75: Western Europe Market Value (US$ Million) by Distribution Channel, 2024 to 2034

Figure 76: Western Europe Market Value (US$ Million) by Country, 2024 to 2034

Figure 77: Western Europe Market Value (US$ Million) Analysis by Country, 2019 to 2034

Figure 78: Western Europe Market Volume (Units) Analysis by Country, 2019 to 2034

Figure 79: Western Europe Market Value Share (%) and BPS Analysis by Country, 2024 to 2034

Figure 80: Western Europe Market Y-o-Y Growth (%) Projections by Country, 2024 to 2034

Figure 81: Western Europe Market Value (US$ Million) Analysis by Product, 2019 to 2034

Figure 82: Western Europe Market Volume (Units) Analysis by Product, 2019 to 2034

Figure 83: Western Europe Market Value Share (%) and BPS Analysis by Product, 2024 to 2034

Figure 84: Western Europe Market Y-o-Y Growth (%) Projections by Product, 2024 to 2034

Figure 85: Western Europe Market Value (US$ Million) Analysis by Type, 2019 to 2034

Figure 86: Western Europe Market Volume (Units) Analysis by Type, 2019 to 2034

Figure 87: Western Europe Market Value Share (%) and BPS Analysis by Type, 2024 to 2034

Figure 88: Western Europe Market Y-o-Y Growth (%) Projections by Type, 2024 to 2034

Figure 89: Western Europe Market Value (US$ Million) Analysis by Distribution Channel, 2019 to 2034

Figure 90: Western Europe Market Volume (Units) Analysis by Distribution Channel, 2019 to 2034

Figure 91: Western Europe Market Value Share (%) and BPS Analysis by Distribution Channel, 2024 to 2034

Figure 92: Western Europe Market Y-o-Y Growth (%) Projections by Distribution Channel, 2024 to 2034

Figure 93: Western Europe Market Attractiveness by Product, 2024 to 2034

Figure 94: Western Europe Market Attractiveness by Type, 2024 to 2034

Figure 95: Western Europe Market Attractiveness by Distribution Channel, 2024 to 2034

Figure 96: Western Europe Market Attractiveness by Country, 2024 to 2034

Figure 97: Eastern Europe Market Value (US$ Million) by Product, 2024 to 2034

Figure 98: Eastern Europe Market Value (US$ Million) by Type, 2024 to 2034

Figure 99: Eastern Europe Market Value (US$ Million) by Distribution Channel, 2024 to 2034

Figure 100: Eastern Europe Market Value (US$ Million) by Country, 2024 to 2034

Figure 101: Eastern Europe Market Value (US$ Million) Analysis by Country, 2019 to 2034

Figure 102: Eastern Europe Market Volume (Units) Analysis by Country, 2019 to 2034

Figure 103: Eastern Europe Market Value Share (%) and BPS Analysis by Country, 2024 to 2034

Figure 104: Eastern Europe Market Y-o-Y Growth (%) Projections by Country, 2024 to 2034

Figure 105: Eastern Europe Market Value (US$ Million) Analysis by Product, 2019 to 2034

Figure 106: Eastern Europe Market Volume (Units) Analysis by Product, 2019 to 2034

Figure 107: Eastern Europe Market Value Share (%) and BPS Analysis by Product, 2024 to 2034

Figure 108: Eastern Europe Market Y-o-Y Growth (%) Projections by Product, 2024 to 2034

Figure 109: Eastern Europe Market Value (US$ Million) Analysis by Type, 2019 to 2034

Figure 110: Eastern Europe Market Volume (Units) Analysis by Type, 2019 to 2034

Figure 111: Eastern Europe Market Value Share (%) and BPS Analysis by Type, 2024 to 2034

Figure 112: Eastern Europe Market Y-o-Y Growth (%) Projections by Type, 2024 to 2034

Figure 113: Eastern Europe Market Value (US$ Million) Analysis by Distribution Channel, 2019 to 2034

Figure 114: Eastern Europe Market Volume (Units) Analysis by Distribution Channel, 2019 to 2034

Figure 115: Eastern Europe Market Value Share (%) and BPS Analysis by Distribution Channel, 2024 to 2034

Figure 116: Eastern Europe Market Y-o-Y Growth (%) Projections by Distribution Channel, 2024 to 2034

Figure 117: Eastern Europe Market Attractiveness by Product, 2024 to 2034

Figure 118: Eastern Europe Market Attractiveness by Type, 2024 to 2034

Figure 119: Eastern Europe Market Attractiveness by Distribution Channel, 2024 to 2034

Figure 120: Eastern Europe Market Attractiveness by Country, 2024 to 2034

Figure 121: South Asia and Pacific Market Value (US$ Million) by Product, 2024 to 2034

Figure 122: South Asia and Pacific Market Value (US$ Million) by Type, 2024 to 2034

Figure 123: South Asia and Pacific Market Value (US$ Million) by Distribution Channel, 2024 to 2034

Figure 124: South Asia and Pacific Market Value (US$ Million) by Country, 2024 to 2034

Figure 125: South Asia and Pacific Market Value (US$ Million) Analysis by Country, 2019 to 2034

Figure 126: South Asia and Pacific Market Volume (Units) Analysis by Country, 2019 to 2034

Figure 127: South Asia and Pacific Market Value Share (%) and BPS Analysis by Country, 2024 to 2034

Figure 128: South Asia and Pacific Market Y-o-Y Growth (%) Projections by Country, 2024 to 2034

Figure 129: South Asia and Pacific Market Value (US$ Million) Analysis by Product, 2019 to 2034

Figure 130: South Asia and Pacific Market Volume (Units) Analysis by Product, 2019 to 2034

Figure 131: South Asia and Pacific Market Value Share (%) and BPS Analysis by Product, 2024 to 2034

Figure 132: South Asia and Pacific Market Y-o-Y Growth (%) Projections by Product, 2024 to 2034

Figure 133: South Asia and Pacific Market Value (US$ Million) Analysis by Type, 2019 to 2034

Figure 134: South Asia and Pacific Market Volume (Units) Analysis by Type, 2019 to 2034

Figure 135: South Asia and Pacific Market Value Share (%) and BPS Analysis by Type, 2024 to 2034

Figure 136: South Asia and Pacific Market Y-o-Y Growth (%) Projections by Type, 2024 to 2034

Figure 137: South Asia and Pacific Market Value (US$ Million) Analysis by Distribution Channel, 2019 to 2034

Figure 138: South Asia and Pacific Market Volume (Units) Analysis by Distribution Channel, 2019 to 2034

Figure 139: South Asia and Pacific Market Value Share (%) and BPS Analysis by Distribution Channel, 2024 to 2034

Figure 140: South Asia and Pacific Market Y-o-Y Growth (%) Projections by Distribution Channel, 2024 to 2034

Figure 141: South Asia and Pacific Market Attractiveness by Product, 2024 to 2034

Figure 142: South Asia and Pacific Market Attractiveness by Type, 2024 to 2034

Figure 143: South Asia and Pacific Market Attractiveness by Distribution Channel, 2024 to 2034

Figure 144: South Asia and Pacific Market Attractiveness by Country, 2024 to 2034

Figure 145: East Asia Market Value (US$ Million) by Product, 2024 to 2034

Figure 146: East Asia Market Value (US$ Million) by Type, 2024 to 2034

Figure 147: East Asia Market Value (US$ Million) by Distribution Channel, 2024 to 2034

Figure 148: East Asia Market Value (US$ Million) by Country, 2024 to 2034

Figure 149: East Asia Market Value (US$ Million) Analysis by Country, 2019 to 2034

Figure 150: East Asia Market Volume (Units) Analysis by Country, 2019 to 2034

Figure 151: East Asia Market Value Share (%) and BPS Analysis by Country, 2024 to 2034

Figure 152: East Asia Market Y-o-Y Growth (%) Projections by Country, 2024 to 2034

Figure 153: East Asia Market Value (US$ Million) Analysis by Product, 2019 to 2034

Figure 154: East Asia Market Volume (Units) Analysis by Product, 2019 to 2034

Figure 155: East Asia Market Value Share (%) and BPS Analysis by Product, 2024 to 2034

Figure 156: East Asia Market Y-o-Y Growth (%) Projections by Product, 2024 to 2034

Figure 157: East Asia Market Value (US$ Million) Analysis by Type, 2019 to 2034

Figure 158: East Asia Market Volume (Units) Analysis by Type, 2019 to 2034

Figure 159: East Asia Market Value Share (%) and BPS Analysis by Type, 2024 to 2034

Figure 160: East Asia Market Y-o-Y Growth (%) Projections by Type, 2024 to 2034

Figure 161: East Asia Market Value (US$ Million) Analysis by Distribution Channel, 2019 to 2034

Figure 162: East Asia Market Volume (Units) Analysis by Distribution Channel, 2019 to 2034

Figure 163: East Asia Market Value Share (%) and BPS Analysis by Distribution Channel, 2024 to 2034

Figure 164: East Asia Market Y-o-Y Growth (%) Projections by Distribution Channel, 2024 to 2034

Figure 165: East Asia Market Attractiveness by Product, 2024 to 2034

Figure 166: East Asia Market Attractiveness by Type, 2024 to 2034

Figure 167: East Asia Market Attractiveness by Distribution Channel, 2024 to 2034

Figure 168: East Asia Market Attractiveness by Country, 2024 to 2034

Figure 169: Middle East and Africa Market Value (US$ Million) by Product, 2024 to 2034

Figure 170: Middle East and Africa Market Value (US$ Million) by Type, 2024 to 2034

Figure 171: Middle East and Africa Market Value (US$ Million) by Distribution Channel, 2024 to 2034

Figure 172: Middle East and Africa Market Value (US$ Million) by Country, 2024 to 2034

Figure 173: Middle East and Africa Market Value (US$ Million) Analysis by Country, 2019 to 2034

Figure 174: Middle East and Africa Market Volume (Units) Analysis by Country, 2019 to 2034

Figure 175: Middle East and Africa Market Value Share (%) and BPS Analysis by Country, 2024 to 2034

Figure 176: Middle East and Africa Market Y-o-Y Growth (%) Projections by Country, 2024 to 2034

Figure 177: Middle East and Africa Market Value (US$ Million) Analysis by Product, 2019 to 2034

Figure 178: Middle East and Africa Market Volume (Units) Analysis by Product, 2019 to 2034

Figure 179: Middle East and Africa Market Value Share (%) and BPS Analysis by Product, 2024 to 2034

Figure 180: Middle East and Africa Market Y-o-Y Growth (%) Projections by Product, 2024 to 2034

Figure 181: Middle East and Africa Market Value (US$ Million) Analysis by Type, 2019 to 2034

Figure 182: Middle East and Africa Market Volume (Units) Analysis by Type, 2019 to 2034

Figure 183: Middle East and Africa Market Value Share (%) and BPS Analysis by Type, 2024 to 2034

Figure 184: Middle East and Africa Market Y-o-Y Growth (%) Projections by Type, 2024 to 2034

Figure 185: Middle East and Africa Market Value (US$ Million) Analysis by Distribution Channel, 2019 to 2034

Figure 186: Middle East and Africa Market Volume (Units) Analysis by Distribution Channel, 2019 to 2034

Figure 187: Middle East and Africa Market Value Share (%) and BPS Analysis by Distribution Channel, 2024 to 2034

Figure 188: Middle East and Africa Market Y-o-Y Growth (%) Projections by Distribution Channel, 2024 to 2034

Figure 189: Middle East and Africa Market Attractiveness by Product, 2024 to 2034

Figure 190: Middle East and Africa Market Attractiveness by Type, 2024 to 2034

Figure 191: Middle East and Africa Market Attractiveness by Distribution Channel, 2024 to 2034

Figure 192: Middle East and Africa Market Attractiveness by Country, 2024 to 2034

Recommendations

Healthcare

Anti-hangover Supplement Market

Published : November 2023

Food and Beverage

Digestive Health Supplements Market

Published : June 2023

Explore Consumer Product Insights

View Reports

Hangover Cure Product Market