The global procurement software market is poised to grow from USD 7.9 billion in 2025 to USD 21.9 billion by 2035, expanding at a CAGR of 9.7%. This growth reflects the increasing importance of digital procurement solutions in driving operational efficiency, compliance, and agility across enterprises.
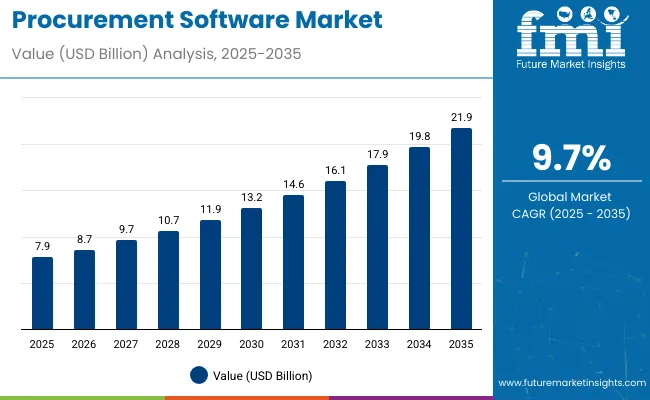
In 2024, the market experienced strong momentum, with adoption driven by the need to automate sourcing, streamline vendor management, and reduce procurement cycle times. Businesses facing macroeconomic pressures began prioritizing spend visibility and risk mitigation, which procurement platforms now support through embedded analytics and AI-driven insights.
By 2025, a notable uptick is expected from mid-sized enterprises upgrading from spreadsheets or legacy tools to cloud-based procurement systems. The integration of AI for contract intelligence, spend forecasting, and supplier risk scoring is transforming procurement from a cost center into a strategic enabler.
One of the most impactful developments occurred in May 2025, when Amazon Web Services (AWS) announced the launch of its AWS Marketplace in India. This initiative is expected to revolutionize enterprise software procurement in one of the world’s fastest-growing economies. According to Sandeep Dutta, President of AWS India and South Asia, the move is a “UPI moment for enterprise software procurement,” indicating a major shift in how Indian businesses discover, purchase, and deploy solutions. The platform will allow Indian buyers to transact in local currency using familiar methods such as UPI, net banking, and credit cards, making enterprise procurement more accessible.
This development complements the industry-wide trend toward localizing procurement software offerings to meet regional compliance requirements and payment preferences. Leading vendors are also embedding ESG metrics and supplier diversity tracking into their platforms to align with evolving regulatory standards and corporate sustainability goals.
As procurement platforms become more intelligent and configurable, companies are reducing reliance on fragmented third-party tools. Centralized software suites now encompass everything from e-sourcing and supplier onboarding to contract lifecycle management and automated purchasing.
The industry outlook is further shaped by CXO vision. Workday’s 2025 product leadership emphasized that procurement teams are no longer focused solely on cost savings. Instead, they are becoming “strategic enablers of resilience and sustainability,” requiring tools that provide flexibility, regulatory alignment, and actionable insights.
Going forward, partnerships, region-specific feature rollouts, and the growing role of procurement in ESG compliance are expected to sustain high growth. Vendors that offer modular, cloud-native platforms with strong AI capabilities will be best positioned to lead this transformation.
Governments and standards bodies in 2025 advanced the digital foundations of procurement, with a notable emphasis on AI, interoperability, and sustainability. The UK issued formal guidelines for AI procurement, offering public-sector buyers a structured framework for evaluating and deploying AI-enabled tools. India’s Government e-Marketplace pushed forward with large-scale cloud modernization and initiated plans for AI and language technology integration, signaling a pivot toward cloud-native, AI-assisted procurement operations at national scale. Similarly, Australia’s BuyICT portal streamlined onboarding and digital procurement processes, reinforcing the trend toward agile, marketplace-driven public sourcing.
Core technical infrastructure for e-procurement also matured. OpenPeppol delivered specification updates covering e-ordering and e-invoicing rails that many software suites integrate with, while the EU’s TED platform expanded work on eForms and the eProcurement Ontology to ensure structured, machine-readable tender data. The Open Contracting for Infrastructure Data Standard was refined with new fields to capture authority-level data across project lifecycles, improving how tools track public infrastructure sourcing. At the global level, UNECE advanced the concept of “Regional Single Windows,” encouraging modular digital architectures that facilitate cross-border procurement and document exchange.
Policy momentum reinforced the shift toward data-driven and sustainable procurement. In the United States, new directives pushed agencies toward API-first, standardized data practices that enable more powerful dashboards and oversight capabilities. The OECD’s 2025 Government at a Glance underscored the growing role of green public procurement, emphasizing metrics and tooling that embed ESG priorities into procurement workflows. Together, these initiatives reflect how regulators and institutions are steering the market toward greater transparency, automation, and alignment with policy goals.
Collectively, the 2025 updates are accelerating procurement software from back-office utility into strategic digital infrastructure. With AI frameworks, open standards, and sustainability scorecards becoming embedded in regulatory guidance, vendors are under mounting pressure to ensure their solutions not only handle transactions but also deliver resilience, compliance, and policy-aligned outcomes.
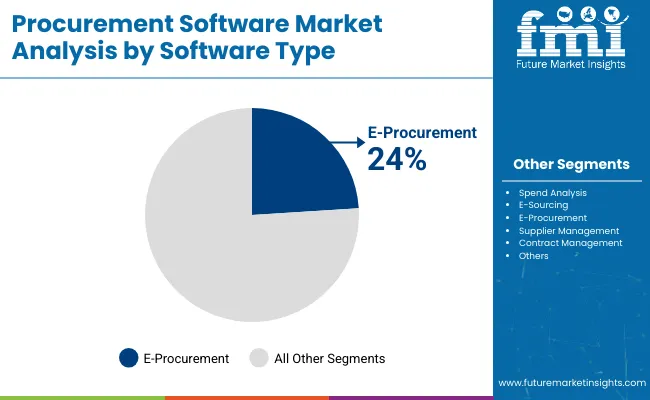
E-Procurement solutions account for 24% share in 2025 of the overall procurement software market, highlighting their growing role as enterprises move away from paper-based and manual processes.
This segment’s strength lies in automating requisition-to-order cycles, ensuring compliance with procurement policies, and reducing maverick spending. The increasing integration of e-procurement modules with supplier portals and spend analytics tools is further driving adoption, particularly among mid-to-large enterprises seeking tighter financial control.
While the segment currently trails broader categories such as spend analysis and contract management, its steady growth trajectory positions e-procurement as a cornerstone of digital procurement transformation, especially in industries prioritizing operational efficiency and compliance.
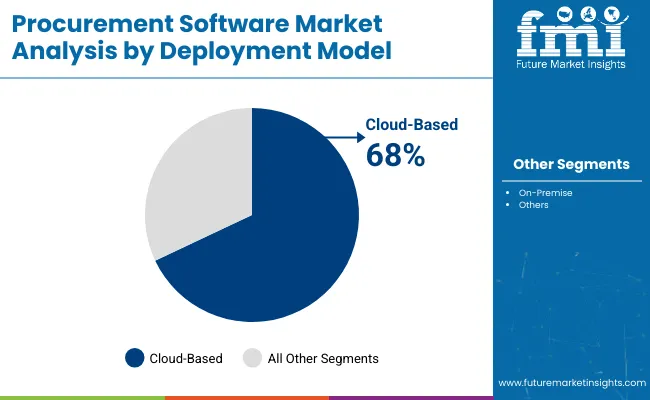
Cloud-based procurement software dominates with a 68% share in 2025, underscoring the rapid shift from traditional on-premise systems toward SaaS-based solutions.
Organizations are increasingly attracted to the cloud for its scalability, lower upfront investment, faster implementation, and ability to integrate emerging technologies such as AI-driven analytics, predictive supplier scoring, and blockchain-enabled contract management. This strong preference for cloud deployment also reflects broader enterprise IT strategies that prioritize flexibility, remote accessibility, and reduced maintenance overheads.
With procurement teams under pressure to deliver more value while operating lean, cloud-based models are expected to remain the backbone of future procurement ecosystems, consolidating their leadership position over the next decade.
The industry is rapidly evolving due to digital transformation, cloud computing, and AI-enabled automation. Retail & e-commerce emphasizes procurement software in terms of enhancing supply chain responsiveness and providing real-time tracking of inventory.
ERP integration, material supply source streamlining, and supplier management are at the top of the agendas for manufacturing companies. Compliance-oriented procurement for adhering to standards on pharmaceuticals and medical equipment is a top priority of the healthcare sector.
BFSI companies need safe and transparent procurement processes with anti-fraud protection and compliance with financial regulations. IT & telecommunication sectors need cloud-based procurement systems that handle global supplier networks and software license management effectively.
The major trends are AI-powered predictive analytics, blockchain-backed smart contracts, robotic process automation (RPA), and procurement with a sustainability focus. These technologies enable firms to streamline procurement costs, increase collaboration with suppliers, and optimize operational efficiency.
| Company | Contract/Development Details |
|---|---|
| Jaggaer | Partnered with a top-tier university to deploy its procurement software, aiming to modernize the institution's purchasing processes and improve supplier management. |
| GEP | Secured a contract with a major energy company to provide procurement software solutions, focusing on enhancing sourcing strategies and reducing procurement cycle times. |
| Ivalua | Engaged by a financial services firm to implement its procurement platform, aiming to increase spend visibility and enforce compliance across all purchasing activities. |
The industry is at risk for several things that might hinder adoption and efficiency in operations. One of the significant risks is data security and cyber threats because procurement software is used for supplier contracts, pricing, and highly sensitive financial transactions. A hacker attack could cause data leaks, counterfeiting, and damage to the reputation of the company.
Integration challenges are yet another risk since firms often spend significant time and resources trying to marry the procurement software with the existing ERP and accounting systems. The result of poor integration can be eligibility mismatches, hacks, and falling behind the times in the case of the employees who have relied on the old ways of working.
Lack of regulatory compliance is also a risk, given that the procurement process must adhere to tax laws, trade regulations, and supplier transparency guidelines. Failure to meet the standard could lead to finding themselves on the wrong side of the law, incurring financial losses, and experiencing disruptions in their operational activities, especially in those firms that are in multi-national setups.
Another weaker section is vendor independence, where the companies depend on third parties for software upgrades, maintenance, and cloud hosting. This could bring about operational inefficiencies coupled with downtime to the organizations in a case where the vendors are either financially unstable or unwilling to provide the required services.
Competition and cost issues also cause risks, with businesses holding back on software procurement due to excessive costs at the outset or unclear ROI. Outweighing these risks through effective cybersecurity measures, adaptable integration, and compliance-led automation must be the core of the continued growth.
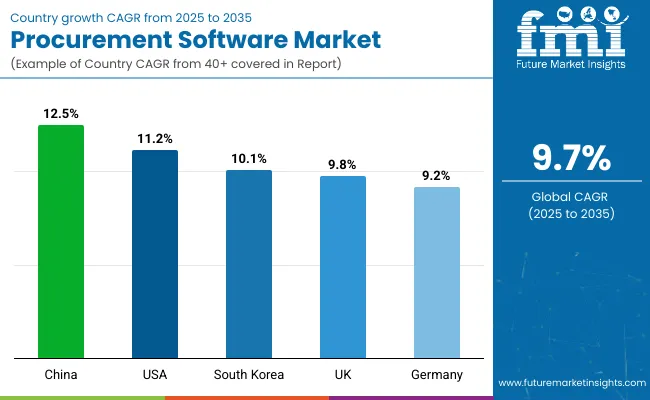
The industry is likely to record a CAGR of 11.2% in the period 2025 to 2035. High investments in cloud-based procurement software and the rapid digitalization of industries are fueling growth. Large companies are implementing artificial intelligence and machine learning to enhance supply chain effectiveness, reduce costs, and enhance supplier relationship management. Government policies encouraging transparency in procurement also drive the adoption of software, particularly in the public sector and healthcare industries.
Mid-sized businesses are also embracing automation to automate procurement processes, with increasing demand for scalable solutions. Greater use of e-procurement marketplaces and integration with financial systems enhances procurement efficiency.
Strategic collaborations between software vendors and large organizations are also driving market growth. With sustainability emerging as a key area, organizations are embracing procurement solutions that take environmental and ethical considerations into account in their sourcing.
The industry is projected to grow with a CAGR of 9.8% during the forecast period. Digital transformation of procurement and cloud-based technology are on the rise and are driving growth in the market. Organizations are investing more in procurement analytics and supplier management software to enhance efficiency. Digital public procurement by the government also allows the deployment of advanced procurement platforms in the public sector.
Furthermore, the post-Brexit trade environment has also motivated businesses to adopt agile procurement practices to offset supply risks. Artificial intelligence and robotic process automation in procurement functions enable organizations to automate their operations. The growing emphasis on ESG (Environmental, Social, and Governance) compliance is also compelling businesses to adopt procurement solutions for ethical sourcing and supplier diversity.
The industry is likely to develop at a CAGR of 8.5% through 2035. Increased business use of digital procurement platforms is driving market growth. Businesses are seeking to automate negotiations with suppliers, contract handling, and procurement analytics to make procedures more streamlined. In addition, the government transition to digital public procurement is creating new growth prospects for procurement software vendors.
French companies are focusing on risk management in procurement, which is driving the implementation of AI solutions. Cloud procurement software is also gaining widespread acceptance among SMEs, particularly to take advantage of cost management and supplier management. As sustainability is a big issue in procurement processes, companies are implementing solutions that focus on green and ethical procurement.
The industry is predicted to expand at a CAGR of 9.2% over the next ten years. German organizations are investing heavily in digital procurement software in order to automate supply chain processes. The usage of IoT, blockchain, and artificial intelligence in procurement activities is improving efficiency as well as transparency. Large-scale manufacturing facilities are deploying procurement software to optimize supplier relationships and boost cost savings.
SMEs are also turning to cloud-based procurement platforms for scalable and automated procurements. The automotive and industrial sectors, in particular, are pushing the demand for procurement software to create supply chain resilience. Furthermore, Germany's highly regulatory environment is compelling companies to maintain compliance-driven procurement solutions, which they can use to ensure procurement standards and compliance with due diligence by suppliers.
The industry is expected to grow at a 7.9% CAGR between 2025 and 2035. Increasing automation of procurement operations by Italian businesses to reduce costs and improve efficiency is driving market growth. Private and public sector usage of e-procurement solutions is increasing, thereby driving market growth. Businesses are also emphasizing using AI-based procurement software to improve decision-making authority and negotiation with vendors.
Retail and manufacturing businesses are investing heavily in digital procurement platforms to facilitate automated buying operations. Government initiatives encouraging digitalization in procurement are also increasing levels of adoption. With sustainability growing in popularity, Italian businesses are leveraging procurement solutions to handle responsible procurement and compliance with the environment.
The industry is expected to record a CAGR of 10.1% from 2025 to 2035. The country's focus on digitalization and automation in procurement is driving market growth. Large businesses are leveraging AI and big data analytics to enhance supplier performance and optimize procurement strategies. The government's expenditure on smart procurement solutions for public sector businesses is also driving market growth.
Increased focus on cloud-based procurement software among small and medium-sized enterprises is driving growth in the market. The highly advanced high-tech business environment of South Korea facilitates ease in integrating procurement solutions into business infrastructure. Additionally, a growing focus on sustainability in supply chains is encouraging businesses to implement ethical procurement systems to enable them to be consistent with green compliances.
The industry is likely to witness a CAGR of 9% between 2025 and 2035. Increasing numbers of Japanese organizations are opting for digital procurement solutions to reduce costs and improve efficiency. AI and automation use during procurement are becoming increasingly popular, which assists the company in maximizing vendor interaction and reducing procurement cycle time.
The nation's strong manufacturing base is one of the prime drivers for the use of procurement software, primarily in the automotive and electronics industries. Government initiatives towards digital procurement in their procurement process also propel market growth. With Japanese businesses becoming more sustainability-oriented, procurement solutions with ESG compliance and ethical sourcing are becoming more prominent.
The industry is likely to grow at a CAGR of 12.5% over the next decade. The rapid digitalization of supply chains and increasing investments in procurement technology are fueling market expansion. Large enterprises are integrating AI-powered procurement tools to improve efficiency and cost control. The Chinese government's emphasis on digital procurement in public infrastructure projects is also driving adoption.
Small and medium enterprises are shifting to cloud-based procurement systems to enable higher scalability. A greater focus on sustainability and adherence to global trade regulations is pressurizing organizations to implement advanced procurement solutions. In addition to this, China's strong e-commerce platform is also fostering the rise in demand for electronic procurement solutions, facilitating higher collaboration with suppliers and greater efficiency.
The industry is predicted to grow at a CAGR of 8.7% during the period 2025 to 2035. Organizations are implementing digital procurement solutions in an effort to enhance operational efficiency and reduce costs. Cloud-based procurement solutions are highly sought after, particularly with medium-sized enterprises needing to automate sourcing and supplier management.
Government focus on boosting transparency in government procurement is driving market expansion. Companies are also placing greater importance on ESG compliance, and procurement software ensuring ethical procurement is becoming increasingly critical. Greater application of procurement analytics driven by artificial intelligence is assisting firms in making fact-based procurement decisions, thus contributing to market expansion.
The industry is expected to develop at a 7.5% CAGR during the coming decade. Companies are embracing electronic procurement software to improve effectiveness and simplify the management of suppliers. The government sector is relying more on e-procurement tools to increase transparency and lower costs.
Cloud-based procurement solutions are becoming popular among SMEs looking for dynamic and agile solutions. Enhancing the value of sustainability, companies are adopting procurement solutions that guarantee ethical buying and compliance with environmental regulations. Growing demands for AI and automation in all procuring processes are also helping drive the growth.
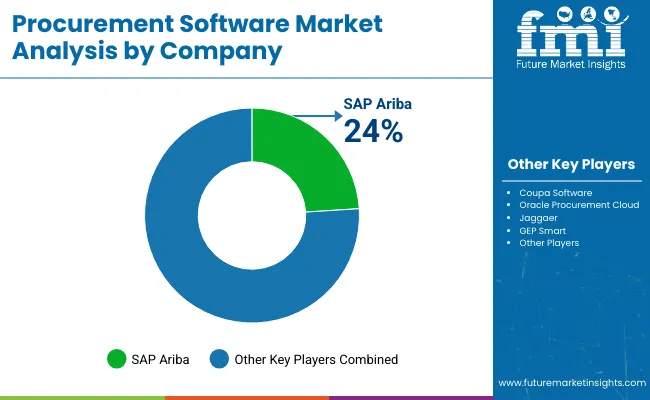
The procurement software market is progressively moving further into an era where businesses will tend towards automating their processes, lowering costs, and reducing risks in procurement. These include AI-enabled analytics, cloud-based platforms for operational data integration, and real-time data importation.
Although cloud solutions have substantially taken over because of their scalability and flexible accessibility, on-premises installations still find their relevance inappropriately managed industries due to regulation and compliance as well as security requirements.
Prominent companies such as SAP Ariba, Coupa Software, Oracle Procurement Cloud, Jaggaer, and GEP Smart make up a market share with comprehensive AI-enabled procurement automation but simple yet direct connections to ERPs.
Amongst them are medium-sized players like Basware, Ivalua, and SynerTrade, which target sector-specific process tools and cost-efficient source solutions. New entrants and niche vendors thus disrupt the market by enabling low-code platforms to manage contracts through AI and transparency through the procurement process blockchain.
The emerging predictive analytics-adoption autonomous procurement bot with segmentation for ESG-driven supplier management will shape the market. Companies are further enriching their platforms through mobile-first procurement, smart contract automatic execution, and embedded financing instrument provisions to respond to changing business needs.
While all these factors define an organization, they also manipulate mergers, acquisitions, and collaboration-scoping strategic opportunities, extending procurement intelligence, supplier collaboration, and overall global reach. Organizations fast-track their digital transformation to gain a competitive edge over their counterparts using highly customized, AI-driven, user-friendly procurement solutions.
In January 2025, Verizon and Honeywell collaborated to bring in an innovative solution that streamlines the retail lifecycle, from procurement to customer operations. The solution combines IoT, AI-powered analytics, and 5G connectivity to boost procurement efficiency, inventory management, and supplier coordination.
In January 2024, Ramp increased its purchasing capabilities through the acquisition of Venue, bolstering its ability to simplify vendor management and purchasing processes. The acquisition enhances Ramp's platform with automated approval, cost control, and contract management capabilities.
| Report Attributes | Details |
|---|---|
| Current Total Market Size (2025) | USD 7.9 billion |
| Projected Market Size (2035) | USD 21.9 billion |
| CAGR (2025 to 2035) | 9.7% |
| Base Year for Estimation | 2024 |
| Historical Period | 2020 to 2024 |
| Projections Period | 2025 to 2035 |
| Quantitative Units | USD billion for value and thousand installations for volume |
| Software Types Analyzed (Segment 1) | Spend Analysis, E-Sourcing, E-Procurement, Supplier Management, Contract Management, Others |
| Deployment Models Analyzed (Segment 2) | Cloud Based, On-Premise |
| End-use Industries Analyzed (Segment 3) | Retail, Automotive, Travel & Logistics, Consumer Electronics, IT & Telecom, Healthcare, BFSI, Government, Others |
| Regions Covered | North America; Latin America; Western Europe; Eastern Europe; South Asia and Pacific; East Asia; Middle East & Africa |
| Countries Covered | United States, Canada, Mexico, Brazil, Argentina, Germany, France, United Kingdom, Italy, Spain, Netherlands, China, India, Japan, South Korea, ANZ, GCC Countries, South Africa |
| Key Players influencing the Procurement Software Market | SAP Ariba, Coupa Software, Oracle Procurement Cloud, Jaggaer, GEP Smart, Ivalua, Basware, Zycus, Proactis, Workday Procurement |
| Additional Attributes | Rise in supplier risk management tools adoption, Cloud transformation in procurement operations, Expansion of contract lifecycle automation tools, Retail and BFSI lead procurement digitalization trends, Integration with ERP and analytics platforms |
| Customization and Pricing | Customization and Pricing Available on Request |
In terms of software type, the segment is divided into Spend Analysis, E-Sourcing, E-Procurement, Supplier Management, Contract Management and Others
In terms of deployment, the industry is segregated into cloud based and on premise.
In terms of end-use industry, the industry is segregated into Retail, Automotive, Travel & Logistics, Consumer Electronics, IT & Telecom, Healthcare, BFSI, Government and Others.
A regional analysis has been carried out in key countries of North America, Latin America, East Asia, South Asia & Pacific, Western Europe, Eastern Europe and Middle East and Africa (MEA), and Europe.
The Global Procurement Software industry is projected to witness CAGR of 9.7% between 2025 and 2035.
The Global Procurement Software industry stood at USD 7.9 billion in 2025.
The Global Procurement Software industry is anticipated to reach USD 21.9 billion by 2035 end.
South Asia & Pacific is set to record the highest CAGR of 11.7% in the assessment period.
The key players operating in the Global Procurement Software Industry SAP Ariba, Coupa Software, Oracle Procurement Cloud, Jaggaer, GEP Smart, Ivalua, Basware, Zycus, Proactis, Workday Procurement.


Full Research Suite comprises of:
Market outlook & trends analysis
Interviews & case studies
Strategic recommendations
Vendor profiles & capabilities analysis
5-year forecasts
8 regions and 60+ country-level data splits
Market segment data splits
12 months of continuous data updates
DELIVERED AS:
PDF EXCEL ONLINE
Procurement Analytics Market Size and Share Forecast Outlook 2025 to 2035
Procurement as a Service Market Trends – Growth & Forecast 2025 to 2035
Retail Sourcing And Procurement Market Size and Share Forecast Outlook 2025 to 2035
Software Defined Vehicle Market Size and Share Forecast Outlook 2025 to 2035
Software Defined Networking (SDN) And Network Function Virtualization (NFV) Market Size and Share Forecast Outlook 2025 to 2035
Software Defined Perimeter (SDP) Market Size and Share Forecast Outlook 2025 to 2035
Software-Defined Wide Area Network SD-WAN Market Size and Share Forecast Outlook 2025 to 2035
Software Defined Radio (SDR) Market Size and Share Forecast Outlook 2025 to 2035
Software License Management (SLM) Market Size and Share Forecast Outlook 2025 to 2035
Software-Defined Networking SDN Market Size and Share Forecast Outlook 2025 to 2035
Software-Defined Anything (SDx) Market Size and Share Forecast Outlook 2025 to 2035
Software-Defined Data Center Market Size and Share Forecast Outlook 2025 to 2035
Software Containers Market Size and Share Forecast Outlook 2025 to 2035
Software Defined Application And Infrastructure Market Size and Share Forecast Outlook 2025 to 2035
Software Defined Networking Market Size and Share Forecast Outlook 2025 to 2035
Software-Defined Camera (SDC) Market Size and Share Forecast Outlook 2025 to 2035
Examining Market Share Trends in the Software Distribution Industry
Software Distribution Market Analysis by Deployment Type, by Organization Size and by Industry Vertical Through 2035
Software-Defined WAN Market - Growth & Forecast through 2034
Software Defined Video Networking Market

Thank you!
You will receive an email from our Business Development Manager. Please be sure to check your SPAM/JUNK folder too.
Chat With
MaRIA