Reports

- Global Locations -

Headquarters

Future Market Insights, Inc.

Christiana Corporate, 200
Continental Drive, Suite 401,
Newark, Delaware - 19713,
United States

T: +1-845-579-5705

Americas

Future Market Insights, Inc.

616 Corporate Way, Suite 2-9018,
Valley Cottage, NY 10989, United States

T: +1-347-918-3531

MEA

Future Market Insights

1602-6 Jumeirah Bay X2 Tower, Plot No: JLT-PH2-X2A,
Jumeirah Lakes Towers, Dubai,
United Arab Emirates

Europe

Future Market Insights

3rd Floor, 207 Regent Street,
W1B 3HH London
United Kingdom

T: + 44 (0) 20 8123 9659
D: +44 (0) 20 3287 4268

Asia Pacific

Future Market Insights

Office No. 401-A, 4th Floor,
VANTAGE 9, S.No. 36/1/1,
Baner, Pune 411045, India

Procure-To-Pay Solutions Market

Procure-To-Pay Solutions Market (2022 to 2032)

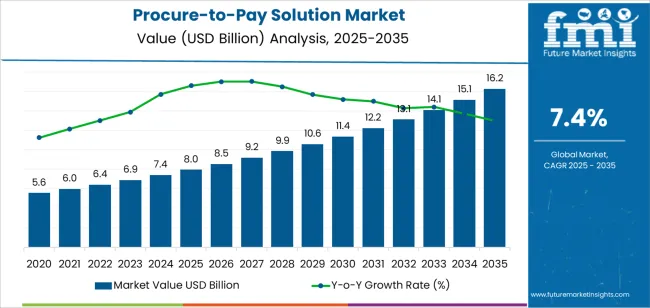
The global procure-to-pay solutions market is forecasted to have a value of US$ 6,832.4 Million in 2022. The market is predicted to increase noticeably over the forecast period, with a CAGR of 7.0%, reaching a value of US$ 13,430.4 Million by 2032.

By establishing a defined framework for managing corporate operations, procure-to-pay solutions benefit enterprises. In order to increase the efficiency and efficacy of their whole business process, businesses are increasingly adopting procure-to-pay systems.

The procure-to-pay solutions market is anticipated to grow, owing to factors like improvements in digital technology and the use of e-invoicing solutions. Moreover, rising SaaS-based P2P suite adoption within organizations, data-driven sourcing, and better spending analysis is setting up new opportunities for the procure-to-pay solutions market. Increased reliance on cloud-based unified solutions for procuring and paying by enterprises is further expected to raise the procure-to-pay solutions market share.

Report Attribute Details
Procure-To-Pay Solutions Market Value (2022) US$ 6,832.4 Million
Procure-To-Pay Solutions Market Anticipated Value (2032) US$ 13,430.4 Million
Procure-To-Pay Solutions Market Projected Growth Rate (2022 to 2032) 7.0%

Due to contract management software's increased popularity and dependability, the market for procure-to-pay solutions is emerging. Improved spend analysis and data-driven sourcing are further having a substantial impact on the procure-to-pay solutions market. However, legislation, regulations, and compliance with contracts present the biggest challenges for suppliers in the procure-to-pay solutions market.

Don't pay for what you don't need

Customize your report by selecting specific countries or regions and save 30%!

How Strategic Planning Affects The Demand for Procure-To-Pay Solutions?

The procure-to-pay solutions market is experiencing considerable expansion. One of the primary determinants of this growth is cloud-based unified procure-to-pay solutions. By providing managed services, procure-to-pay solutions vendors provide expenditure categorization and planning skills to enable better planning and strategic sourcing capabilities.

With the aid of managed services, the procure-to-pay solutions vendors offer planning methodologies and order capabilities for critical planning and sourcing. Digital procurement, quotes requests, supplier finances analysis, and e-signature verification are all parts of digitizing the procurement process.

A number of factors, including information-driven sourcing and smarter spending analysis, are driving the procure-to-pay solutions market share.

What Limits the Procure-To-Pay Solutions Market?

The essential source sparing can help to reduce the overall consumption for the endeavor foundation. The adherence to agreements, rules, and regulations are the elements that impede procure-to-pay solutions market growth and have an impact on key competitors.

Due to this, the overall CAGR upsurge rate is lower, from 6.5% from 2016 to 2021 to 7% from 2032. The associations are implementing e-procurement programming to speed up the procure-to-pay cycle. The results help illustrate how businesses used to get, produce, and market their goods have drastically changed.

Sudip Saha
Sudip Saha

Principal Consultant

Talk to Analyst

Find your sweet spots for generating winning opportunities in this market.

Regional Analysis

Due to the growing adoption of cloud-based procure-to-pay solutions and other tools by small businesses in Asian countries to carry out advanced solutions effectively and quickly.

The procure-to-pay solutions market in South Asia Pacific is anticipated to register the highest growth rate over the forecast period and increase its global procure-to-pay solutions market share.

How North America Is Contributing to the Procure-To-Pay Solutions Market?

North America is anticipated to lead with a market share of 32.2% for procure-to-pay solutions over the forecast period. This is due to the widespread use of procure-to-pay solutions by BFSI industries, the implementation of 5G technology, the prevalence of mobile devices, and the inclination of customers in the region for digital payments.

The most recent development in the market is the digital distribution of goods via this software, increasing demand for procure-to-pay solutions in North America.

What is the Europe Procure-To-Pay Solutions Market Outlook?

Europe is the second leading region in the procure-to-pay solutions market, with a share of 21.7% during the forecast period.

The region's growth is aided by the availability of better resources, budgets, and facilities and technology-driven methods of streamlining manufacturing processes and achieving cost reductions. It is projected that the growing demand for procure-to-pay solutions in small and medium-sized businesses is significantly accelerating market growth in the area.

What Is The Procure-To-Pay Solutions Market Start-up Environment?

Startups are concentrating on offering customers and businesses solutions with digitized budgeting and approval processes, real-time delivery tracking, and combining everything together on a single platform.

Examples of some successful startups

A cloud-based technology provided by US-based firm Negotiatus, which was founded in 2014, enables shippers to manage procurement and associated costs. The technology makes it possible to integrate all of the suppliers and vendors onto a single platform. It makes it possible for businesses to buy things using a cart system.

Buyer Quest is another US-based startup that provides business procurement solutions like eProcurement platforms. It was founded in 2011 and offers three packages of spend management solutions: Marketplace, eProcurement, and Procure-to-Pay.

Get the data you need at a Fraction of the cost

Personalize your report by choosing insights you need
and save 40%!

What is the Competitive Outlook of the Procure-To-Pay Solutions Market?

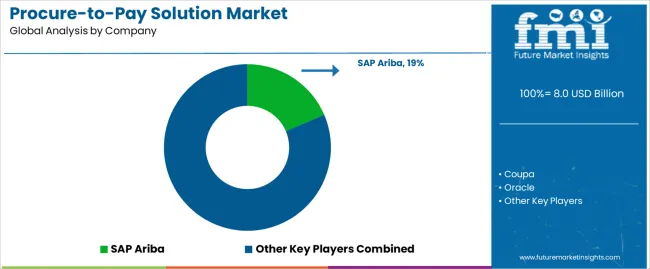
Key players in the procure-to-pay solutions market are focusing on partnerships and introducing technology, innovations, and techniques to improve their business revenue. The procure-to-pay solutions market is growing due to increased interest in contract programming.

2019 saw the introduction of SynOps by Accenture Plc, a global professional services firm. SynOps is a human-machine-operated engine that makes use of data, artificial intelligence, and sophisticated analytics to help organizations carry out smart activities across crucial operations, such as billing and financing, procurement, and advertising.

Key players:

  • SAP SE
  • Zycus Inc
  • Infosys Limited
  • Bertelsmann SE & Co
  • Comarch SA
  • Ariba Inc
  • ProActis
  • GEP

Report Scope

Report Attribute Details
Growth Rate CAGR of 7.0% from 2022 to 2032
Base Year for Estimation 2022
Historical Data 2016 to 2021
Forecast Period 2022 to 2032
Quantitative Units Revenue in US$ Million and CAGR from 2022 to 2032
Report Coverage Revenue Forecast, Volume Forecast, Company Ranking, Competitive Landscape, Growth Factors, Trends, and Pricing Analysis
Segments Covered
  • Deployment
  • End Use Industry
  • Enterprise
  • Region
Regions Covered
  • North America
  • Latin America
  • Western Europe
  • Eastern Europe
  • The Asia Pacific excluding Japan
  • Japan
  • The Middle East and Africa
Key Countries Profiled
  • The USA
  • Canada
  • Brazil
  • Argentina
  • Germany
  • The UK
  • France
  • Spain
  • Italy
  • Nordics
  • BENELUX
  • Australia & New Zealand
  • China
  • India
  • GCC Countries
  • South Africa
Key Companies Profiled
  • SAP SE
  • Zycus Inc
  • Infosys Limited
  • Bertelsmann SE & Co
  • Comarch SA
  • Ariba Inc
  • ProActis
  • GEP
Customization Available Upon Request

Key segments

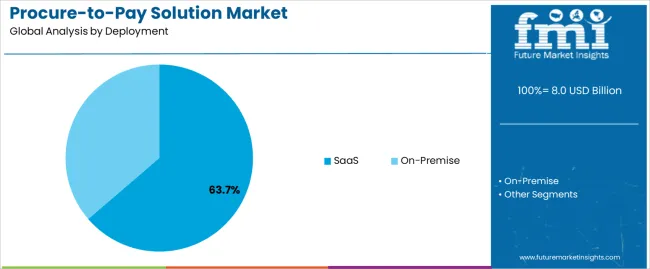
By Deployment:

  • On-Premise
  • SaaS

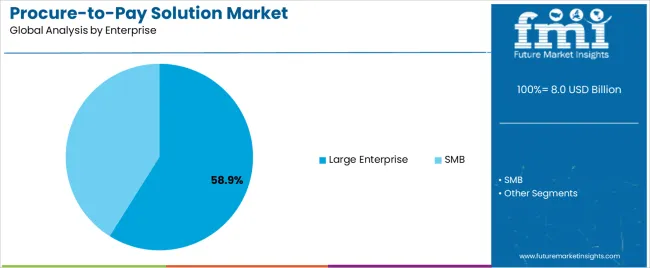
By Enterprise:

  • SMB
  • Large Enterprise

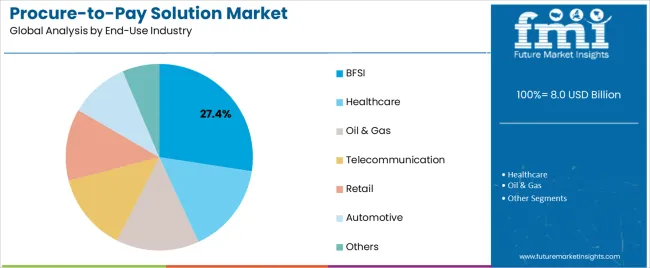
By End-use Industry:

  • BFSI
  • Healthcare
  • Oil & Gas
  • Telecommunication
  • Retail
  • Automotive
  • Others

By Region:

  • North America
  • Latin America
  • Asia Pacific
  • Middle East and Africa (MEA)
  • Europe

Frequently Asked Questions

The procure-to-pay solutions market is projected to have a CAGR of 7.0% through 2032.

North America dominates the procure-to-pay solutions market with a share of 32.2%.

The procure-to-pay solutions market is expected to reach US$ 13,430.4 Million by 2032.

Table of Content

1. Executive Summary | Procure-To-Pay Solutions Market

    1.1. Global Market Outlook

    1.2. Demand-side Trends

    1.3. Supply-side Trends

    1.4. Technology Roadmap Analysis

    1.5. Analysis and Recommendations

2. Market Overview

    2.1. Market Coverage / Taxonomy

    2.2. Market Definition / Scope / Limitations

3. Market Background

    3.1. Market Dynamics

        3.1.1. Drivers

        3.1.2. Restraints

        3.1.3. Opportunity

        3.1.4. Trends

    3.2. Scenario Forecast

        3.2.1. Demand in Optimistic Scenario

        3.2.2. Demand in Likely Scenario

        3.2.3. Demand in Conservative Scenario

    3.3. Opportunity Map Analysis

    3.4. Investment Feasibility Matrix

    3.5. PESTLE and Porter’s Analysis

    3.6. Regulatory Landscape

        3.6.1. By Key Regions

        3.6.2. By Key Countries

    3.7. Regional Parent Market Outlook

4. Global Market Analysis 2017 to 2021 and Forecast, 2022 to 2032

    4.1. Historical Market Size Value (US$ Million) Analysis, 2017 to 2021

    4.2. Current and Future Market Size Value (US$ Million) Projections, 2022 to 2032

        4.2.1. Y-o-Y Growth Trend Analysis

        4.2.2. Absolute Opportunity Analysis

5. Global Market Analysis 2017 to 2021 and Forecast 2022 to 2032, By Deployment

    5.1. Introduction / Key Findings

    5.2. Historical Market Size Value (US$ Million) Analysis By Deployment, 2017 to 2021

    5.3. Current and Future Market Size Value (US$ Million) Analysis and Forecast By Deployment, 2022 to 2032

        5.3.1. On-Premise

        5.3.2. SaaS

    5.4. Y-o-Y Growth Trend Analysis By Deployment, 2017 to 2021

    5.5. Absolute Opportunity Analysis By Deployment, 2022 to 2032

6. Global Market Analysis 2017 to 2021 and Forecast 2022 to 2032, By Enterprise

    6.1. Introduction / Key Findings

    6.2. Historical Market Size Value (US$ Million) Analysis By Enterprise, 2017 to 2021

    6.3. Current and Future Market Size Value (US$ Million) Analysis and Forecast By Enterprise, 2022 to 2032

        6.3.1. SMEs

        6.3.2. Large Enterprises

    6.4. Y-o-Y Growth Trend Analysis By Enterprise, 2017 to 2021

    6.5. Absolute Opportunity Analysis By Enterprise, 2022 to 2032

7. Global Market Analysis 2017 to 2021 and Forecast 2022 to 2032, By End Use Industry

    7.1. Introduction / Key Findings

    7.2. Historical Market Size Value (US$ Million) Analysis By End Use Industry, 2017 to 2021

    7.3. Current and Future Market Size Value (US$ Million) Analysis and Forecast By End Use Industry, 2022 to 2032

        7.3.1. BFSI

        7.3.2. Healthcare

        7.3.3. Oil & Gas

        7.3.4. Telecommunication

        7.3.5. Retail

        7.3.6. Automotive

        7.3.7. Others

    7.4. Y-o-Y Growth Trend Analysis By End Use Industry, 2017 to 2021

    7.5. Absolute Opportunity Analysis By End Use Industry, 2022 to 2032

8. Global Market Analysis 2017 to 2021 and Forecast 2022 to 2032, By Region

    8.1. Introduction

    8.2. Historical Market Size Value (US$ Million) Analysis By Region, 2017 to 2021

    8.3. Current Market Size Value (US$ Million) Analysis and Forecast By Region, 2022 to 2032

        8.3.1. North America

        8.3.2. Latin America

        8.3.3. Europe

        8.3.4. Asia Pacific

        8.3.5. Middle East and Africa

    8.4. Market Attractiveness Analysis By Region

9. North America Market Analysis 2017 to 2021 and Forecast 2022 to 2032, By Country

    9.1. Historical Market Size Value (US$ Million) Trend Analysis By Market Taxonomy, 2017 to 2021

    9.2. Market Size Value (US$ Million) Forecast By Market Taxonomy, 2022 to 2032

        9.2.1. By Country

            9.2.1.1. US

            9.2.1.2. Canada

        9.2.2. By Deployment

        9.2.3. By Enterprise

        9.2.4. By End Use Industry

    9.3. Market Attractiveness Analysis

        9.3.1. By Country

        9.3.2. By Deployment

        9.3.3. By Enterprise

        9.3.4. By End Use Industry

    9.4. Key Takeaways

10. Latin America Market Analysis 2017 to 2021 and Forecast 2022 to 2032, By Country

    10.1. Historical Market Size Value (US$ Million) Trend Analysis By Market Taxonomy, 2017 to 2021

    10.2. Market Size Value (US$ Million) Forecast By Market Taxonomy, 2022 to 2032

        10.2.1. By Country

            10.2.1.1. Brazil

            10.2.1.2. Mexico

            10.2.1.3. Rest of Latin America

        10.2.2. By Deployment

        10.2.3. By Enterprise

        10.2.4. By End Use Industry

    10.3. Market Attractiveness Analysis

        10.3.1. By Country

        10.3.2. By Deployment

        10.3.3. By Enterprise

        10.3.4. By End Use Industry

    10.4. Key Takeaways

11. Europe Market Analysis 2017 to 2021 and Forecast 2022 to 2032, By Country

    11.1. Historical Market Size Value (US$ Million) Trend Analysis By Market Taxonomy, 2017 to 2021

    11.2. Market Size Value (US$ Million) Forecast By Market Taxonomy, 2022 to 2032

        11.2.1. By Country

            11.2.1.1. Germany

            11.2.1.2. United Kingdom

            11.2.1.3. France

            11.2.1.4. Spain

            11.2.1.5. Italy

            11.2.1.6. Rest of Europe

        11.2.2. By Deployment

        11.2.3. By Enterprise

        11.2.4. By End Use Industry

    11.3. Market Attractiveness Analysis

        11.3.1. By Country

        11.3.2. By Deployment

        11.3.3. By Enterprise

        11.3.4. By End Use Industry

    11.4. Key Takeaways

12. Asia Pacific Market Analysis 2017 to 2021 and Forecast 2022 to 2032, By Country

    12.1. Historical Market Size Value (US$ Million) Trend Analysis By Market Taxonomy, 2017 to 2021

    12.2. Market Size Value (US$ Million) Forecast By Market Taxonomy, 2022 to 2032

        12.2.1. By Country

            12.2.1.1. China

            12.2.1.2. Japan

            12.2.1.3. South Korea

            12.2.1.4. Rest of Asia Pacific

        12.2.2. By Deployment

        12.2.3. By Enterprise

        12.2.4. By End Use Industry

    12.3. Market Attractiveness Analysis

        12.3.1. By Country

        12.3.2. By Deployment

        12.3.3. By Enterprise

        12.3.4. By End Use Industry

    12.4. Key Takeaways

13. Middle East and Africa Market Analysis 2017 to 2021 and Forecast 2022 to 2032, By Country

    13.1. Historical Market Size Value (US$ Million) Trend Analysis By Market Taxonomy, 2017 to 2021

    13.2. Market Size Value (US$ Million) Forecast By Market Taxonomy, 2022 to 2032

        13.2.1. By Country

            13.2.1.1. GCC Countries

            13.2.1.2. South Africa

            13.2.1.3. Israel

            13.2.1.4. Rest of Middle East and Africa

        13.2.2. By Deployment

        13.2.3. By Enterprise

        13.2.4. By End Use Industry

    13.3. Market Attractiveness Analysis

        13.3.1. By Country

        13.3.2. By Deployment

        13.3.3. By Enterprise

        13.3.4. By End Use Industry

    13.4. Key Takeaways

14. Key Countries Market Analysis

    14.1. US

        14.1.1. Pricing Analysis

        14.1.2. Market Share Analysis, 2021

            14.1.2.1. By Deployment

            14.1.2.2. By Enterprise

            14.1.2.3. By End Use Industry

    14.2. Canada

        14.2.1. Pricing Analysis

        14.2.2. Market Share Analysis, 2021

            14.2.2.1. By Deployment

            14.2.2.2. By Enterprise

            14.2.2.3. By End Use Industry

    14.3. Brazil

        14.3.1. Pricing Analysis

        14.3.2. Market Share Analysis, 2021

            14.3.2.1. By Deployment

            14.3.2.2. By Enterprise

            14.3.2.3. By End Use Industry

    14.4. Mexico

        14.4.1. Pricing Analysis

        14.4.2. Market Share Analysis, 2021

            14.4.2.1. By Deployment

            14.4.2.2. By Enterprise

            14.4.2.3. By End Use Industry

    14.5. Germany

        14.5.1. Pricing Analysis

        14.5.2. Market Share Analysis, 2021

            14.5.2.1. By Deployment

            14.5.2.2. By Enterprise

            14.5.2.3. By End Use Industry

    14.6. United Kingdom

        14.6.1. Pricing Analysis

        14.6.2. Market Share Analysis, 2021

            14.6.2.1. By Deployment

            14.6.2.2. By Enterprise

            14.6.2.3. By End Use Industry

    14.7. France

        14.7.1. Pricing Analysis

        14.7.2. Market Share Analysis, 2021

            14.7.2.1. By Deployment

            14.7.2.2. By Enterprise

            14.7.2.3. By End Use Industry

    14.8. Spain

        14.8.1. Pricing Analysis

        14.8.2. Market Share Analysis, 2021

            14.8.2.1. By Deployment

            14.8.2.2. By Enterprise

            14.8.2.3. By End Use Industry

    14.9. Italy

        14.9.1. Pricing Analysis

        14.9.2. Market Share Analysis, 2021

            14.9.2.1. By Deployment

            14.9.2.2. By Enterprise

            14.9.2.3. By End Use Industry

    14.10. China

        14.10.1. Pricing Analysis

        14.10.2. Market Share Analysis, 2021

            14.10.2.1. By Deployment

            14.10.2.2. By Enterprise

            14.10.2.3. By End Use Industry

    14.11. Japan

        14.11.1. Pricing Analysis

        14.11.2. Market Share Analysis, 2021

            14.11.2.1. By Deployment

            14.11.2.2. By Enterprise

            14.11.2.3. By End Use Industry

    14.12. South Korea

        14.12.1. Pricing Analysis

        14.12.2. Market Share Analysis, 2021

            14.12.2.1. By Deployment

            14.12.2.2. By Enterprise

            14.12.2.3. By End Use Industry

    14.13. GCC Countries

        14.13.1. Pricing Analysis

        14.13.2. Market Share Analysis, 2021

            14.13.2.1. By Deployment

            14.13.2.2. By Enterprise

            14.13.2.3. By End Use Industry

    14.14. South Africa

        14.14.1. Pricing Analysis

        14.14.2. Market Share Analysis, 2021

            14.14.2.1. By Deployment

            14.14.2.2. By Enterprise

            14.14.2.3. By End Use Industry

    14.15. Israel

        14.15.1. Pricing Analysis

        14.15.2. Market Share Analysis, 2021

            14.15.2.1. By Deployment

            14.15.2.2. By Enterprise

            14.15.2.3. By End Use Industry

15. Market Structure Analysis

    15.1. Competition Dashboard

    15.2. Competition Benchmarking

    15.3. Market Share Analysis of Top Players

        15.3.1. By Regional

        15.3.2. By Deployment

        15.3.3. By Enterprise

        15.3.4. By End Use Industry

16. Competition Analysis

    16.1. Competition Deep Dive

        16.1.1. SAP SE

            16.1.1.1. Overview

            16.1.1.2. Product Portfolio

            16.1.1.3. Profitability by Market Segments

            16.1.1.4. Sales Footprint

            16.1.1.5. Strategy Overview

                16.1.1.5.1. Marketing Strategy

        16.1.2. Zycus Inc.

            16.1.2.1. Overview

            16.1.2.2. Product Portfolio

            16.1.2.3. Profitability by Market Segments

            16.1.2.4. Sales Footprint

            16.1.2.5. Strategy Overview

                16.1.2.5.1. Marketing Strategy

        16.1.3. Infosys Limited

            16.1.3.1. Overview

            16.1.3.2. Product Portfolio

            16.1.3.3. Profitability by Market Segments

            16.1.3.4. Sales Footprint

            16.1.3.5. Strategy Overview

                16.1.3.5.1. Marketing Strategy

        16.1.4. Bertelsmann SE

            16.1.4.1. Overview

            16.1.4.2. Product Portfolio

            16.1.4.3. Profitability by Market Segments

            16.1.4.4. Sales Footprint

            16.1.4.5. Strategy Overview

                16.1.4.5.1. Marketing Strategy

        16.1.5. Comarch SA

            16.1.5.1. Overview

            16.1.5.2. Product Portfolio

            16.1.5.3. Profitability by Market Segments

            16.1.5.4. Sales Footprint

            16.1.5.5. Strategy Overview

                16.1.5.5.1. Marketing Strategy

        16.1.6. Ariba Inc.

            16.1.6.1. Overview

            16.1.6.2. Product Portfolio

            16.1.6.3. Profitability by Market Segments

            16.1.6.4. Sales Footprint

            16.1.6.5. Strategy Overview

                16.1.6.5.1. Marketing Strategy

        16.1.7. ProActis

            16.1.7.1. Overview

            16.1.7.2. Product Portfolio

            16.1.7.3. Profitability by Market Segments

            16.1.7.4. Sales Footprint

            16.1.7.5. Strategy Overview

                16.1.7.5.1. Marketing Strategy

        16.1.8. GEP

            16.1.8.1. Overview

            16.1.8.2. Product Portfolio

            16.1.8.3. Profitability by Market Segments

            16.1.8.4. Sales Footprint

            16.1.8.5. Strategy Overview

                16.1.8.5.1. Marketing Strategy

        16.1.9. Oracle

            16.1.9.1. Overview

            16.1.9.2. Product Portfolio

            16.1.9.3. Profitability by Market Segments

            16.1.9.4. Sales Footprint

            16.1.9.5. Strategy Overview

                16.1.9.5.1. Marketing Strategy

        16.1.10. Wax Digital

            16.1.10.1. Overview

            16.1.10.2. Product Portfolio

            16.1.10.3. Profitability by Market Segments

            16.1.10.4. Sales Footprint

            16.1.10.5. Strategy Overview

                16.1.10.5.1. Marketing Strategy

        16.1.11. Synertrade

            16.1.11.1. Overview

            16.1.11.2. Product Portfolio

            16.1.11.3. Profitability by Market Segments

            16.1.11.4. Sales Footprint

            16.1.11.5. Strategy Overview

                16.1.11.5.1. Marketing Strategy

        16.1.12. Coupa Software Inc.

            16.1.12.1. Overview

            16.1.12.2. Product Portfolio

            16.1.12.3. Profitability by Market Segments

            16.1.12.4. Sales Footprint

            16.1.12.5. Strategy Overview

                16.1.12.5.1. Marketing Strategy

        16.1.13. Ivalua

            16.1.13.1. Overview

            16.1.13.2. Product Portfolio

            16.1.13.3. Profitability by Market Segments

            16.1.13.4. Sales Footprint

            16.1.13.5. Strategy Overview

                16.1.13.5.1. Marketing Strategy

17. Assumptions & Acronyms Used

18. Research Methodology

Don't pay for what you don't need

Customize your report by selecting specific countries or regions and save 30%!

List of Tables

Table 1: Global Market Value (US$ Million) Forecast by Region, 2017 to 2032

Table 2: Global Market Value (US$ Million) Forecast by Deployment, 2017 to 2032

Table 3: Global Market Value (US$ Million) Forecast by Enterprise, 2017 to 2032

Table 4: Global Market Value (US$ Million) Forecast by End Use Industry, 2017 to 2032

Table 5: North America Market Value (US$ Million) Forecast by Country, 2017 to 2032

Table 6: North America Market Value (US$ Million) Forecast by Deployment, 2017 to 2032

Table 7: North America Market Value (US$ Million) Forecast by Enterprise, 2017 to 2032

Table 8: North America Market Value (US$ Million) Forecast by End Use Industry, 2017 to 2032

Table 9: Latin America Market Value (US$ Million) Forecast by Country, 2017 to 2032

Table 10: Latin America Market Value (US$ Million) Forecast by Deployment, 2017 to 2032

Table 11: Latin America Market Value (US$ Million) Forecast by Enterprise, 2017 to 2032

Table 12: Latin America Market Value (US$ Million) Forecast by End Use Industry, 2017 to 2032

Table 13: Europe Market Value (US$ Million) Forecast by Country, 2017 to 2032

Table 14: Europe Market Value (US$ Million) Forecast by Deployment, 2017 to 2032

Table 15: Europe Market Value (US$ Million) Forecast by Enterprise, 2017 to 2032

Table 16: Europe Market Value (US$ Million) Forecast by End Use Industry, 2017 to 2032

Table 17: Asia Pacific Market Value (US$ Million) Forecast by Country, 2017 to 2032

Table 18: Asia Pacific Market Value (US$ Million) Forecast by Deployment, 2017 to 2032

Table 19: Asia Pacific Market Value (US$ Million) Forecast by Enterprise, 2017 to 2032

Table 20: Asia Pacific Market Value (US$ Million) Forecast by End Use Industry, 2017 to 2032

Table 21: Middle East and Africa Market Value (US$ Million) Forecast by Country, 2017 to 2032

Table 22: Middle East and Africa Market Value (US$ Million) Forecast by Deployment, 2017 to 2032

Table 23: Middle East and Africa Market Value (US$ Million) Forecast by Enterprise, 2017 to 2032

Table 24: Middle East and Africa Market Value (US$ Million) Forecast by End Use Industry, 2017 to 2032
Sudip Saha
Sudip Saha

Principal Consultant

Talk to Analyst

Find your sweet spots for generating winning opportunities in this market.

List of Charts

Figure 1: Global Market Value (US$ Million) by Deployment, 2022 to 2032

Figure 2: Global Market Value (US$ Million) by Enterprise, 2022 to 2032

Figure 3: Global Market Value (US$ Million) by End Use Industry, 2022 to 2032

Figure 4: Global Market Value (US$ Million) by Region, 2022 to 2032

Figure 5: Global Market Value (US$ Million) Analysis by Region, 2017 to 2032

Figure 6: Global Market Value Share (%) and BPS Analysis by Region, 2022 to 2032

Figure 7: Global Market Y-o-Y Growth (%) Projections by Region, 2022 to 2032

Figure 8: Global Market Value (US$ Million) Analysis by Deployment, 2017 to 2032

Figure 9: Global Market Value Share (%) and BPS Analysis by Deployment, 2022 to 2032

Figure 10: Global Market Y-o-Y Growth (%) Projections by Deployment, 2022 to 2032

Figure 11: Global Market Value (US$ Million) Analysis by Enterprise, 2017 to 2032

Figure 12: Global Market Value Share (%) and BPS Analysis by Enterprise, 2022 to 2032

Figure 13: Global Market Y-o-Y Growth (%) Projections by Enterprise, 2022 to 2032

Figure 14: Global Market Value (US$ Million) Analysis by End Use Industry, 2017 to 2032

Figure 15: Global Market Value Share (%) and BPS Analysis by End Use Industry, 2022 to 2032

Figure 16: Global Market Y-o-Y Growth (%) Projections by End Use Industry, 2022 to 2032

Figure 17: Global Market Attractiveness by Deployment, 2022 to 2032

Figure 18: Global Market Attractiveness by Enterprise, 2022 to 2032

Figure 19: Global Market Attractiveness by End Use Industry, 2022 to 2032

Figure 20: Global Market Attractiveness by Region, 2022 to 2032

Figure 21: North America Market Value (US$ Million) by Deployment, 2022 to 2032

Figure 22: North America Market Value (US$ Million) by Enterprise, 2022 to 2032

Figure 23: North America Market Value (US$ Million) by End Use Industry, 2022 to 2032

Figure 24: North America Market Value (US$ Million) by Country, 2022 to 2032

Figure 25: North America Market Value (US$ Million) Analysis by Country, 2017 to 2032

Figure 26: North America Market Value Share (%) and BPS Analysis by Country, 2022 to 2032

Figure 27: North America Market Y-o-Y Growth (%) Projections by Country, 2022 to 2032

Figure 28: North America Market Value (US$ Million) Analysis by Deployment, 2017 to 2032

Figure 29: North America Market Value Share (%) and BPS Analysis by Deployment, 2022 to 2032

Figure 30: North America Market Y-o-Y Growth (%) Projections by Deployment, 2022 to 2032

Figure 31: North America Market Value (US$ Million) Analysis by Enterprise, 2017 to 2032

Figure 32: North America Market Value Share (%) and BPS Analysis by Enterprise, 2022 to 2032

Figure 33: North America Market Y-o-Y Growth (%) Projections by Enterprise, 2022 to 2032

Figure 34: North America Market Value (US$ Million) Analysis by End Use Industry, 2017 to 2032

Figure 35: North America Market Value Share (%) and BPS Analysis by End Use Industry, 2022 to 2032

Figure 36: North America Market Y-o-Y Growth (%) Projections by End Use Industry, 2022 to 2032

Figure 37: North America Market Attractiveness by Deployment, 2022 to 2032

Figure 38: North America Market Attractiveness by Enterprise, 2022 to 2032

Figure 39: North America Market Attractiveness by End Use Industry, 2022 to 2032

Figure 40: North America Market Attractiveness by Country, 2022 to 2032

Figure 41: Latin America Market Value (US$ Million) by Deployment, 2022 to 2032

Figure 42: Latin America Market Value (US$ Million) by Enterprise, 2022 to 2032

Figure 43: Latin America Market Value (US$ Million) by End Use Industry, 2022 to 2032

Figure 44: Latin America Market Value (US$ Million) by Country, 2022 to 2032

Figure 45: Latin America Market Value (US$ Million) Analysis by Country, 2017 to 2032

Figure 46: Latin America Market Value Share (%) and BPS Analysis by Country, 2022 to 2032

Figure 47: Latin America Market Y-o-Y Growth (%) Projections by Country, 2022 to 2032

Figure 48: Latin America Market Value (US$ Million) Analysis by Deployment, 2017 to 2032

Figure 49: Latin America Market Value Share (%) and BPS Analysis by Deployment, 2022 to 2032

Figure 50: Latin America Market Y-o-Y Growth (%) Projections by Deployment, 2022 to 2032

Figure 51: Latin America Market Value (US$ Million) Analysis by Enterprise, 2017 to 2032

Figure 52: Latin America Market Value Share (%) and BPS Analysis by Enterprise, 2022 to 2032

Figure 53: Latin America Market Y-o-Y Growth (%) Projections by Enterprise, 2022 to 2032

Figure 54: Latin America Market Value (US$ Million) Analysis by End Use Industry, 2017 to 2032

Figure 55: Latin America Market Value Share (%) and BPS Analysis by End Use Industry, 2022 to 2032

Figure 56: Latin America Market Y-o-Y Growth (%) Projections by End Use Industry, 2022 to 2032

Figure 57: Latin America Market Attractiveness by Deployment, 2022 to 2032

Figure 58: Latin America Market Attractiveness by Enterprise, 2022 to 2032

Figure 59: Latin America Market Attractiveness by End Use Industry, 2022 to 2032

Figure 60: Latin America Market Attractiveness by Country, 2022 to 2032

Figure 61: Europe Market Value (US$ Million) by Deployment, 2022 to 2032

Figure 62: Europe Market Value (US$ Million) by Enterprise, 2022 to 2032

Figure 63: Europe Market Value (US$ Million) by End Use Industry, 2022 to 2032

Figure 64: Europe Market Value (US$ Million) by Country, 2022 to 2032

Figure 65: Europe Market Value (US$ Million) Analysis by Country, 2017 to 2032

Figure 66: Europe Market Value Share (%) and BPS Analysis by Country, 2022 to 2032

Figure 67: Europe Market Y-o-Y Growth (%) Projections by Country, 2022 to 2032

Figure 68: Europe Market Value (US$ Million) Analysis by Deployment, 2017 to 2032

Figure 69: Europe Market Value Share (%) and BPS Analysis by Deployment, 2022 to 2032

Figure 70: Europe Market Y-o-Y Growth (%) Projections by Deployment, 2022 to 2032

Figure 71: Europe Market Value (US$ Million) Analysis by Enterprise, 2017 to 2032

Figure 72: Europe Market Value Share (%) and BPS Analysis by Enterprise, 2022 to 2032

Figure 73: Europe Market Y-o-Y Growth (%) Projections by Enterprise, 2022 to 2032

Figure 74: Europe Market Value (US$ Million) Analysis by End Use Industry, 2017 to 2032

Figure 75: Europe Market Value Share (%) and BPS Analysis by End Use Industry, 2022 to 2032

Figure 76: Europe Market Y-o-Y Growth (%) Projections by End Use Industry, 2022 to 2032

Figure 77: Europe Market Attractiveness by Deployment, 2022 to 2032

Figure 78: Europe Market Attractiveness by Enterprise, 2022 to 2032

Figure 79: Europe Market Attractiveness by End Use Industry, 2022 to 2032

Figure 80: Europe Market Attractiveness by Country, 2022 to 2032

Figure 81: Asia Pacific Market Value (US$ Million) by Deployment, 2022 to 2032

Figure 82: Asia Pacific Market Value (US$ Million) by Enterprise, 2022 to 2032

Figure 83: Asia Pacific Market Value (US$ Million) by End Use Industry, 2022 to 2032

Figure 84: Asia Pacific Market Value (US$ Million) by Country, 2022 to 2032

Figure 85: Asia Pacific Market Value (US$ Million) Analysis by Country, 2017 to 2032

Figure 86: Asia Pacific Market Value Share (%) and BPS Analysis by Country, 2022 to 2032

Figure 87: Asia Pacific Market Y-o-Y Growth (%) Projections by Country, 2022 to 2032

Figure 88: Asia Pacific Market Value (US$ Million) Analysis by Deployment, 2017 to 2032

Figure 89: Asia Pacific Market Value Share (%) and BPS Analysis by Deployment, 2022 to 2032

Figure 90: Asia Pacific Market Y-o-Y Growth (%) Projections by Deployment, 2022 to 2032

Figure 91: Asia Pacific Market Value (US$ Million) Analysis by Enterprise, 2017 to 2032

Figure 92: Asia Pacific Market Value Share (%) and BPS Analysis by Enterprise, 2022 to 2032

Figure 93: Asia Pacific Market Y-o-Y Growth (%) Projections by Enterprise, 2022 to 2032

Figure 94: Asia Pacific Market Value (US$ Million) Analysis by End Use Industry, 2017 to 2032

Figure 95: Asia Pacific Market Value Share (%) and BPS Analysis by End Use Industry, 2022 to 2032

Figure 96: Asia Pacific Market Y-o-Y Growth (%) Projections by End Use Industry, 2022 to 2032

Figure 97: Asia Pacific Market Attractiveness by Deployment, 2022 to 2032

Figure 98: Asia Pacific Market Attractiveness by Enterprise, 2022 to 2032

Figure 99: Asia Pacific Market Attractiveness by End Use Industry, 2022 to 2032

Figure 100: Asia Pacific Market Attractiveness by Country, 2022 to 2032

Figure 101: Middle East and Africa Market Value (US$ Million) by Deployment, 2022 to 2032

Figure 102: Middle East and Africa Market Value (US$ Million) by Enterprise, 2022 to 2032

Figure 103: Middle East and Africa Market Value (US$ Million) by End Use Industry, 2022 to 2032

Figure 104: Middle East and Africa Market Value (US$ Million) by Country, 2022 to 2032

Figure 105: Middle East and Africa Market Value (US$ Million) Analysis by Country, 2017 to 2032

Figure 106: Middle East and Africa Market Value Share (%) and BPS Analysis by Country, 2022 to 2032

Figure 107: Middle East and Africa Market Y-o-Y Growth (%) Projections by Country, 2022 to 2032

Figure 108: Middle East and Africa Market Value (US$ Million) Analysis by Deployment, 2017 to 2032

Figure 109: Middle East and Africa Market Value Share (%) and BPS Analysis by Deployment, 2022 to 2032

Figure 110: Middle East and Africa Market Y-o-Y Growth (%) Projections by Deployment, 2022 to 2032

Figure 111: Middle East and Africa Market Value (US$ Million) Analysis by Enterprise, 2017 to 2032

Figure 112: Middle East and Africa Market Value Share (%) and BPS Analysis by Enterprise, 2022 to 2032

Figure 113: Middle East and Africa Market Y-o-Y Growth (%) Projections by Enterprise, 2022 to 2032

Figure 114: Middle East and Africa Market Value (US$ Million) Analysis by End Use Industry, 2017 to 2032

Figure 115: Middle East and Africa Market Value Share (%) and BPS Analysis by End Use Industry, 2022 to 2032

Figure 116: Middle East and Africa Market Y-o-Y Growth (%) Projections by End Use Industry, 2022 to 2032

Figure 117: Middle East and Africa Market Attractiveness by Deployment, 2022 to 2032

Figure 118: Middle East and Africa Market Attractiveness by Enterprise, 2022 to 2032

Figure 119: Middle East and Africa Market Attractiveness by End Use Industry, 2022 to 2032

Figure 120: Middle East and Africa Market Attractiveness by Country, 2022 to 2032

Recommendations

Technology

E-Learning Solutions Market

Published : January 2023

Technology

G-3 PLC Solutions Market

Published : March 2022

Technology

E-tailing Solutions Market

Published : June 2020

Explore Technology Insights

View Reports