Omega-3 Concentrates Market Size and Share Forecast Outlook 2025 to 2035

The Omega-3 Concentrates Market is estimated to be valued at USD 3.1 billion in 2025 and is projected to reach USD 5.9 billion by 2035, registering a compound annual growth rate (CAGR) of 6.7% over the forecast period.

The Omega-3 Concentrates market is experiencing robust growth driven by increasing consumer awareness regarding the health benefits of omega-3 fatty acids, particularly in cardiovascular, cognitive, and inflammatory health management. The future outlook for this market is influenced by rising demand from both developed and emerging economies due to lifestyle-related health concerns and growing preventive healthcare adoption. Continuous advancements in extraction and concentration technologies are enhancing the bioavailability and purity of omega-3 products, further supporting market expansion.

Increasing investment in nutraceuticals, functional foods, and dietary supplements is fueling demand across multiple regions. Additionally, the shift towards personalized nutrition and health-oriented consumption patterns is creating new opportunities for product differentiation and premium formulations.

Regulatory support and approvals for omega-3 usage in food, beverages, and supplements are further facilitating market adoption As consumer preference for sustainable and high-quality ingredients rises, the Omega-3 Concentrates market is expected to witness steady growth, with sustained opportunities across multiple end-use applications and product formats.
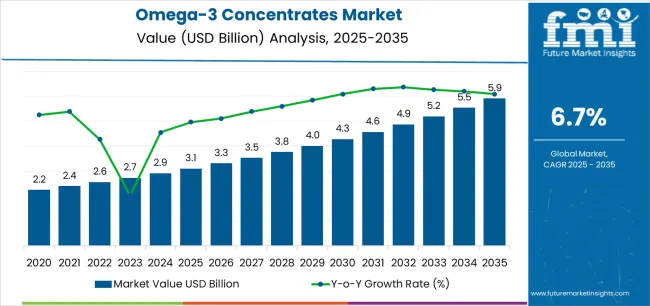
Quick Stats for Omega-3 Concentrates Market

  • Omega-3 Concentrates Market Industry Value (2025): USD 3.1 billion
  • Omega-3 Concentrates Market Forecast Value (2035): USD 5.9 billion
  • Omega-3 Concentrates Market Forecast CAGR: 6.7%
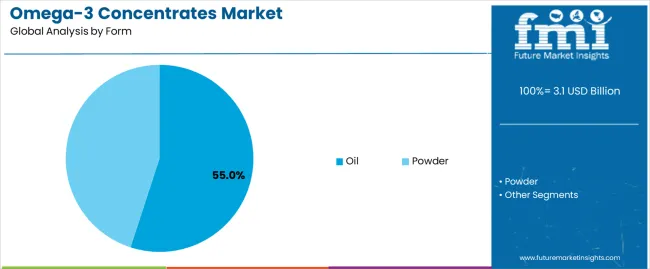
  • Leading Segment in Omega-3 Concentrates Market in 2025: Oil (55.0%)
  • Key Growth Region in Omega-3 Concentrates Market: North America, Asia-Pacific, Europe
  • Top Key Players in Omega-3 Concentrates Market: DSM, Australian Omega Oils Pty. Ltd., BASF SE, Epax, GC Rieber (VivoMega), AlaskOmega, Norwegian Fish Oil, Nordic Naturals, Golden Omega, ADM, KD Pharma Group, Corbion, Orkla Health, Olvea Omega Solutions

Omega 3 Concentrates Market Market Value Analysis

Metric Value
Omega-3 Concentrates Market Estimated Value in (2025 E) USD 3.1 billion
Omega-3 Concentrates Market Forecast Value in (2035 F) USD 5.9 billion
Forecast CAGR (2025 to 2035) 6.7%

Segmental Analysis

The market is segmented by Form, Source, Type, Concentration, End Use, and Packaging and region. By Form, the market is divided into Oil and Powder. In terms of Source, the market is classified into Fish, Krill, Calamari, Algae, and Others. Based on Type, the market is segmented into Triglyceride (TG), Ethyl Ester (EE), and Phospholipids (PL). By Concentration, the market is divided into High EPA, High DHA, and Balanced EPA: DHA. By End Use, the market is segmented into Food And Beverages, Dietary Supplements, Pharmaceuticals, Nutraceuticals, Infant Formula, Personal Care And Cosmetics, and Pet Food. By Packaging, the market is segmented into Drums and Totes. Regionally, the market is classified into North America, Latin America, Western Europe, Eastern Europe, Balkan & Baltic Countries, Russia & Belarus, Central Asia, East Asia, South Asia & Pacific, and the Middle East & Africa.
Insights into the Oil Form Segment

Omega 3 Concentrates Market Analysis By Form

The oil form is projected to hold 55.0% of the Omega-3 Concentrates market revenue share in 2025, establishing it as the leading form segment. This dominance is attributed to the ease of consumption, high bioavailability, and flexibility in incorporation into functional foods, beverages, and supplements. Oils allow precise dosing and are highly preferred by consumers seeking direct nutritional supplementation.

The segment has benefited from technological advancements in encapsulation and flavor masking, which enhance palatability and shelf stability. The widespread acceptance of omega-3 oils in nutraceutical and pharmaceutical formulations has further reinforced its market position.

Additionally, the increasing focus on preventive healthcare and wellness trends is driving the demand for convenient and effective oil-based omega-3 supplements The robust presence of oil forms in both consumer retail and professional health channels continues to sustain its leading revenue share.
Insights into the Fish Source Segment

Omega 3 Concentrates Market Analysis By Source

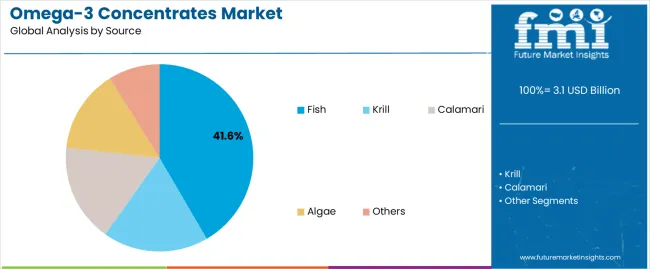
The fish source segment is expected to capture 41.6% of the Omega-3 Concentrates market revenue share in 2025, positioning it as the leading source segment. Growth in this segment is driven by the high concentration of EPA and DHA in fish oils, which are recognized for their superior health benefits.

The availability of high-quality fish oil concentrates, along with advancements in purification and deodorization processes, has enhanced product appeal. Increasing consumer preference for natural and marine-derived ingredients over synthetic alternatives has further reinforced the segment’s market position.

The segment has also benefited from improved supply chain management and sustainable sourcing practices, which ensure product quality and traceability These factors collectively support the adoption of fish-based omega-3 concentrates across dietary supplement and functional food applications, sustaining its revenue dominance.
Insights into the Triglyceride Type Segment

Omega 3 Concentrates Market Analysis By Type

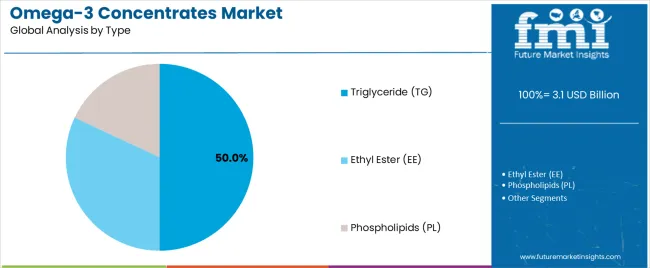
The triglyceride (TG) type segment is anticipated to account for 50.0% of the Omega-3 Concentrates market revenue in 2025, making it the leading type segment. This segment’s growth is attributed to higher bioavailability and superior absorption rates compared to ethyl ester and other forms.

TG-based omega-3 concentrates are increasingly preferred in nutraceutical formulations due to their compatibility with existing dietary fats and enhanced stability. The segment has benefited from technological improvements in concentration and refinement, which maintain the structural integrity of fatty acids and improve consumer efficacy.

Rising awareness about the health advantages of triglyceride-form omega-3s, including cardiovascular and cognitive benefits, has further driven adoption Additionally, the segment’s acceptance in both functional food and supplement markets ensures sustained growth and continued dominance in revenue share.

Semi-Annual Demand Space Update

The below table presents a comparative assessment of the variation in CAGR over six months for the base year (2025) and current year (2025) for global omega-3 concentrate market.

This analysis reveals crucial shifts in market performance and indicates revenue realization patterns, thus providing stakeholders with a better vision about the market growth trajectory over the year. The first half of the year, or H1, spans from January to June. The second half, H2, includes the months from July to December.

Particular Value CAGR
H1 5.4% (2025 to 2035)
H2 5.7% (2025 to 2035)
H1 6.3% (2025 to 2035)
H2 6.8% (2025 to 2035)

The above table presents the expected CAGR for the global omega-3 concentrate demand space over semi-annual period spanning from 2025 to 2035. In the first half (H1) of the year 2025, the business is predicted to surge at a CAGR of 5.4%, followed by a slightly higher growth rate of 5.7% in the second half (H2) of the same year.

Moving into year 2025, the CAGR is projected to increase slightly to 6.3% in the first half and remain relatively moderate at 6.8% in the second half. In the first half (H1 2025) the market witnessed a decrease of 19 BPS while in the second half (H2 2025), the market witnessed an increase of 32 BPS.

Key Industry Highlights

Omega-3 Fortification in Infant Formula is Gaining Momentum

Growing awareness of DHA's vital role in infant brain and visual development is considerably driving the inclusion of omega-3 concentrates in infant formula. DHA, a key omega-3 fatty acid, is essential for proper neurological and visual functioning in infants. Parents and healthcare specialist are progressively recognizing its importance, which is leading to a higher demand for fortified infant formulas.

Due to which, manufacturers are producing products with enhanced omega-3 concentrates to meet this growing demand, and ensuring infants receive optimal nutrition for healthy development during the crucial early stages of life.

Expanding Use of Omega-3 Concentrates in Personal Care and Cosmetics

The use of omega-3 concentrates in personal care and cosmetic products is expanding due to their proven skin health and anti-inflammatory properties. Omega-3 fatty acids help maintain skin hydration, improve elasticity, and reduce signs of aging by tackling inflammation and promoting cell membrane health.

As consumers become more health-conscious and are seeking natural ingredients, the demand for skincare and cosmetic products enriched with omega-3s is growing. This encourages manufacturers to innovate and include these beneficial concentrates in a wider range of beauty and personal care products.

Rise of Algae-Based Omega-3s: Meeting Sustainability Demands

There is a distinct shift towards sustainably sourced omega-3 fatty acids, particularly from algae-based products, driven by increasing environmental awareness among consumers. Algae-based omega-3 sources are considered as more eco-friendly compared to traditional fish-derived sources, which helps reduce concerns over marine ecosystem depletion.

This drift reflects a broader consumer preference for products that minimize environmental impact and promote sustainable practices. As awareness grows about the benefits of algae-based omega-3s, such as reduced environmental footprint and potential purity advantages, more consumers are opting for these sustainable alternatives for their dietary supplements and functional foods.

2020 to 2025 Global Omega- 3 Concentrates Sales Analysis Compared to Demand Forecasts for 2025 to 2035

Global Omega-3 Concentrates sales increased at a CAGR of 5.9% from 2020 to 2025. For the next ten years (2025 to 2035), projections are that expenditure on Omega- 3 Concentrates will rise at 7.0% CAGR

The rising popularity of dietary supplements as a means to enhance overall health and wellness has been a major stimulant for the growth of the omega-3 concentrate market.

Consumers are increasingly switching to supplements to complement their diets and address specific health concerns, including cardiovascular health, cognitive function, and inflammation reduction, domains where omega-3 fatty acids are well known to provide major benefits.

This shift is driven by growing health consciousness and the desire for preventive healthcare measures, pushing manufacturers to innovate and expand their offerings of omega-3 concentrates in various forms to meet the increasing demand in the supplement market.

Increasing awareness of pet health and nutrition is prompting the inlusion of omega-3 concentrates into pet food formulations. Omega-3 fatty acids, such as DHA and EPA, offer benefits for pets similar to those for humans, including support for joint health, coat condition, and overall immune system function.

As pet owners are searching to provide optimal nutrition for their animals, omega-3 enrichment in pet foods is becoming a essential attribute in meeting these health-conscious demands.

Market Concentration

Tier 1 companies comprise industry leaders with market revenue of above USD 50 million capturing significant sales domain share of 45% to 55% in the global sphere. These business leaders are characterized by high production capacity and a wide product portfolio.

These trade leaders are distinguished by their extensive expertise in manufacturing and reconditioning across multiple packaging formats and a broad geographical reach, underpinned by a robust consumer base. Prominent companies within tier 1 include BASF SE, Nordic Naturals, DSM, ADM, and Corbion

Tier 2 companies include mid-size players with revenue of USD 10 to 50 million having presence in specific regions and highly influencing the local retail space. These are characterized by a strong presence overseas and strong consumer base knowledge.

These industry players have good technology and ensure regulatory compliance but may not have advanced technology and wide global reach. Prominent companies in tier 2 include Epax, GC Rieber (VivoMega), AlaskOmega, Norwegian Fish Oil, Golden Omega, KD Pharma Group, Orkla Health, and Olvea Omega Solutions

Tier 3 includes the majority of small-scale companies operating at the local presence and serving niche demand space having revenue below USD 10 million. These companies are notably oriented towards fulfilling local marketplace demands and are consequently classified within the tier 3 share segment.

They are small-scale players and have limited geographical reach. Tier 3, within this context, is recognized as an unorganized field, denoting a sector characterized by a lack of extensive structure and formalization when compared to organized competitors.

Country-wise Insights

The table below highlights revenue from product sales in key countries. The China and Japan are predicted to remain top consumers, with estimated trade valuations of USD 5.9 million and USD 598.9 million, respectively, by 2035.

Countries Market Value (2035)
China USD 5.9 million
Japan USD 598.9 million
India USD 519.4 million
USA USD 164.3 million
Australia USD 127.2 million

The following table shows the estimated growth rates of the top five sales domain. India and China are set to exhibit high Omega- 3 Concentrates consumption, recording CAGRs of 5.9% and 5.5%, respectively, through 2035.

Countries CAGR 2025 to 2035
China 5.5%
Japan 5.3%
India 5.9%
USA 4.9%
Australia 4.6%

Japan’s Aging Population is Prevailing Omega-3 Concentrates Sales

The demand space for Omega- 3 Concentrates in the Japan is projected to exhibit a CAGR of 5.3% during the assessment period. By 2035, revenue from the sales of Omega- 3 Concentrates in the country is expected to reach USD 598.9 Million.

Japan's aging population is one of the world's most prominent, has increased the requirement for health supplements aimed at reducing age-related issues. Omega-3 fatty acids, popular for their anti-inflammatory properties and contributions to heart and brain health, are especially appealing to older adults pursuing to maintain cognitive sharpness and cardiovascular well-being.

This demographics’ amplified health consciousness and proactive approach to aging, linked with widespread scientific endorsement of omega-3 benefits, drive strong market interest in Japan. As a result, products enriched with omega-3 concentrates are consequently featured in the country's healthcare and wellness strategies aimed at supporting longevity and quality of life.

Demand Outlook for Omega- 3 Concentrates in India

Omega- 3 Concentrates demand in India is calculated to rise at a value CAGR of 5.9% during the forecast period (2025 to 2035). By 2035, India is expected to account for 32.6% of Omega- 3 Concentrates sales in East Asia.

Most of the Indians experience dietary deficiencies in essential nutrients like omega-3 fatty acids, determined by traditional diets that often lack adequate fish consumption. This deficiency has boosted interest in omega-3 supplements as a convenient solution to bridge nutritional gaps and support overall health.

Simultaneously, the rising frequency of lifestyle-related diseases such as cardiovascular conditions, diabetes, and cognitive decline has pointed out the importance of preventive healthcare strategies.

Omega-3 supplements are incrementally getting recognized as a proactive measure to reduce these health risks, promoting their adoption among individuals looking to maintain or improve their long-term health issues in India's evolving healthcare environment.

Rising Popularity for Omega-3 enriched supplements amongst the Fitness Community in USA

Consumption of Omega- 3 Concentrates in USA is projected to increase at a value CAGR of 4.9% over the next ten years. By 2035, the business size is forecasted to reach USD 164.3 Million, with China expected to account for a domain share of 78.3% in East Asia.

Omega-3s has gained popularity among athletes and fitness enthusiasts in the USA because of their perceived benefits for joint health, reducing inflammation, and enhancing overall physical performance. These fatty acids are considered to support recovery and reduce exercise-induced muscle soreness, which makes them a preferred supplement in the fitness community.

While, ongoing product innovation has further boosted their appeal. Advances such as higher concentrations and improved food attributes in omega-3 supplements cater to consumer preferences for effectiveness and palatability, further driving greater acceptance and integration of these products into daily health routines among active individuals in the country.

Category-Wise Insights

Enhanced Bioavailability and Absorption of Fish-Sourced Omega-3

Segment Fish (Source)
Value Share (2025) 41.6%

Sales of fish sourced Omega- 3 Concentrates are projected to register a CAGR of 5.7% from 2025 to 2035. Fish-sourced omega-3s, especially in the form of triglycerides, are often more bioavailable and easily absorbed by the body compared to plant-based or other sources, which ensures more efficient utilization of these essential fatty acids.

Extensive research and clinical studies have shown the health benefits of fish-derived omega-3 fatty acids, specifically EPA (eicosapentaenoic acid) and DHA (docosahexaenoic acid).

These benefits include improved heart health, cognitive function, and anti-inflammatory properties, making them highly sought after. Furthermore, fish oil concentrates typically contain higher levels of EPA and DHA compared to plant-based omega-3 sources. This higher concentration means that consumers can achieve therapeutic benefits with smaller doses, enhancing the appeal and effectiveness of fish-sourced omega-3 supplements.

Health-Enhancing Benefits of Omega-3 Fortification in Food and Beverages

Segment Food & Beverages (End Use)
Value Share (2025) 38.2%

The Food & Beverages segment is anticipated to advance at 6.2% CAGR during the projection period.

Food and beverage companies are determined to differentiate their products in a competitive marketplace by adding omega-3 concentrates. This addition allows them to trade their offerings as health-enhancing, appealing to the growing segment of health-conscious consumers pursuing functional benefits from their food and beverages.

Moreover, many consumers suffer from nutritional deficiencies, particularly in omega-3 fatty acids, due to insufficient dietary intake of fish and other sources. Fortifying foods and beverages with omega-3s provides a convenient solution for increasing omega-3 intake without requiring crucial change in eating habits.

This fortification benefits consumers to meet their nutritional needs easily, supporting overall health and wellness, and further driving the demand for omega-3-enriched products in the market.
Competition Outlook

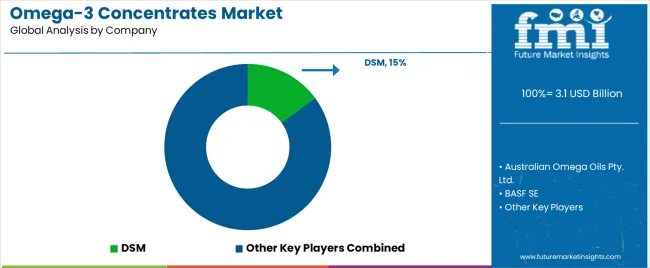
Omega 3 Concentrates Market Analysis By Company

The Omega- 3 Concentrates market encompasses a diverse and dynamic competitive landscape. Leading Omega- 3 Concentrates manufacturing companies are focusing on research and development, sustainable sourcing, and new formulations. They are also emphasizing environment-friendly practices and product certifications to satisfy the increasing demand for natural and sustainable ingredients.

For instance

  • In 2025, The first concentrated oil combining LC-MUFAs and LC-PUFAs was launched by Epax. Epax EQP+ Tech, a next-generation distillation method, is utilized in the manufacturing of the new product, allowing Epax to isolate and enhance the amount of Omegas 3, 9, and 11. These fatty acids constitute at least 720 mg/g of EPAX Omega 3-9-11.
  • In 2025, VivoMega received V-Label Certification for its New Omega-3 Supplements derived from Microalgae.
  • In 2025, To meet the growing demand for Omega 3, DSM expanded it’s portfolio and introduced algal portfolio.
  • In 2024, Wiley Companies launched their first omega-3 concentrate in powder form

Leading Omega- 3 Concentrates Brands

  • Australian Omega Oils Pty. Ltd.
  • BASF SE
  • Epax
  • GC Rieber (VivoMega)
  • AlaskOmega
  • Norwegian Fish Oil
  • Nordic Naturals
  • DSM
  • Golden Omega
  • ADM
  • KD Pharma Group
  • Corbion
  • Orkla Health
  • Olvea Omega Solutions
  • Others

Key Segments of Market Report

By Form:

As per form, the market has been categorized into powder and oil

By Source:

This segment is further categorized into krill, fish, calamari, algae, and others

By Type:

As per type, the market has been categorized into triglyceride (TG), ethyl ester (EE), and phospholipids (PL)

By Concentration:

This segment is further categorized into High DHA, High EPA, and Balanced EPA: DHA

By End Use:

As per end use, the market has been categorized into food and beverages, dietary supplements, pharmaceuticals, nutraceuticals, infant formula, personal care and cosmetics, and pet food

By Packaging:

This segment is further categorized into drums and totes

By Region:

Industry analysis has been carried out in key countries of North America, Latin America, Europe, East Asia, South Asia, Oceania, and the Middle East & Africa.

Frequently Asked Questions

How big is the omega-3 concentrates market in 2025?

The global omega-3 concentrates market is estimated to be valued at USD 3.1 billion in 2025.

What will be the size of omega-3 concentrates market in 2035?

The market size for the omega-3 concentrates market is projected to reach USD 5.9 billion by 2035.

How much will be the omega-3 concentrates market growth between 2025 and 2035?

The omega-3 concentrates market is expected to grow at a 6.7% CAGR between 2025 and 2035.

What are the key product types in the omega-3 concentrates market?

The key product types in omega-3 concentrates market are oil and powder.

Which source segment to contribute significant share in the omega-3 concentrates market in 2025?

In terms of source, fish segment to command 41.6% share in the omega-3 concentrates market in 2025.

Table of Content

  1. Executive Summary
    • Global Market Outlook
    • Demand-side Trends
    • Supply-side Trends
    • Technology Roadmap Analysis
    • Analysis and Recommendations
  2. Market Overview
    • Market Coverage / Taxonomy
    • Market Definition / Scope / Limitations
  3. Market Background
    • Market Dynamics
      • Drivers
      • Restraints
      • Opportunity
      • Trends
    • Scenario Forecast
      • Demand in Optimistic Scenario
      • Demand in Likely Scenario
      • Demand in Conservative Scenario
    • Opportunity Map Analysis
    • Product Life Cycle Analysis
    • Supply Chain Analysis
    • Investment Feasibility Matrix
    • Value Chain Analysis
    • PESTLE and Porter’s Analysis
    • Regulatory Landscape
    • Regional Parent Market Outlook
    • Production and Consumption Statistics
    • Import and Export Statistics
  4. Global Market Analysis 2020 to 2024 and Forecast, 2025 to 2035
    • Historical Market Size Value (USD Million) Analysis, 2020 to 2024
    • Current and Future Market Size Value (USD Million) Projections, 2025 to 2035
      • Y-o-Y Growth Trend Analysis
      • Absolute $ Opportunity Analysis
  5. Global Market Pricing Analysis 2020 to 2024 and Forecast 2025 to 2035
  6. Global Market Analysis 2020 to 2024 and Forecast 2025 to 2035, By Form
    • Introduction / Key Findings
    • Historical Market Size Value (USD Million) Analysis By Form , 2020 to 2024
    • Current and Future Market Size Value (USD Million) Analysis and Forecast By Form , 2025 to 2035
      • Oil
      • Powder
    • Y-o-Y Growth Trend Analysis By Form , 2020 to 2024
    • Absolute $ Opportunity Analysis By Form , 2025 to 2035
  7. Global Market Analysis 2020 to 2024 and Forecast 2025 to 2035, By Source
    • Introduction / Key Findings
    • Historical Market Size Value (USD Million) Analysis By Source, 2020 to 2024
    • Current and Future Market Size Value (USD Million) Analysis and Forecast By Source, 2025 to 2035
      • Fish
      • Krill
      • Calamari
      • Algae
      • Others
    • Y-o-Y Growth Trend Analysis By Source, 2020 to 2024
    • Absolute $ Opportunity Analysis By Source, 2025 to 2035
  8. Global Market Analysis 2020 to 2024 and Forecast 2025 to 2035, By Type
    • Introduction / Key Findings
    • Historical Market Size Value (USD Million) Analysis By Type, 2020 to 2024
    • Current and Future Market Size Value (USD Million) Analysis and Forecast By Type, 2025 to 2035
      • Triglyceride (TG)
      • Ethyl Ester (EE)
      • Phospholipids (PL)
    • Y-o-Y Growth Trend Analysis By Type, 2020 to 2024
    • Absolute $ Opportunity Analysis By Type, 2025 to 2035
  9. Global Market Analysis 2020 to 2024 and Forecast 2025 to 2035, By Concentration
    • Introduction / Key Findings
    • Historical Market Size Value (USD Million) Analysis By Concentration, 2020 to 2024
    • Current and Future Market Size Value (USD Million) Analysis and Forecast By Concentration, 2025 to 2035
      • High EPA
      • High DHA
      • Balanced EPA: DHA
    • Y-o-Y Growth Trend Analysis By Concentration, 2020 to 2024
    • Absolute $ Opportunity Analysis By Concentration, 2025 to 2035
  10. Global Market Analysis 2020 to 2024 and Forecast 2025 to 2035, By End Use
    • Introduction / Key Findings
    • Historical Market Size Value (USD Million) Analysis By End Use, 2020 to 2024
    • Current and Future Market Size Value (USD Million) Analysis and Forecast By End Use, 2025 to 2035
      • Food And Beverages
      • Dietary Supplements
      • Pharmaceuticals
      • Nutraceuticals
      • Infant Formula
      • Personal Care And Cosmetics
      • Pet Food
    • Y-o-Y Growth Trend Analysis By End Use, 2020 to 2024
    • Absolute $ Opportunity Analysis By End Use, 2025 to 2035
  11. Global Market Analysis 2020 to 2024 and Forecast 2025 to 2035, By Packaging
    • Introduction / Key Findings
    • Historical Market Size Value (USD Million) Analysis By Packaging, 2020 to 2024
    • Current and Future Market Size Value (USD Million) Analysis and Forecast By Packaging, 2025 to 2035
      • Drums
      • Totes
    • Y-o-Y Growth Trend Analysis By Packaging, 2020 to 2024
    • Absolute $ Opportunity Analysis By Packaging, 2025 to 2035
  12. Global Market Analysis 2020 to 2024 and Forecast 2025 to 2035, By Region
    • Introduction
    • Historical Market Size Value (USD Million) Analysis By Region, 2020 to 2024
    • Current Market Size Value (USD Million) Analysis and Forecast By Region, 2025 to 2035
      • North America
      • Latin America
      • Western Europe
      • Eastern Europe
      • East Asia
      • South Asia and Pacific
      • Middle East & Africa
    • Market Attractiveness Analysis By Region
  13. North America Market Analysis 2020 to 2024 and Forecast 2025 to 2035, By Country
    • Historical Market Size Value (USD Million) Trend Analysis By Market Taxonomy, 2020 to 2024
    • Market Size Value (USD Million) Forecast By Market Taxonomy, 2025 to 2035
      • By Country
        • USA
        • Canada
        • Mexico
      • By Form
      • By Source
      • By Type
      • By Concentration
      • By End Use
      • By Packaging
    • Market Attractiveness Analysis
      • By Country
      • By Form
      • By Source
      • By Type
      • By Concentration
      • By End Use
      • By Packaging
    • Key Takeaways
  14. Latin America Market Analysis 2020 to 2024 and Forecast 2025 to 2035, By Country
    • Historical Market Size Value (USD Million) Trend Analysis By Market Taxonomy, 2020 to 2024
    • Market Size Value (USD Million) Forecast By Market Taxonomy, 2025 to 2035
      • By Country
        • Brazil
        • Chile
        • Rest of Latin America
      • By Form
      • By Source
      • By Type
      • By Concentration
      • By End Use
      • By Packaging
    • Market Attractiveness Analysis
      • By Country
      • By Form
      • By Source
      • By Type
      • By Concentration
      • By End Use
      • By Packaging
    • Key Takeaways
  15. Western Europe Market Analysis 2020 to 2024 and Forecast 2025 to 2035, By Country
    • Historical Market Size Value (USD Million) Trend Analysis By Market Taxonomy, 2020 to 2024
    • Market Size Value (USD Million) Forecast By Market Taxonomy, 2025 to 2035
      • By Country
        • Germany
        • UK
        • Italy
        • Spain
        • France
        • Nordic
        • BENELUX
        • Rest of Western Europe
      • By Form
      • By Source
      • By Type
      • By Concentration
      • By End Use
      • By Packaging
    • Market Attractiveness Analysis
      • By Country
      • By Form
      • By Source
      • By Type
      • By Concentration
      • By End Use
      • By Packaging
    • Key Takeaways
  16. Eastern Europe Market Analysis 2020 to 2024 and Forecast 2025 to 2035, By Country
    • Historical Market Size Value (USD Million) Trend Analysis By Market Taxonomy, 2020 to 2024
    • Market Size Value (USD Million) Forecast By Market Taxonomy, 2025 to 2035
      • By Country
        • Russia
        • Poland
        • Hungary
        • Balkan & Baltic
        • Rest of Eastern Europe
      • By Form
      • By Source
      • By Type
      • By Concentration
      • By End Use
      • By Packaging
    • Market Attractiveness Analysis
      • By Country
      • By Form
      • By Source
      • By Type
      • By Concentration
      • By End Use
      • By Packaging
    • Key Takeaways
  17. East Asia Market Analysis 2020 to 2024 and Forecast 2025 to 2035, By Country
    • Historical Market Size Value (USD Million) Trend Analysis By Market Taxonomy, 2020 to 2024
    • Market Size Value (USD Million) Forecast By Market Taxonomy, 2025 to 2035
      • By Country
        • China
        • Japan
        • South Korea
      • By Form
      • By Source
      • By Type
      • By Concentration
      • By End Use
      • By Packaging
    • Market Attractiveness Analysis
      • By Country
      • By Form
      • By Source
      • By Type
      • By Concentration
      • By End Use
      • By Packaging
    • Key Takeaways
  18. South Asia and Pacific Market Analysis 2020 to 2024 and Forecast 2025 to 2035, By Country
    • Historical Market Size Value (USD Million) Trend Analysis By Market Taxonomy, 2020 to 2024
    • Market Size Value (USD Million) Forecast By Market Taxonomy, 2025 to 2035
      • By Country
        • India
        • ASEAN
        • Australia & New Zealand
        • Rest of South Asia and Pacific
      • By Form
      • By Source
      • By Type
      • By Concentration
      • By End Use
      • By Packaging
    • Market Attractiveness Analysis
      • By Country
      • By Form
      • By Source
      • By Type
      • By Concentration
      • By End Use
      • By Packaging
    • Key Takeaways
  19. Middle East & Africa Market Analysis 2020 to 2024 and Forecast 2025 to 2035, By Country
    • Historical Market Size Value (USD Million) Trend Analysis By Market Taxonomy, 2020 to 2024
    • Market Size Value (USD Million) Forecast By Market Taxonomy, 2025 to 2035
      • By Country
        • Kingdom of Saudi Arabia
        • Other GCC Countries
        • Turkiye
        • South Africa
        • Other African Union
        • Rest of Middle East & Africa
      • By Form
      • By Source
      • By Type
      • By Concentration
      • By End Use
      • By Packaging
    • Market Attractiveness Analysis
      • By Country
      • By Form
      • By Source
      • By Type
      • By Concentration
      • By End Use
      • By Packaging
    • Key Takeaways
  20. Key Countries Market Analysis
    • USA
      • Pricing Analysis
      • Market Share Analysis, 2024
        • By Form
        • By Source
        • By Type
        • By Concentration
        • By End Use
        • By Packaging
    • Canada
      • Pricing Analysis
      • Market Share Analysis, 2024
        • By Form
        • By Source
        • By Type
        • By Concentration
        • By End Use
        • By Packaging
    • Mexico
      • Pricing Analysis
      • Market Share Analysis, 2024
        • By Form
        • By Source
        • By Type
        • By Concentration
        • By End Use
        • By Packaging
    • Brazil
      • Pricing Analysis
      • Market Share Analysis, 2024
        • By Form
        • By Source
        • By Type
        • By Concentration
        • By End Use
        • By Packaging
    • Chile
      • Pricing Analysis
      • Market Share Analysis, 2024
        • By Form
        • By Source
        • By Type
        • By Concentration
        • By End Use
        • By Packaging
    • Germany
      • Pricing Analysis
      • Market Share Analysis, 2024
        • By Form
        • By Source
        • By Type
        • By Concentration
        • By End Use
        • By Packaging
    • UK
      • Pricing Analysis
      • Market Share Analysis, 2024
        • By Form
        • By Source
        • By Type
        • By Concentration
        • By End Use
        • By Packaging
    • Italy
      • Pricing Analysis
      • Market Share Analysis, 2024
        • By Form
        • By Source
        • By Type
        • By Concentration
        • By End Use
        • By Packaging
    • Spain
      • Pricing Analysis
      • Market Share Analysis, 2024
        • By Form
        • By Source
        • By Type
        • By Concentration
        • By End Use
        • By Packaging
    • France
      • Pricing Analysis
      • Market Share Analysis, 2024
        • By Form
        • By Source
        • By Type
        • By Concentration
        • By End Use
        • By Packaging
    • India
      • Pricing Analysis
      • Market Share Analysis, 2024
        • By Form
        • By Source
        • By Type
        • By Concentration
        • By End Use
        • By Packaging
    • ASEAN
      • Pricing Analysis
      • Market Share Analysis, 2024
        • By Form
        • By Source
        • By Type
        • By Concentration
        • By End Use
        • By Packaging
    • Australia & New Zealand
      • Pricing Analysis
      • Market Share Analysis, 2024
        • By Form
        • By Source
        • By Type
        • By Concentration
        • By End Use
        • By Packaging
    • China
      • Pricing Analysis
      • Market Share Analysis, 2024
        • By Form
        • By Source
        • By Type
        • By Concentration
        • By End Use
        • By Packaging
    • Japan
      • Pricing Analysis
      • Market Share Analysis, 2024
        • By Form
        • By Source
        • By Type
        • By Concentration
        • By End Use
        • By Packaging
    • South Korea
      • Pricing Analysis
      • Market Share Analysis, 2024
        • By Form
        • By Source
        • By Type
        • By Concentration
        • By End Use
        • By Packaging
    • Russia
      • Pricing Analysis
      • Market Share Analysis, 2024
        • By Form
        • By Source
        • By Type
        • By Concentration
        • By End Use
        • By Packaging
    • Poland
      • Pricing Analysis
      • Market Share Analysis, 2024
        • By Form
        • By Source
        • By Type
        • By Concentration
        • By End Use
        • By Packaging
    • Hungary
      • Pricing Analysis
      • Market Share Analysis, 2024
        • By Form
        • By Source
        • By Type
        • By Concentration
        • By End Use
        • By Packaging
    • Kingdom of Saudi Arabia
      • Pricing Analysis
      • Market Share Analysis, 2024
        • By Form
        • By Source
        • By Type
        • By Concentration
        • By End Use
        • By Packaging
    • Turkiye
      • Pricing Analysis
      • Market Share Analysis, 2024
        • By Form
        • By Source
        • By Type
        • By Concentration
        • By End Use
        • By Packaging
    • South Africa
      • Pricing Analysis
      • Market Share Analysis, 2024
        • By Form
        • By Source
        • By Type
        • By Concentration
        • By End Use
        • By Packaging
  21. Market Structure Analysis
    • Competition Dashboard
    • Competition Benchmarking
    • Market Share Analysis of Top Players
      • By Regional
      • By Form
      • By Source
      • By Type
      • By Concentration
      • By End Use
      • By Packaging
  22. Competition Analysis
    • Competition Deep Dive
      • DSM
        • Overview
        • Product Portfolio
        • Profitability by Market Segments (Product/Age /Sales Channel/Region)
        • Sales Footprint
        • Strategy Overview
          • Marketing Strategy
          • Product Strategy
          • Channel Strategy
      • Australian Omega Oils Pty. Ltd.
      • BASF SE
      • Epax
      • GC Rieber (VivoMega)
      • AlaskOmega
      • Norwegian Fish Oil
      • Nordic Naturals
      • Golden Omega
      • ADM
      • KD Pharma Group
      • Corbion
      • Orkla Health
      • Olvea Omega Solutions
  23. Assumptions & Acronyms Used
  24. Research Methodology

List of Tables

  • Table 1: Global Market Value (USD Million) Forecast by Region, 2020-2035
  • Table 2: Global Market Value (USD Million) Forecast by Form , 2020-2035
  • Table 3: Global Market Value (USD Million) Forecast by Source, 2020-2035
  • Table 4: Global Market Value (USD Million) Forecast by Type, 2020-2035
  • Table 5: Global Market Value (USD Million) Forecast by Concentration, 2020-2035
  • Table 6: Global Market Value (USD Million) Forecast by End Use, 2020-2035
  • Table 7: Global Market Value (USD Million) Forecast by Packaging, 2020-2035
  • Table 8: North America Market Value (USD Million) Forecast by Country, 2020-2035
  • Table 9: North America Market Value (USD Million) Forecast by Form , 2020-2035
  • Table 10: North America Market Value (USD Million) Forecast by Source, 2020-2035
  • Table 11: North America Market Value (USD Million) Forecast by Type, 2020-2035
  • Table 12: North America Market Value (USD Million) Forecast by Concentration, 2020-2035
  • Table 13: North America Market Value (USD Million) Forecast by End Use, 2020-2035
  • Table 14: North America Market Value (USD Million) Forecast by Packaging, 2020-2035
  • Table 15: Latin America Market Value (USD Million) Forecast by Country, 2020-2035
  • Table 16: Latin America Market Value (USD Million) Forecast by Form , 2020-2035
  • Table 17: Latin America Market Value (USD Million) Forecast by Source, 2020-2035
  • Table 18: Latin America Market Value (USD Million) Forecast by Type, 2020-2035
  • Table 19: Latin America Market Value (USD Million) Forecast by Concentration, 2020-2035
  • Table 20: Latin America Market Value (USD Million) Forecast by End Use, 2020-2035
  • Table 21: Latin America Market Value (USD Million) Forecast by Packaging, 2020-2035
  • Table 22: Western Europe Market Value (USD Million) Forecast by Country, 2020-2035
  • Table 23: Western Europe Market Value (USD Million) Forecast by Form , 2020-2035
  • Table 24: Western Europe Market Value (USD Million) Forecast by Source, 2020-2035
  • Table 25: Western Europe Market Value (USD Million) Forecast by Type, 2020-2035
  • Table 26: Western Europe Market Value (USD Million) Forecast by Concentration, 2020-2035
  • Table 27: Western Europe Market Value (USD Million) Forecast by End Use, 2020-2035
  • Table 28: Western Europe Market Value (USD Million) Forecast by Packaging, 2020-2035
  • Table 29: Eastern Europe Market Value (USD Million) Forecast by Country, 2020-2035
  • Table 30: Eastern Europe Market Value (USD Million) Forecast by Form , 2020-2035
  • Table 31: Eastern Europe Market Value (USD Million) Forecast by Source, 2020-2035
  • Table 32: Eastern Europe Market Value (USD Million) Forecast by Type, 2020-2035
  • Table 33: Eastern Europe Market Value (USD Million) Forecast by Concentration, 2020-2035
  • Table 34: Eastern Europe Market Value (USD Million) Forecast by End Use, 2020-2035
  • Table 35: Eastern Europe Market Value (USD Million) Forecast by Packaging, 2020-2035
  • Table 36: East Asia Market Value (USD Million) Forecast by Country, 2020-2035
  • Table 37: East Asia Market Value (USD Million) Forecast by Form , 2020-2035
  • Table 38: East Asia Market Value (USD Million) Forecast by Source, 2020-2035
  • Table 39: East Asia Market Value (USD Million) Forecast by Type, 2020-2035
  • Table 40: East Asia Market Value (USD Million) Forecast by Concentration, 2020-2035
  • Table 41: East Asia Market Value (USD Million) Forecast by End Use, 2020-2035
  • Table 42: East Asia Market Value (USD Million) Forecast by Packaging, 2020-2035
  • Table 43: South Asia and Pacific Market Value (USD Million) Forecast by Country, 2020-2035
  • Table 44: South Asia and Pacific Market Value (USD Million) Forecast by Form , 2020-2035
  • Table 45: South Asia and Pacific Market Value (USD Million) Forecast by Source, 2020-2035
  • Table 46: South Asia and Pacific Market Value (USD Million) Forecast by Type, 2020-2035
  • Table 47: South Asia and Pacific Market Value (USD Million) Forecast by Concentration, 2020-2035
  • Table 48: South Asia and Pacific Market Value (USD Million) Forecast by End Use, 2020-2035
  • Table 49: South Asia and Pacific Market Value (USD Million) Forecast by Packaging, 2020-2035
  • Table 50: Middle East & Africa Market Value (USD Million) Forecast by Country, 2020-2035
  • Table 51: Middle East & Africa Market Value (USD Million) Forecast by Form , 2020-2035
  • Table 52: Middle East & Africa Market Value (USD Million) Forecast by Source, 2020-2035
  • Table 53: Middle East & Africa Market Value (USD Million) Forecast by Type, 2020-2035
  • Table 54: Middle East & Africa Market Value (USD Million) Forecast by Concentration, 2020-2035
  • Table 55: Middle East & Africa Market Value (USD Million) Forecast by End Use, 2020-2035
  • Table 56: Middle East & Africa Market Value (USD Million) Forecast by Packaging, 2020-2035

List of Figures

  • Figure 1: Global Market Pricing Analysis
  • Figure 2: Global Market Value (USD Million) Forecast 2020-2035
  • Figure 3: Global Market Value Share and BPS Analysis by Form , 2025 and 2035
  • Figure 4: Global Market Y-o-Y Growth Comparison by Form , 2025-2035
  • Figure 5: Global Market Attractiveness Analysis by Form
  • Figure 6: Global Market Value Share and BPS Analysis by Source, 2025 and 2035
  • Figure 7: Global Market Y-o-Y Growth Comparison by Source, 2025-2035
  • Figure 8: Global Market Attractiveness Analysis by Source
  • Figure 9: Global Market Value Share and BPS Analysis by Type, 2025 and 2035
  • Figure 10: Global Market Y-o-Y Growth Comparison by Type, 2025-2035
  • Figure 11: Global Market Attractiveness Analysis by Type
  • Figure 12: Global Market Value Share and BPS Analysis by Concentration, 2025 and 2035
  • Figure 13: Global Market Y-o-Y Growth Comparison by Concentration, 2025-2035
  • Figure 14: Global Market Attractiveness Analysis by Concentration
  • Figure 15: Global Market Value Share and BPS Analysis by End Use, 2025 and 2035
  • Figure 16: Global Market Y-o-Y Growth Comparison by End Use, 2025-2035
  • Figure 17: Global Market Attractiveness Analysis by End Use
  • Figure 18: Global Market Value Share and BPS Analysis by Packaging, 2025 and 2035
  • Figure 19: Global Market Y-o-Y Growth Comparison by Packaging, 2025-2035
  • Figure 20: Global Market Attractiveness Analysis by Packaging
  • Figure 21: Global Market Value (USD Million) Share and BPS Analysis by Region, 2025 and 2035
  • Figure 22: Global Market Y-o-Y Growth Comparison by Region, 2025-2035
  • Figure 23: Global Market Attractiveness Analysis by Region
  • Figure 24: North America Market Incremental Dollar Opportunity, 2025-2035
  • Figure 25: Latin America Market Incremental Dollar Opportunity, 2025-2035
  • Figure 26: Western Europe Market Incremental Dollar Opportunity, 2025-2035
  • Figure 27: Eastern Europe Market Incremental Dollar Opportunity, 2025-2035
  • Figure 28: East Asia Market Incremental Dollar Opportunity, 2025-2035
  • Figure 29: South Asia and Pacific Market Incremental Dollar Opportunity, 2025-2035
  • Figure 30: Middle East & Africa Market Incremental Dollar Opportunity, 2025-2035
  • Figure 31: North America Market Value Share and BPS Analysis by Country, 2025 and 2035
  • Figure 32: North America Market Value Share and BPS Analysis by Form , 2025 and 2035
  • Figure 33: North America Market Y-o-Y Growth Comparison by Form , 2025-2035
  • Figure 34: North America Market Attractiveness Analysis by Form
  • Figure 35: North America Market Value Share and BPS Analysis by Source, 2025 and 2035
  • Figure 36: North America Market Y-o-Y Growth Comparison by Source, 2025-2035
  • Figure 37: North America Market Attractiveness Analysis by Source
  • Figure 38: North America Market Value Share and BPS Analysis by Type, 2025 and 2035
  • Figure 39: North America Market Y-o-Y Growth Comparison by Type, 2025-2035
  • Figure 40: North America Market Attractiveness Analysis by Type
  • Figure 41: North America Market Value Share and BPS Analysis by Concentration, 2025 and 2035
  • Figure 42: North America Market Y-o-Y Growth Comparison by Concentration, 2025-2035
  • Figure 43: North America Market Attractiveness Analysis by Concentration
  • Figure 44: North America Market Value Share and BPS Analysis by End Use, 2025 and 2035
  • Figure 45: North America Market Y-o-Y Growth Comparison by End Use, 2025-2035
  • Figure 46: North America Market Attractiveness Analysis by End Use
  • Figure 47: North America Market Value Share and BPS Analysis by Packaging, 2025 and 2035
  • Figure 48: North America Market Y-o-Y Growth Comparison by Packaging, 2025-2035
  • Figure 49: North America Market Attractiveness Analysis by Packaging
  • Figure 50: Latin America Market Value Share and BPS Analysis by Country, 2025 and 2035
  • Figure 51: Latin America Market Value Share and BPS Analysis by Form , 2025 and 2035
  • Figure 52: Latin America Market Y-o-Y Growth Comparison by Form , 2025-2035
  • Figure 53: Latin America Market Attractiveness Analysis by Form
  • Figure 54: Latin America Market Value Share and BPS Analysis by Source, 2025 and 2035
  • Figure 55: Latin America Market Y-o-Y Growth Comparison by Source, 2025-2035
  • Figure 56: Latin America Market Attractiveness Analysis by Source
  • Figure 57: Latin America Market Value Share and BPS Analysis by Type, 2025 and 2035
  • Figure 58: Latin America Market Y-o-Y Growth Comparison by Type, 2025-2035
  • Figure 59: Latin America Market Attractiveness Analysis by Type
  • Figure 60: Latin America Market Value Share and BPS Analysis by Concentration, 2025 and 2035
  • Figure 61: Latin America Market Y-o-Y Growth Comparison by Concentration, 2025-2035
  • Figure 62: Latin America Market Attractiveness Analysis by Concentration
  • Figure 63: Latin America Market Value Share and BPS Analysis by End Use, 2025 and 2035
  • Figure 64: Latin America Market Y-o-Y Growth Comparison by End Use, 2025-2035
  • Figure 65: Latin America Market Attractiveness Analysis by End Use
  • Figure 66: Latin America Market Value Share and BPS Analysis by Packaging, 2025 and 2035
  • Figure 67: Latin America Market Y-o-Y Growth Comparison by Packaging, 2025-2035
  • Figure 68: Latin America Market Attractiveness Analysis by Packaging
  • Figure 69: Western Europe Market Value Share and BPS Analysis by Country, 2025 and 2035
  • Figure 70: Western Europe Market Value Share and BPS Analysis by Form , 2025 and 2035
  • Figure 71: Western Europe Market Y-o-Y Growth Comparison by Form , 2025-2035
  • Figure 72: Western Europe Market Attractiveness Analysis by Form
  • Figure 73: Western Europe Market Value Share and BPS Analysis by Source, 2025 and 2035
  • Figure 74: Western Europe Market Y-o-Y Growth Comparison by Source, 2025-2035
  • Figure 75: Western Europe Market Attractiveness Analysis by Source
  • Figure 76: Western Europe Market Value Share and BPS Analysis by Type, 2025 and 2035
  • Figure 77: Western Europe Market Y-o-Y Growth Comparison by Type, 2025-2035
  • Figure 78: Western Europe Market Attractiveness Analysis by Type
  • Figure 79: Western Europe Market Value Share and BPS Analysis by Concentration, 2025 and 2035
  • Figure 80: Western Europe Market Y-o-Y Growth Comparison by Concentration, 2025-2035
  • Figure 81: Western Europe Market Attractiveness Analysis by Concentration
  • Figure 82: Western Europe Market Value Share and BPS Analysis by End Use, 2025 and 2035
  • Figure 83: Western Europe Market Y-o-Y Growth Comparison by End Use, 2025-2035
  • Figure 84: Western Europe Market Attractiveness Analysis by End Use
  • Figure 85: Western Europe Market Value Share and BPS Analysis by Packaging, 2025 and 2035
  • Figure 86: Western Europe Market Y-o-Y Growth Comparison by Packaging, 2025-2035
  • Figure 87: Western Europe Market Attractiveness Analysis by Packaging
  • Figure 88: Eastern Europe Market Value Share and BPS Analysis by Country, 2025 and 2035
  • Figure 89: Eastern Europe Market Value Share and BPS Analysis by Form , 2025 and 2035
  • Figure 90: Eastern Europe Market Y-o-Y Growth Comparison by Form , 2025-2035
  • Figure 91: Eastern Europe Market Attractiveness Analysis by Form
  • Figure 92: Eastern Europe Market Value Share and BPS Analysis by Source, 2025 and 2035
  • Figure 93: Eastern Europe Market Y-o-Y Growth Comparison by Source, 2025-2035
  • Figure 94: Eastern Europe Market Attractiveness Analysis by Source
  • Figure 95: Eastern Europe Market Value Share and BPS Analysis by Type, 2025 and 2035
  • Figure 96: Eastern Europe Market Y-o-Y Growth Comparison by Type, 2025-2035
  • Figure 97: Eastern Europe Market Attractiveness Analysis by Type
  • Figure 98: Eastern Europe Market Value Share and BPS Analysis by Concentration, 2025 and 2035
  • Figure 99: Eastern Europe Market Y-o-Y Growth Comparison by Concentration, 2025-2035
  • Figure 100: Eastern Europe Market Attractiveness Analysis by Concentration
  • Figure 101: Eastern Europe Market Value Share and BPS Analysis by End Use, 2025 and 2035
  • Figure 102: Eastern Europe Market Y-o-Y Growth Comparison by End Use, 2025-2035
  • Figure 103: Eastern Europe Market Attractiveness Analysis by End Use
  • Figure 104: Eastern Europe Market Value Share and BPS Analysis by Packaging, 2025 and 2035
  • Figure 105: Eastern Europe Market Y-o-Y Growth Comparison by Packaging, 2025-2035
  • Figure 106: Eastern Europe Market Attractiveness Analysis by Packaging
  • Figure 107: East Asia Market Value Share and BPS Analysis by Country, 2025 and 2035
  • Figure 108: East Asia Market Value Share and BPS Analysis by Form , 2025 and 2035
  • Figure 109: East Asia Market Y-o-Y Growth Comparison by Form , 2025-2035
  • Figure 110: East Asia Market Attractiveness Analysis by Form
  • Figure 111: East Asia Market Value Share and BPS Analysis by Source, 2025 and 2035
  • Figure 112: East Asia Market Y-o-Y Growth Comparison by Source, 2025-2035
  • Figure 113: East Asia Market Attractiveness Analysis by Source
  • Figure 114: East Asia Market Value Share and BPS Analysis by Type, 2025 and 2035
  • Figure 115: East Asia Market Y-o-Y Growth Comparison by Type, 2025-2035
  • Figure 116: East Asia Market Attractiveness Analysis by Type
  • Figure 117: East Asia Market Value Share and BPS Analysis by Concentration, 2025 and 2035
  • Figure 118: East Asia Market Y-o-Y Growth Comparison by Concentration, 2025-2035
  • Figure 119: East Asia Market Attractiveness Analysis by Concentration
  • Figure 120: East Asia Market Value Share and BPS Analysis by End Use, 2025 and 2035
  • Figure 121: East Asia Market Y-o-Y Growth Comparison by End Use, 2025-2035
  • Figure 122: East Asia Market Attractiveness Analysis by End Use
  • Figure 123: East Asia Market Value Share and BPS Analysis by Packaging, 2025 and 2035
  • Figure 124: East Asia Market Y-o-Y Growth Comparison by Packaging, 2025-2035
  • Figure 125: East Asia Market Attractiveness Analysis by Packaging
  • Figure 126: South Asia and Pacific Market Value Share and BPS Analysis by Country, 2025 and 2035
  • Figure 127: South Asia and Pacific Market Value Share and BPS Analysis by Form , 2025 and 2035
  • Figure 128: South Asia and Pacific Market Y-o-Y Growth Comparison by Form , 2025-2035
  • Figure 129: South Asia and Pacific Market Attractiveness Analysis by Form
  • Figure 130: South Asia and Pacific Market Value Share and BPS Analysis by Source, 2025 and 2035
  • Figure 131: South Asia and Pacific Market Y-o-Y Growth Comparison by Source, 2025-2035
  • Figure 132: South Asia and Pacific Market Attractiveness Analysis by Source
  • Figure 133: South Asia and Pacific Market Value Share and BPS Analysis by Type, 2025 and 2035
  • Figure 134: South Asia and Pacific Market Y-o-Y Growth Comparison by Type, 2025-2035
  • Figure 135: South Asia and Pacific Market Attractiveness Analysis by Type
  • Figure 136: South Asia and Pacific Market Value Share and BPS Analysis by Concentration, 2025 and 2035
  • Figure 137: South Asia and Pacific Market Y-o-Y Growth Comparison by Concentration, 2025-2035
  • Figure 138: South Asia and Pacific Market Attractiveness Analysis by Concentration
  • Figure 139: South Asia and Pacific Market Value Share and BPS Analysis by End Use, 2025 and 2035
  • Figure 140: South Asia and Pacific Market Y-o-Y Growth Comparison by End Use, 2025-2035
  • Figure 141: South Asia and Pacific Market Attractiveness Analysis by End Use
  • Figure 142: South Asia and Pacific Market Value Share and BPS Analysis by Packaging, 2025 and 2035
  • Figure 143: South Asia and Pacific Market Y-o-Y Growth Comparison by Packaging, 2025-2035
  • Figure 144: South Asia and Pacific Market Attractiveness Analysis by Packaging
  • Figure 145: Middle East & Africa Market Value Share and BPS Analysis by Country, 2025 and 2035
  • Figure 146: Middle East & Africa Market Value Share and BPS Analysis by Form , 2025 and 2035
  • Figure 147: Middle East & Africa Market Y-o-Y Growth Comparison by Form , 2025-2035
  • Figure 148: Middle East & Africa Market Attractiveness Analysis by Form
  • Figure 149: Middle East & Africa Market Value Share and BPS Analysis by Source, 2025 and 2035
  • Figure 150: Middle East & Africa Market Y-o-Y Growth Comparison by Source, 2025-2035
  • Figure 151: Middle East & Africa Market Attractiveness Analysis by Source
  • Figure 152: Middle East & Africa Market Value Share and BPS Analysis by Type, 2025 and 2035
  • Figure 153: Middle East & Africa Market Y-o-Y Growth Comparison by Type, 2025-2035
  • Figure 154: Middle East & Africa Market Attractiveness Analysis by Type
  • Figure 155: Middle East & Africa Market Value Share and BPS Analysis by Concentration, 2025 and 2035
  • Figure 156: Middle East & Africa Market Y-o-Y Growth Comparison by Concentration, 2025-2035
  • Figure 157: Middle East & Africa Market Attractiveness Analysis by Concentration
  • Figure 158: Middle East & Africa Market Value Share and BPS Analysis by End Use, 2025 and 2035
  • Figure 159: Middle East & Africa Market Y-o-Y Growth Comparison by End Use, 2025-2035
  • Figure 160: Middle East & Africa Market Attractiveness Analysis by End Use
  • Figure 161: Middle East & Africa Market Value Share and BPS Analysis by Packaging, 2025 and 2035
  • Figure 162: Middle East & Africa Market Y-o-Y Growth Comparison by Packaging, 2025-2035
  • Figure 163: Middle East & Africa Market Attractiveness Analysis by Packaging
  • Figure 164: Global Market - Tier Structure Analysis
  • Figure 165: Global Market - Company Share Analysis
Dashboard
Dashboard
Dashboard
Dashboard
Dashboard
Dashboard

Full Research Suite comprises of:

Market outlook & trends analysis

Market outlook & trends analysis

Interviews & case studies

Interviews & case studies

Strategic recommendations

Strategic recommendations

Vendor profiles & capabilities analysis

Vendor profiles & capabilities analysis

5-year forecasts

5-year forecasts

8 regions and 60+ country-level data splits

8 regions and 60+ country-level data splits

Market segment data splits

Market segment data splits

12 months of continuous data updates

12 months of continuous data updates

DELIVERED AS:

PDF EXCEL ONLINE

Full Research Suite


$3500

$5000

$6500

Buy Report Now
Similar Industry Reports

Similar Industry Reports

USA Omega-3 Concentrates Market

USA Omega-3 Concentrates Market Report – Trends, Demand & Outlook 2025-2035

Europe Omega-3 Concentrates Market

Europe Omega-3 Concentrates Market Insights – Growth, Demand & Forecast 2025-2035

Color Concentrates Market

Color Concentrates Market

Cheese Concentrates Market

Cheese Concentrates Market Size and Share Forecast Outlook 2025 to 2035

Ketchup Concentrates Market

Ketchup Concentrates Market Analysis by Nature, Product Type, Distribution Channel and Region through 2035

Fragrance Concentrates Market

Fragrance Concentrates Market Size and Share Forecast Outlook 2025 to 2035

Vegetable Concentrates Market

Vegetable Concentrates Market Growth - Nutrient-Dense Foods & Industry Demand 2025 to 2035

Soft Drinks Concentrates Market

Soft Drinks Concentrates Market Trends - Growth & Forecast

Emulsifiable Concentrates Market

Emulsifiable Concentrates Market Size, Growth, and Forecast 2025 to 2035

Dialysis Device and Concentrates Market

Dialysis Device and Concentrates Market Growth - Trends & Forecast 2025 to 2035

Prothrombin Complex Concentrates Market

Prothrombin Complex Concentrates Market Trends and Forecast 2025 to 2035

Enzyme-Enabled Cold-Brew Concentrates Market

Enzyme-Enabled Cold-Brew Concentrates Market Analysis - Size, Share, and Forecast Outlook 2025 to 2035

Dialyzer Reprocessing Machines and Concentrates Market

Dialyzer Reprocessing Machines and Concentrates Market and Forecast Outlook 2025 to 2035

Future Market Insights

Omega-3 Concentrates Market

Chat With MaRIA

Chat With

MaRIA

Hi There, I am MaRIA, Your Market Research Intelligence Assistant. How may I help you?