OTC Appetite Suppressant Market Size, Share, and Forecast Outlook 2025 to 2035

Global OTC appetite suppressant market is expected to grow from USD 16.1billion in 2025 to USD 34.4 billion by 2035, advancing at a 7.9% CAGR. This expansion is being shaped by demand among overweight adults seeking non-prescription alternatives to GLP-1 medications.

Nearly 63% of volume is concentrated in capsule and gummy formats containing stimulant-free botanicals, fiber bulking agents, or carb-blocker blends. Retailers are expanding shelf space for mood-balancing and satiety-enhancing SKUs, particularly in North America and Southeast Asia.

Private-label adoption is gaining traction as pharmacies shift toward in-house brands to improve margin control. Success now depends on clinical claim substantiation, clean-label ingredient sourcing, and long-term appetite modulation efficacy.
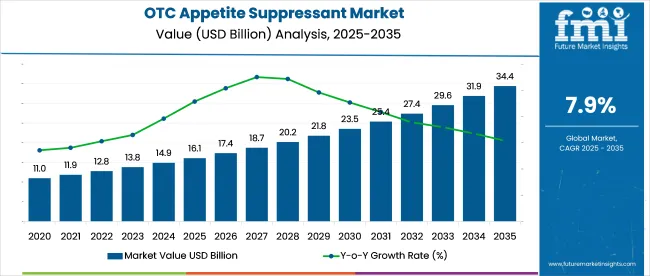
Quick Stats of the OTC Appetite Suppressant Market

  • Industry Value (2025): USD 16.1 billion
  • Forecast Value (2035): USD 34.4 billion
  • Global CAGR (2025 to 2035): 7.9%
  • Leading Segment in 2025: Plant-Based Extracts (~20.0% share)
  • Key Growth Region: South Asia & Pacific (India leading with 13.5% CAGR)
  • Key Players: Haleon Group, GNC Holdings, LLC, 1 Up Nutrition, NatureWise, NOW Foods, Nestlé USA, Bayer AG

OTC Appetite Suppressant Market   Market Value Analysis

On December 31, 2024, UK-based startup Elcella unveiled a twice-daily capsule described as a “natural Ozempic,” designed to stimulate appetite-reducing hormones PYY and GLP-1 in the colon. Unlike synthetic GLP-1 drugs, Elcella works by triggering the body’s own hormone response, aiming to suppress hunger and reduce calorie intake without common side effects like nausea or fatigue.

Clinical findings suggest a 13% reduction in caloric intake. “We differ from weight-loss drugs in that Elcella releases your own naturally occurring appetite-reducing hormones rather than replacing them with synthetic hormones,” said Madusha Peiris, founder and CEO of Elcella, to the Daily Mail.

The OTC appetite suppressant market represents a niche within its broader categories. It accounts for approximately 2-3% of the global over-the-counter drugs market, driven by consumer-led weight control. Within the weight management products segment, appetite suppressants hold a stronger position, contributing around 8-10% of sales.

In the dietary supplements market, their share stands at roughly 3-4%, focused on natural ingredients like fiber blends and thermogenic agents. They make up about 2–3% of the broader consumer health and wellness category. In the nutraceuticals market, appetite suppressants represent 4-5%, reflecting rising interest in functional food-derived weight control solutions.

Analyzing OTC Appetite Suppressant Market by Top Investment Segments

The OTC appetite suppressant industry is segmented by product type into plant-based extracts, synthetic compounds, and combination blends. Key applications include weight management, intermittent fasting, metabolic health support, and appetite control during diet cycles. Sales channels include e-commerce platforms, pharmacies, supermarkets, and wellness-focused specialty retailers.

Geographic analysis spans North America, Latin America, Western Europe, Eastern Europe, East Asia, South Asia & Pacific.
Plant-Based Extracts Capture Demand in Natural Appetite Control

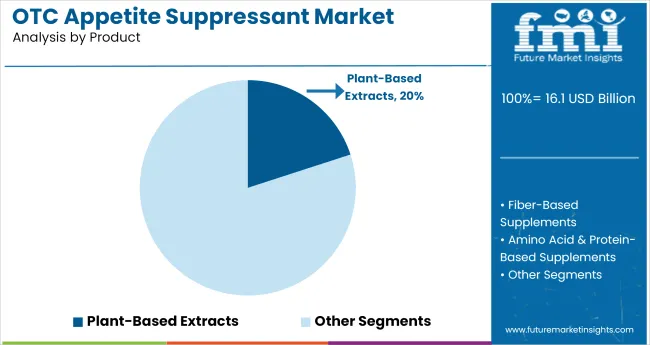
OTC Appetite Suppressant Market   Analysis By Product

Plant-based appetite suppressants are expected to account for 20.0% of industry share in 2025, driven by rising consumer preference for botanical compounds with minimal side effects and natural satiety support. These formulations are being adopted by individuals seeking stimulant-free appetite regulation with clean-label positioning.

Key actives such as glucomannan, garcinia cambogia, and green tea extract have been favored for their functional roles in pre-meal fullness and hunger control.

Unlike synthetic formulations, plant-based blends are being perceived as better tolerated during long-term use. Supplement brands have standardized dosages across capsules, powders, and gummies to maintain efficacy while supporting convenience and adherence.
  • NOW Foods scaled distribution of glucomannan capsules tailored for fullness enhancement.
  • Nature’s Way introduced garcinia-based formulas positioned for pre-meal satiety support.
  • HUM Nutrition promoted mood-linked plant suppressants integrated with adaptogens.

Intermittent Fasters Drive Niche Functional Use

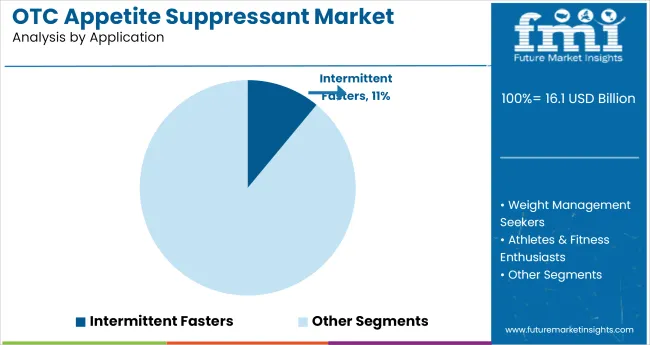
OTC Appetite Suppressant Market   Analysis By Application

Intermittent fasters are estimated to represent 11.0% of application demand in 2025, as appetite control becomes an integrated component of structured fasting and metabolic timing strategies. From 2020 to 2024, this user segment showed a marked increase in reliance on fasting-compatible suppressants that avoided insulin spikes or digestive triggers during fasting windows.

Delayed-release capsules and low-stimulant herbal formulations are being prioritized to assist with hunger during non-eating intervals. This demand has extended beyond conventional dieters and now includes time-restricted eaters and therapeutic fasters seeking product alignment with specific regimens like 16:8 or 20:4.
  • Goli Nutrition introduced ACV-based appetite formulas for time-restricted eating cycles.
  • Inno Supps released stimulant-free suppressants geared toward 16:8 and 20:4 protocols.
  • RSP Nutrition positioned capsule-based suppressants as fasting aids within keto product bundles.

E-Commerce Becomes Primary Sales Channel

OTC Appetite Suppressant Market   Analysis By Sales Channel

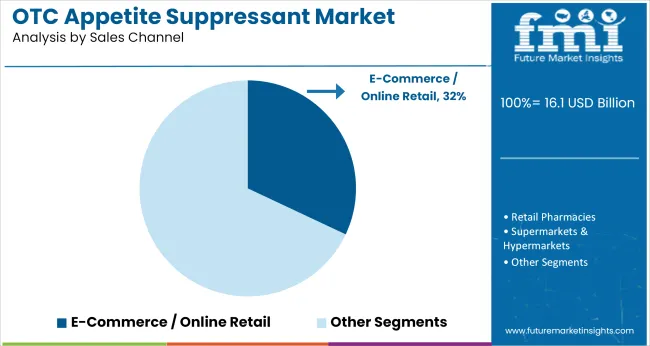
E-commerce and online retail channels are anticipated to generate 32.0% of OTC appetite suppressant sales in 2025, supported by algorithm-driven personalization, convenience, and rising DTC brand penetration. Between 2020 and 2024, digital storefronts emerged as the most effective point-of-sale for appetite management products, enabling rapid inventory turnover and customized promoting funnels.

Online platforms are allowing brands to deliver direct-to-consumer bundles, subscription refills, and influencer-driven campaigns—all of which have amplified consumer engagement. Ingredient transparency, third-party reviews, and shipping guarantees have further solidified this channel’s credibility.

  • Hydroxycut scaled digital campaigns driving purchases through Amazon Prime promotions.
  • Transparent Labs optimized its own DTC site with bundling discounts for appetite-focused stacks.
  • Evlution Nutrition expanded its fasting-compatible suppressant line via targeted e-commerce funnels.

Top OTC Appetite Suppressant Market Dynamics

The OTC appetite suppressant market is experiencing growth driven by increasing obesity rates and advancements in supplement formulations. While the industry benefits from rising consumer demand for accessible weight management solutions, challenges related to product efficacy, regulatory oversight, and industry credibility persist. Addressing these issues is crucial for sustaining long-term industry growth.

Expansion Driven by Rising Obesity Rates and Health Trends

The OTC appetite suppressant market is experiencing significant growth, fueled by the rising obesity rates and increasing consumer demand for weight management solutions. As of 2024, nearly 40% of the global population is affected by obesity, driving the demand for accessible weight management tools.

Advancements in supplement formulations have resulted in products that effectively suppress appetite, leading to a 15% increase in consumer adoption. Additionally, the growing health and wellness trend is influencing purchasing behaviors, with 60% of consumers opting for OTC products to support their health goals.

  • Rising obesity rates affecting 40% of the global population are driving demand for weight management solutions, fueling growth.
  • Innovations in supplement formulations have improved the efficacy of appetite suppressants, contributing to a 15% increase in consumer adoption.
  • Health and wellness trends have led 60% of consumers to opt for OTC appetite suppressants.

Challenges Related to Efficacy and Regulatory Concerns

The OTC appetite suppressant sector faces several challenges. The efficacy of these products varies widely, with clinical studies showing that 30% of users report inconsistent results, leading to potential dissatisfaction. Regulatory oversight for dietary supplements is less stringent than for prescription medications, raising concerns about product quality and safety.

A recent survey revealed that 22% of consumers are wary of OTC products due to safety concerns, further compounded by the proliferation of unverified products. This has led to a 12% increase in consumer complaints related to product quality and safety issues in the past year.
  • Inconsistent efficacy of OTC appetite suppressants has been reported by 30% of users, affecting overall satisfaction and limiting potential.
  • Lack of stringent regulatory oversight compared to prescription medications raises safety concerns, with 22% of consumers expressing doubts about OTC product reliability.
  • Proliferation of unverified products has led to a 12% rise in consumer complaints, undermining industry trust and hindering growth.

Top Countries Launching, Regulating, Promoting, and Selling OTC Appetite Suppressants

OTC Appetite Suppressant Market   CAGR Analysis By Country

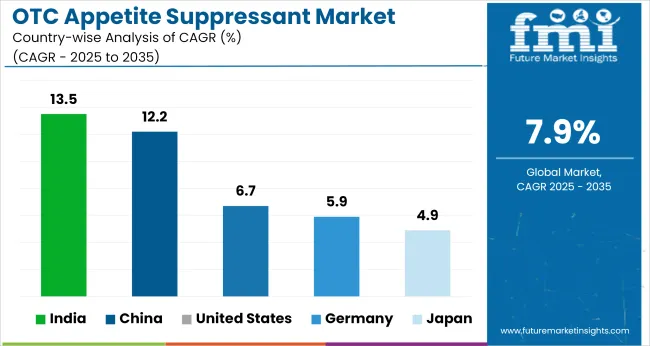
The global OTC appetite suppressant market is projected to expand at a 7.9% CAGR between 2025 and 2035. Among the 40+ countries analyzed, India leads with 13.5%, followed by China at 12.2%, both BRICS members benefiting from rising obesity concerns, expanded nutraceutical licensing, and growing online pharmacy adoption.

Indian firms are launching ayurvedic and herbal SKUs targeting younger urban consumers, while Chinese formulators are incorporating botanical actives like lotus leaf and puer tea into satiety formats.

The United States posts 6.7%, below the global average, reflecting FDA scrutiny and slower retail channel expansion. Germany follows at 5.9%, where EFSA claim limitations and pharmacy-only access is slowing product variety. Japan, at 4.9%, shows minimal appetite suppressant uptake due to cultural resistance and stronger preference for meal replacements.

Contrasts between BRICS and OECD countries highlight disparities in formulation freedom, claim permissibility, and platform penetration across regulated and semi-regulated OTC channels.

Countries CAGR (2025-2035)
United States 6.7%
Germany 5.9%
China 12.2%
Japan 4.9%
India 13.5%

Analysis of OTC appetite suppressant in the United States

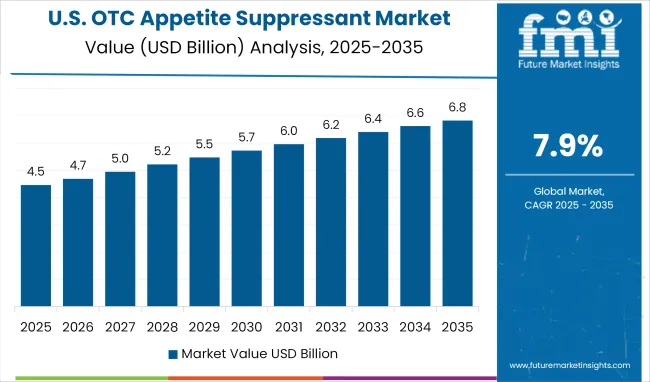
OTC Appetite Suppressant Market   Country Value Analysis

OTC appetite suppressant sales in the United States are projected to grow at a CAGR of 6.7% from 2025 to 2035. Rising demand for natural ingredients, combined with strong preference for self-managed weight control solutions, has supported this expansion. Plant-based and non-stimulant formulations have found growing favor across younger and middle-aged groups.

Product differentiation has been emphasized through branded capsules and gummies promoted for intermittent fasting and portion control. Regulatory clarity and a mature supplement ecosystem have allowed the segment to scale faster than in Asia-Pacific or Europe. OTC suppressants in the US are primarily positioned as part of lifestyle-driven nutrition regimens.

  • Plant-based, stimulant-free appetite suppressants are trending among US consumers.
  • Products targeting fasting cycles and portion moderation are being adopted.
  • Branded OTC formats are integrated with health-focused purchasing routines.

Demand forecast for OTC appetite suppressant in Germany

OTC appetite suppressant demand in Germany is expected to expand at a CAGR of 5.9% during the forecast period from 2025 to 2035. A shift in buyer behavior has occurred toward pharmacist-recommended or clinically backed products, supported by rising demand for controlled dietary support outside prescription frameworks.

German consumers prefer satiety-promoting blends with fiber and botanical actives, particularly in formats like sachets or slow-release tablets. Demand has grown in retail pharmacies and specialized health shops rather than mass e-commerce. European regulatory norms have shaped buyer trust around ingredients and dosage reliability.

  • Clinical efficacy and pharmacist trust have boosted category acceptance in Germany.
  • Botanical and fiber-based suppressants are leading in consumer preference.
  • Traditional retail dominates distribution over digital health platforms.

Growth analysis of OTC appetite suppressant in China

OTC appetite suppressant consumption in China is anticipated to grow at a CAGR of 12.2% between 2025 and 2035. Rising consumer experimentation with satiety aids has gained momentum, particularly in major cities. Appetite control supplements are being promoted in connection with beauty, fitness, and metabolic wellness trends.

China's online platforms and cross-border e-commerce have accelerated access to global appetite suppressant brands. Domestic producers have been developing herbal blends, often paired with probiotics or teas, to enhance gut-related fullness. User interest has outpaced Western countries in digital education around intermittent fasting and calorie moderation.

  • Appetite control is increasingly linked to fitness and beauty outcomes in China.
  • Digital platforms dominate sales, supported by influencer-based health content.
  • Herbal and probiotic combinations are shaping new consumer formats.

Future outlook for OTC appetite suppressant in Japan

OTC appetite suppressant sales in Japan are estimated to register a CAGR of 4.9% over the period from 2025 to 2035. Consumer choices have remained focused on minimal-intervention formulations, with appetite control perceived more as a lifestyle balance than a weight-loss strategy. Sales growth has been observed in formats such as konjac-derived satiety blends and green tea extract-based capsules.

Regulatory scrutiny remains high, with preference given to long-established Japanese brands over foreign entrants. The focus on natural functionality, low stimulant load, and simplicity in ingredients has influenced purchase patterns.

  • Appetite suppressants in Japan are aligned with subtle, health-preserving lifestyles.
  • Green tea and konjac-based products are core demand drivers.
  • Japanese buyers prefer local, time-tested supplements with low additive content.

OTC appetite suppressant growth outlook in India

OTC appetite suppressant demand in India is forecast to record a CAGR of 13.5% from 2025 to 2035. Awareness of self-managed dietary interventions has increased in metro regions, aided by digital wellness platforms and fitness influencers. Young adults have embraced herbal satiety boosters, such as garcinia and glucomannan, often consumed before meals or alongside intermittent fasting routines.

Adoption remains nascent in Tier II and rural zones but has been rising steadily due to e-commerce access and low-price sachet models. The segment remains fragmented, with ongoing standardization challenges.

  • Appetite control supplements are growing among young, fitness-aware Indians.
  • Herbal formulations are being adopted for fasting and pre-meal routines.
  • Product reach is expanding via sachet SKUs and online channels.

Leading Brands in OTC Appetite Suppressant Market

The OTC appetite suppressant market features a diverse mix of established nutraceutical firms, pharmaceutical players, and consumer health conglomerates. Haleon Group, Procter & Gamble, Nestlé USA, Unilever, and Bayer AG dominate retail visibility through branded fiber, stimulant-free, and metabolic regulation solutions distributed across pharmacies, mass retail, and e-commerce platforms.

Nature's Bounty, NOW Foods, and GNC Holdings, LLC operate at the intersection of supplementation and weight management, emphasizing fiber-based satiety and thermogenic actives.

Niche brands such as 1 Up Nutrition, NatureWise, Trim Healthy Mama, and Fiber Choice cater to specific demographics, including women, keto users, and natural-product consumers. The industry competitive intensity is shaped by digital-first wellness formats, strong influencer promoting, and demand for stimulant-free, GRAS-certified appetite regulation products.

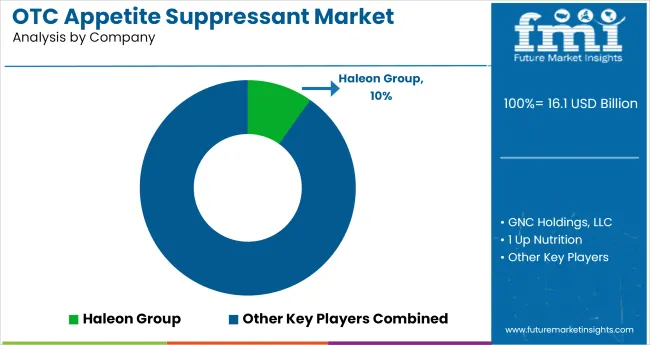
Leading Company – Haleon Group

Industry Share – 9.8%
OTC Appetite Suppressant Market   Analysis By Company

Recent Industry News

  • In December 2024, Nestlé USA launched BOOST® Pre‑Meal Hunger Support, a 10 g whey‑protein shot designed to stimulate natural GLP‑1 release and reduce pre-meal hunger.
  • In December 2024, UK researchers unveiled Elcella, a twice-daily capsule triggering GLP‑1 and PYY in the colon, showing 13% calorie reduction; US OTC availability expected in late 2025.

Report Scope

Report Attributes Details
Industry Size (2025) USD 16.1 billion
Projected Industry Size (2035) USD 34.4 billion
CAGR (2025 to 2035) 7.9%
Base Year for Estimation 2024
Historical Period

2020 to 2024

Projections Period 2025 to 2035
Quantitative Units USD billion for value and million units for volume
Product Types Analyzed (Segment 1) Plant-Based Extracts, Fiber-Based Supplements, Amino Acid and Protein-Based Supplements, Stimulant-Based Supplements, Hormonal/Neurotransmitter-Based Products, Combination Supplements, BHB Salts, L-Carnitine, Fat Absorption Inhibitors
Applications Analyzed (Segment 2) Weight Management Seekers, Athletes and Fitness Enthusiasts, Diabetics and Individuals Focused on Blood Sugar Control, Obese and Overweight Individuals, Intermittent Fasters, Medical or Lifestyle-Driven Goals
Sales Channels Analyzed (Segment 3) Retail Pharmacies, Supermarkets and Hypermarkets, Specialty Health and Wellness Stores, Hospital Pharmacies, Drug Stores, E-Commerce or Online Retail Platforms
Regions Covered North America, Latin America, Western Europe, Eastern Europe, East Asia, South Asia & Pacific
Countries Covered United States, Canada, Germany, United Kingdom, France, Italy, Spain, China, India, Japan, South Korea, Australia, Brazil, Mexico, Argentina, Saudi Arabia, UAE, South Africa
Key Players Haleon Group, GNC Holdings, LLC, 1 Up Nutrition, NatureWise, NOW Foods, Trim Healthy Mama, Procter & Gamble, Fiber Choice, Nestlé USA, Nature's Bounty, Unilever, Bayer AG
Additional Attributes Dollar sales by product type and application, growth in intermittent fasting and diabetic-focused supplements, e-commerce channel acceleration, OTC availability trends, regional preference variations in stimulant vs. non-stimulant formulas

Leading companies in OTC Appetite Suppressant Market

  • Haleon group
  • GNC Holdings, LLC
  • 1 Up Nutrition
  • NatureWise
  • NOW Foods
  • Trim Healthy Mama
  • Procter & Gamble
  • Fiber Choice
  • Nestlé USA
  • Nature's Bounty
  • Unilever
  • Bayer AG

OTC Appetite Suppressant Market Segmentation

By Product Type:

The industry includes plant-based extracts, fiber-based supplements, amino acid and protein-based supplements, stimulant-based supplements, hormonal/neurotransmitter-based products, combination supplements, BHB salts, L-carnitine, and fat absorption inhibitors.

By Application:

The industry is segmented into weight management seekers, athletes and fitness enthusiasts, diabetics and individuals focused on blood sugar control, obese and overweight individuals, intermittent fasters, and those with medical or lifestyle-driven goals.

By Sales Channel:

These products are sold through retail pharmacies, supermarkets and hypermarkets, specialty health and wellness stores, hospital pharmacies, drug stores, and e-commerce or online retail platforms.

By Region:

The industry is segmented as North America, Latin America, Western Europe, Eastern Europe, East Asia, South Asia & Pacific.


Table of Content

  1. Executive Summary
    • Global Market Outlook
    • Demand-side Trends
    • Supply-side Trends
    • Technology Roadmap Analysis
    • Analysis and Recommendations
  2. Market Overview
    • Market Coverage / Taxonomy
    • Market Definition / Scope / Limitations
  3. Market Background
    • Market Dynamics
      • Drivers
      • Restraints
      • Opportunity
      • Trends
    • Scenario Forecast
      • Demand in Optimistic Scenario
      • Demand in Likely Scenario
      • Demand in Conservative Scenario
    • Opportunity Map Analysis
    • Product Life Cycle Analysis
    • Supply Chain Analysis
      • Supply Side Participants and their Roles
        • Producers
        • Mid-Level Participants (Traders/ Agents/ Brokers)
        • Wholesalers and Distributors
      • Value Added and Value Created at Node in the Supply Chain
      • List of Raw Material Suppliers
      • List of Existing and Potential Buyer’s
    • Investment Feasibility Matrix
    • Value Chain Analysis
      • Profit Margin Analysis
      • Wholesalers and Distributors
      • Retailers
    • PESTLE and Porter’s Analysis
    • Regulatory Landscape
      • By Key Regions
      • By Key Countries
    • Regional Parent Market Outlook
    • Production and Consumption Statistics
    • Import and Export Statistics
  4. Global Analysis 2020-2024 and Forecast, 2025-2035
    • Historical Market Size Value (USD Million) & Volume ( Million Units) Analysis, 2020-2024
    • Current and Future Market Size Value (USD Million) & Volume ( Million Units) Projections, 2025-2035
      • Y-o-Y Growth Trend Analysis
      • Absolute $ Opportunity Analysis
  5. Global Pricing Analysis 2020-2024 and Forecast 2025-2035
  6. Global Analysis 2020-2024 and Forecast 2025-2035, By Product
    • Introduction / Key Findings
    • Historical Market Size Value (USD Million) & Volume ( Million Units) Analysis By Product, 2020-2024
    • Current and Future Market Size Value (USD Million) & Volume ( Million Units) Analysis and Forecast By Product, 2025-2035
      • Plant-Based Extracts
      • Fiber-Based Supplements
      • Amino Acid & Protein-Based Supplements
      • Stimulant-Based Supplements
      • Hormonal/Neurotransmitter-Based
      • Combination Supplements
      • BHB Salts
      • L-Carnitine
      • Fat Absorption Inhibitors
      • Meal Replacements & Satiety Boosters
    • Y-o-Y Growth Trend Analysis By Product, 2020-2024
    • Absolute $ Opportunity Analysis By Product, 2025-2035
  7. Global Analysis 2020-2024 and Forecast 2025-2035, By Application
    • Introduction / Key Findings
    • Historical Market Size Value (USD Million) & Volume ( Million Units) Analysis By Application, 2020-2024
    • Current and Future Market Size Value (USD Million) & Volume ( Million Units) Analysis and Forecast By Application, 2025-2035
      • Weight Management Seekers
      • Athletes & Fitness Enthusiasts
      • Diabetics & Blood Sugar Control
      • Obese & Overweight
      • Intermittent Fasters
      • Medical & Lifestyle-Driven
    • Y-o-Y Growth Trend Analysis By Application, 2020-2024
    • Absolute $ Opportunity Analysis By Application, 2025-2035
  8. Global Analysis 2020-2024 and Forecast 2025-2035, By Sales Channel
    • Introduction / Key Findings
    • Historical Market Size Value (USD Million) & Volume ( Million Units) Analysis By Sales Channel, 2020-2024
    • Current and Future Market Size Value (USD Million) & Volume ( Million Units) Analysis and Forecast By Sales Channel, 2025-2035
      • Retail Pharmacies
      • Supermarkets & Hypermarkets
      • Specialty Health & Wellness Stores
      • Hospital Pharmacies
      • Drug Stores
      • E-Commerce / Online Retail
    • Y-o-Y Growth Trend Analysis By Sales Channel, 2020-2024
    • Absolute $ Opportunity Analysis By Sales Channel, 2025-2035
  9. Global Analysis 2020-2024 and Forecast 2025-2035, By Region
    • Introduction
    • Historical Market Size Value (USD Million) & Volume ( Million Units) Analysis By Region, 2020-2024
    • Current Market Size Value (USD Million) & Volume ( Million Units) Analysis and Forecast By Region, 2025-2035
      • North America
      • Latin America
      • Western Europe
      • Eastern Europe
      • East Asia
      • South Asia & Pacific
      • Middle East and Africa
    • Market Attractiveness Analysis By Region
  10. North America Analysis 2020-2024 and Forecast 2025-2035, By Country
    • Historical Market Size Value (USD Million) & Volume ( Million Units) Trend Analysis By Market Taxonomy, 2020-2024
    • Market Size Value (USD Million) & Volume ( Million Units) Forecast By Market Taxonomy, 2025-2035
      • By Country
        • U.S.
        • Canada
        • Mexico
      • By Product
      • By Application
      • By Sales Channel
    • Market Attractiveness Analysis
      • By Country
      • By Product
      • By Application
      • By Sales Channel
    • Key Takeaways
  11. Latin America Analysis 2020-2024 and Forecast 2025-2035, By Country
    • Historical Market Size Value (USD Million) & Volume ( Million Units) Trend Analysis By Market Taxonomy, 2020-2024
    • Market Size Value (USD Million) & Volume ( Million Units) Forecast By Market Taxonomy, 2025-2035
      • By Country
        • Brazil 
        • Argentina
        • Rest of LATAM
      • By Product
      • By Application
      • By Sales Channel
    • Market Attractiveness Analysis
      • By Country
      • By Product
      • By Application
      • By Sales Channel
    • Key Takeaways
  12. Western Europe Analysis 2020-2024 and Forecast 2025-2035, By Country
    • Historical Market Size Value (USD Million) & Volume ( Million Units) Trend Analysis By Market Taxonomy, 2020-2024
    • Market Size Value (USD Million) & Volume ( Million Units) Forecast By Market Taxonomy, 2025-2035
      • By Country
        • Germany
        • Italy
        • France
        • UK
        • Spain
        • BENELUX
        • Nordic
        • Rest of W.Europe
      • By Product
      • By Application
      • By Sales Channel
    • Market Attractiveness Analysis
      • By Country
      • By Product
      • By Application
      • By Sales Channel
    • Key Takeaways
  13. Eastern Europe Analysis 2020-2024 and Forecast 2025-2035, By Country
    • Historical Market Size Value (USD Million) & Volume ( Million Units) Trend Analysis By Market Taxonomy, 2020-2024
    • Market Size Value (USD Million) & Volume ( Million Units) Forecast By Market Taxonomy, 2025-2035
      • By Country
        • Russia
        • Hungary
        • Poland
        • Balkan & Baltics
        • Rest of E. Europe
      • By Product
      • By Application
      • By Sales Channel
    • Market Attractiveness Analysis
      • By Country
      • By Product
      • By Application
      • By Sales Channel
    • Key Takeaways
  14. East Asia Analysis 2020-2024 and Forecast 2025-2035, By Country
    • Historical Market Size Value (USD Million) & Volume ( Million Units) Trend Analysis By Market Taxonomy, 2020-2024
    • Market Size Value (USD Million) & Volume ( Million Units) Forecast By Market Taxonomy, 2025-2035
      • By Country
        • China
        • Japan
        • South Korea
      • By Product
      • By Application
      • By Sales Channel
    • Market Attractiveness Analysis
      • By Country
      • By Product
      • By Application
      • By Sales Channel
    • Key Takeaways
  15. South Asia & Pacific Analysis 2020-2024 and Forecast 2025-2035, By Country
    • Historical Market Size Value (USD Million) & Volume ( Million Units) Trend Analysis By Market Taxonomy, 2020-2024
    • Market Size Value (USD Million) & Volume ( Million Units) Forecast By Market Taxonomy, 2025-2035
      • By Country
        • India
        • Australia & New Zealand
        • ASEAN
        • Rest of SAP
      • By Product
      • By Application
      • By Sales Channel
    • Market Attractiveness Analysis
      • By Country
      • By Product
      • By Application
      • By Sales Channel
    • Key Takeaways
  16. Middle East and Africa Analysis 2020-2024 and Forecast 2025-2035, By Country
    • Historical Market Size Value (USD Million) & Volume ( Million Units) Trend Analysis By Market Taxonomy, 2020-2024
    • Market Size Value (USD Million) & Volume ( Million Units) Forecast By Market Taxonomy, 2025-2035
      • By Country
        • GCC Countries
        • Northern Africa
        • South Africa
        • Turkiye
        • Rest of MEA
      • By Product
      • By Application
      • By Sales Channel
    • Market Attractiveness Analysis
      • By Country
      • By Product
      • By Application
      • By Sales Channel
    • Key Takeaways
  17. Key Countries Analysis
    • U.S.
      • Pricing Analysis
      • Market Share Analysis, 2024
        • By Product
        • By Application
        • By Sales Channel
    • Canada
      • Pricing Analysis
      • Market Share Analysis, 2024
        • By Product
        • By Application
        • By Sales Channel
    • Brazil
      • Pricing Analysis
      • Market Share Analysis, 2024
        • By Product
        • By Application
        • By Sales Channel
    • Mexico
      • Pricing Analysis
      • Market Share Analysis, 2024
        • By Product
        • By Application
        • By Sales Channel
    • Argentina
      • Pricing Analysis
      • Market Share Analysis, 2024
        • By Product
        • By Application
        • By Sales Channel
  18. Market Structure Analysis
    • Competition Dashboard
    • Competition Benchmarking
    • Market Share Analysis of Top Players
      • By Regional
      • By Product
      • By Application
      • By Sales Channel
  19. Competition Analysis
    • Competition Deep Dive
      • Haleon group
        • Overview
        • Product Portfolio
        • Profitability by Market Segments (Product/Age /Sales Channel/Region)
        • Sales Footprint
        • Strategy Overview
          • Marketing Strategy
          • Product Strategy
          • Channel Strategy
      • GNC Holdings, LLC
        • Overview
        • Product Portfolio
        • Profitability by Market Segments (Product/Age /Sales Channel/Region)
        • Sales Footprint
        • Strategy Overview
          • Marketing Strategy
          • Product Strategy
          • Channel Strategy
      • 1 Up Nutrition
        • Overview
        • Product Portfolio
        • Profitability by Market Segments (Product/Age /Sales Channel/Region)
        • Sales Footprint
        • Strategy Overview
          • Marketing Strategy
          • Product Strategy
          • Channel Strategy
      • NatureWise
        • Overview
        • Product Portfolio
        • Profitability by Market Segments (Product/Age /Sales Channel/Region)
        • Sales Footprint
        • Strategy Overview
          • Marketing Strategy
          • Product Strategy
          • Channel Strategy
      • NOW Foods
        • Overview
        • Product Portfolio
        • Profitability by Market Segments (Product/Age /Sales Channel/Region)
        • Sales Footprint
        • Strategy Overview
          • Marketing Strategy
          • Product Strategy
          • Channel Strategy
      • Trim Healthy Mama
        • Overview
        • Product Portfolio
        • Profitability by Market Segments (Product/Age /Sales Channel/Region)
        • Sales Footprint
        • Strategy Overview
          • Marketing Strategy
          • Product Strategy
          • Channel Strategy
      • Procter & Gamble
        • Overview
        • Product Portfolio
        • Profitability by Market Segments (Product/Age /Sales Channel/Region)
        • Sales Footprint
        • Strategy Overview
          • Marketing Strategy
          • Product Strategy
          • Channel Strategy
      • Fiber Choice
        • Overview
        • Product Portfolio
        • Profitability by Market Segments (Product/Age /Sales Channel/Region)
        • Sales Footprint
        • Strategy Overview
          • Marketing Strategy
          • Product Strategy
          • Channel Strategy
      • Nestlé USA
        • Overview
        • Product Portfolio
        • Profitability by Market Segments (Product/Age /Sales Channel/Region)
        • Sales Footprint
        • Strategy Overview
          • Marketing Strategy
          • Product Strategy
          • Channel Strategy
      • Nature's Bounty
        • Overview
        • Product Portfolio
        • Profitability by Market Segments (Product/Age /Sales Channel/Region)
        • Sales Footprint
        • Strategy Overview
          • Marketing Strategy
          • Product Strategy
          • Channel Strategy
      • Unilever
        • Overview
        • Product Portfolio
        • Profitability by Market Segments (Product/Age /Sales Channel/Region)
        • Sales Footprint
        • Strategy Overview
          • Marketing Strategy
          • Product Strategy
          • Channel Strategy
      • Bayer AG
        • Overview
        • Product Portfolio
        • Profitability by Market Segments (Product/Age /Sales Channel/Region)
        • Sales Footprint
        • Strategy Overview
          • Marketing Strategy
          • Product Strategy
          • Channel Strategy
  20. Assumptions & Acronyms Used
  21. Research Methodology

List of Tables

  • Table 1: Global Market Value (USD Million) Forecast by Region, 2020-2035
  • Table 2: Global Market Volume ( Million Units) Forecast by Region, 2020-2035
  • Table 3: Global Market Value (USD Million) Forecast by Product, 2020-2035
  • Table 4: Global Market Volume ( Million Units) Forecast by Product, 2020-2035
  • Table 5: Global Market Value (USD Million) Forecast by Application, 2020-2035
  • Table 6: Global Market Volume ( Million Units) Forecast by Application, 2020-2035
  • Table 7: Global Market Value (USD Million) Forecast by Sales Channel, 2020-2035
  • Table 8: Global Market Volume ( Million Units) Forecast by Sales Channel, 2020-2035
  • Table 9: North America Market Value (USD Million) Forecast by Country, 2020-2035
  • Table 10: North America Market Volume ( Million Units) Forecast by Country, 2020-2035
  • Table 11: North America Market Value (USD Million) Forecast by Product, 2020-2035
  • Table 12: North America Market Volume ( Million Units) Forecast by Product, 2020-2035
  • Table 13: North America Market Value (USD Million) Forecast by Application, 2020-2035
  • Table 14: North America Market Volume ( Million Units) Forecast by Application, 2020-2035
  • Table 15: North America Market Value (USD Million) Forecast by Sales Channel, 2020-2035
  • Table 16: North America Market Volume ( Million Units) Forecast by Sales Channel, 2020-2035
  • Table 17: Latin America Market Value (USD Million) Forecast by Country, 2020-2035
  • Table 18: Latin America Market Volume ( Million Units) Forecast by Country, 2020-2035
  • Table 19: Latin America Market Value (USD Million) Forecast by Product, 2020-2035
  • Table 20: Latin America Market Volume ( Million Units) Forecast by Product, 2020-2035
  • Table 21: Latin America Market Value (USD Million) Forecast by Application, 2020-2035
  • Table 22: Latin America Market Volume ( Million Units) Forecast by Application, 2020-2035
  • Table 23: Latin America Market Value (USD Million) Forecast by Sales Channel, 2020-2035
  • Table 24: Latin America Market Volume ( Million Units) Forecast by Sales Channel, 2020-2035
  • Table 25: Western Europe Market Value (USD Million) Forecast by Country, 2020-2035
  • Table 26: Western Europe Market Volume ( Million Units) Forecast by Country, 2020-2035
  • Table 27: Western Europe Market Value (USD Million) Forecast by Product, 2020-2035
  • Table 28: Western Europe Market Volume ( Million Units) Forecast by Product, 2020-2035
  • Table 29: Western Europe Market Value (USD Million) Forecast by Application, 2020-2035
  • Table 30: Western Europe Market Volume ( Million Units) Forecast by Application, 2020-2035
  • Table 31: Western Europe Market Value (USD Million) Forecast by Sales Channel, 2020-2035
  • Table 32: Western Europe Market Volume ( Million Units) Forecast by Sales Channel, 2020-2035
  • Table 33: Eastern Europe Market Value (USD Million) Forecast by Country, 2020-2035
  • Table 34: Eastern Europe Market Volume ( Million Units) Forecast by Country, 2020-2035
  • Table 35: Eastern Europe Market Value (USD Million) Forecast by Product, 2020-2035
  • Table 36: Eastern Europe Market Volume ( Million Units) Forecast by Product, 2020-2035
  • Table 37: Eastern Europe Market Value (USD Million) Forecast by Application, 2020-2035
  • Table 38: Eastern Europe Market Volume ( Million Units) Forecast by Application, 2020-2035
  • Table 39: Eastern Europe Market Value (USD Million) Forecast by Sales Channel, 2020-2035
  • Table 40: Eastern Europe Market Volume ( Million Units) Forecast by Sales Channel, 2020-2035
  • Table 41: East Asia Market Value (USD Million) Forecast by Country, 2020-2035
  • Table 42: East Asia Market Volume ( Million Units) Forecast by Country, 2020-2035
  • Table 43: East Asia Market Value (USD Million) Forecast by Product, 2020-2035
  • Table 44: East Asia Market Volume ( Million Units) Forecast by Product, 2020-2035
  • Table 45: East Asia Market Value (USD Million) Forecast by Application, 2020-2035
  • Table 46: East Asia Market Volume ( Million Units) Forecast by Application, 2020-2035
  • Table 47: East Asia Market Value (USD Million) Forecast by Sales Channel, 2020-2035
  • Table 48: East Asia Market Volume ( Million Units) Forecast by Sales Channel, 2020-2035
  • Table 49: South Asia & Pacific Market Value (USD Million) Forecast by Country, 2020-2035
  • Table 50: South Asia & Pacific Market Volume ( Million Units) Forecast by Country, 2020-2035
  • Table 51: South Asia & Pacific Market Value (USD Million) Forecast by Product, 2020-2035
  • Table 52: South Asia & Pacific Market Volume ( Million Units) Forecast by Product, 2020-2035
  • Table 53: South Asia & Pacific Market Value (USD Million) Forecast by Application, 2020-2035
  • Table 54: South Asia & Pacific Market Volume ( Million Units) Forecast by Application, 2020-2035
  • Table 55: South Asia & Pacific Market Value (USD Million) Forecast by Sales Channel, 2020-2035
  • Table 56: South Asia & Pacific Market Volume ( Million Units) Forecast by Sales Channel, 2020-2035
  • Table 57: Middle East and Africa Market Value (USD Million) Forecast by Country, 2020-2035
  • Table 58: Middle East and Africa Market Volume ( Million Units) Forecast by Country, 2020-2035
  • Table 59: Middle East and Africa Market Value (USD Million) Forecast by Product, 2020-2035
  • Table 60: Middle East and Africa Market Volume ( Million Units) Forecast by Product, 2020-2035
  • Table 61: Middle East and Africa Market Value (USD Million) Forecast by Application, 2020-2035
  • Table 62: Middle East and Africa Market Volume ( Million Units) Forecast by Application, 2020-2035
  • Table 63: Middle East and Africa Market Value (USD Million) Forecast by Sales Channel, 2020-2035
  • Table 64: Middle East and Africa Market Volume ( Million Units) Forecast by Sales Channel, 2020-2035


List of Figures

  • Figure 1: Global Market Volume ( Million Units) Forecast 2020–2035
  • Figure 2: Global Market Pricing Analysis
  • Figure 3: Global Market Value (USD Million) Forecast 2020–2035
  • Figure 4: Global Market Value Share and BPS Analysis by Product, 2025 and 2035
  • Figure 5: Global Market Y-o-Y Growth Comparison by Product, 2025–2035
  • Figure 6: Global Market Attractiveness Analysis by Product
  • Figure 7: Global Market Value Share and BPS Analysis by Application, 2025 and 2035
  • Figure 8: Global Market Y-o-Y Growth Comparison by Application, 2025–2035
  • Figure 9: Global Market Attractiveness Analysis by Application
  • Figure 10: Global Market Value Share and BPS Analysis by Sales Channel, 2025 and 2035
  • Figure 11: Global Market Y-o-Y Growth Comparison by Sales Channel, 2025–2035
  • Figure 12: Global Market Attractiveness Analysis by Sales Channel
  • Figure 13: Global Market Value (USD Million) Share and BPS Analysis by Region, 2025 and 2035
  • Figure 14: Global Market Y-o-Y Growth Comparison by Region, 2025–2035
  • Figure 15: Global Market Attractiveness Analysis by Region
  • Figure 16: North America Market Incremental $ Opportunity, 2025–2035
  • Figure 17: Latin America Market Incremental $ Opportunity, 2025–2035
  • Figure 18: Western Europe Market Incremental $ Opportunity, 2025–2035
  • Figure 19: Eastern Europe Market Incremental $ Opportunity, 2025–2035
  • Figure 20: East Asia Market Incremental $ Opportunity, 2025–2035
  • Figure 21: South Asia & Pacific Market Incremental $ Opportunity, 2025–2035
  • Figure 22: Middle East and Africa Market Incremental $ Opportunity, 2025–2035
  • Figure 23: North America Market Value Share and BPS Analysis by Country, 2025 and 2035
  • Figure 24: North America Market Value Share and BPS Analysis by Product, 2025 and 2035
  • Figure 25: North America Market Y-o-Y Growth Comparison by Product, 2025–2035
  • Figure 26: North America Market Attractiveness Analysis by Product
  • Figure 27: North America Market Value Share and BPS Analysis by Application, 2025 and 2035
  • Figure 28: North America Market Y-o-Y Growth Comparison by Application, 2025–2035
  • Figure 29: North America Market Attractiveness Analysis by Application
  • Figure 30: North America Market Value Share and BPS Analysis by Sales Channel, 2025 and 2035
  • Figure 31: North America Market Y-o-Y Growth Comparison by Sales Channel, 2025–2035
  • Figure 32: North America Market Attractiveness Analysis by Sales Channel
  • Figure 33: Latin America Market Value Share and BPS Analysis by Country, 2025 and 2035
  • Figure 34: Latin America Market Value Share and BPS Analysis by Product, 2025 and 2035
  • Figure 35: Latin America Market Y-o-Y Growth Comparison by Product, 2025–2035
  • Figure 36: Latin America Market Attractiveness Analysis by Product
  • Figure 37: Latin America Market Value Share and BPS Analysis by Application, 2025 and 2035
  • Figure 38: Latin America Market Y-o-Y Growth Comparison by Application, 2025–2035
  • Figure 39: Latin America Market Attractiveness Analysis by Application
  • Figure 40: Latin America Market Value Share and BPS Analysis by Sales Channel, 2025 and 2035
  • Figure 41: Latin America Market Y-o-Y Growth Comparison by Sales Channel, 2025–2035
  • Figure 42: Latin America Market Attractiveness Analysis by Sales Channel
  • Figure 43: Western Europe Market Value Share and BPS Analysis by Country, 2025 and 2035
  • Figure 44: Western Europe Market Value Share and BPS Analysis by Product, 2025 and 2035
  • Figure 45: Western Europe Market Y-o-Y Growth Comparison by Product, 2025–2035
  • Figure 46: Western Europe Market Attractiveness Analysis by Product
  • Figure 47: Western Europe Market Value Share and BPS Analysis by Application, 2025 and 2035
  • Figure 48: Western Europe Market Y-o-Y Growth Comparison by Application, 2025–2035
  • Figure 49: Western Europe Market Attractiveness Analysis by Application
  • Figure 50: Western Europe Market Value Share and BPS Analysis by Sales Channel, 2025 and 2035
  • Figure 51: Western Europe Market Y-o-Y Growth Comparison by Sales Channel, 2025–2035
  • Figure 52: Western Europe Market Attractiveness Analysis by Sales Channel
  • Figure 53: Eastern Europe Market Value Share and BPS Analysis by Country, 2025 and 2035
  • Figure 54: Eastern Europe Market Value Share and BPS Analysis by Product, 2025 and 2035
  • Figure 55: Eastern Europe Market Y-o-Y Growth Comparison by Product, 2025–2035
  • Figure 56: Eastern Europe Market Attractiveness Analysis by Product
  • Figure 57: Eastern Europe Market Value Share and BPS Analysis by Application, 2025 and 2035
  • Figure 58: Eastern Europe Market Y-o-Y Growth Comparison by Application, 2025–2035
  • Figure 59: Eastern Europe Market Attractiveness Analysis by Application
  • Figure 60: Eastern Europe Market Value Share and BPS Analysis by Sales Channel, 2025 and 2035
  • Figure 61: Eastern Europe Market Y-o-Y Growth Comparison by Sales Channel, 2025–2035
  • Figure 62: Eastern Europe Market Attractiveness Analysis by Sales Channel
  • Figure 63: East Asia Market Value Share and BPS Analysis by Country, 2025 and 2035
  • Figure 64: East Asia Market Value Share and BPS Analysis by Product, 2025 and 2035
  • Figure 65: East Asia Market Y-o-Y Growth Comparison by Product, 2025–2035
  • Figure 66: East Asia Market Attractiveness Analysis by Product
  • Figure 67: East Asia Market Value Share and BPS Analysis by Application, 2025 and 2035
  • Figure 68: East Asia Market Y-o-Y Growth Comparison by Application, 2025–2035
  • Figure 69: East Asia Market Attractiveness Analysis by Application
  • Figure 70: East Asia Market Value Share and BPS Analysis by Sales Channel, 2025 and 2035
  • Figure 71: East Asia Market Y-o-Y Growth Comparison by Sales Channel, 2025–2035
  • Figure 72: East Asia Market Attractiveness Analysis by Sales Channel
  • Figure 73: South Asia & Pacific Market Value Share and BPS Analysis by Country, 2025 and 2035
  • Figure 74: South Asia & Pacific Market Value Share and BPS Analysis by Product, 2025 and 2035
  • Figure 75: South Asia & Pacific Market Y-o-Y Growth Comparison by Product, 2025–2035
  • Figure 76: South Asia & Pacific Market Attractiveness Analysis by Product
  • Figure 77: South Asia & Pacific Market Value Share and BPS Analysis by Application, 2025 and 2035
  • Figure 78: South Asia & Pacific Market Y-o-Y Growth Comparison by Application, 2025–2035
  • Figure 79: South Asia & Pacific Market Attractiveness Analysis by Application
  • Figure 80: South Asia & Pacific Market Value Share and BPS Analysis by Sales Channel, 2025 and 2035
  • Figure 81: South Asia & Pacific Market Y-o-Y Growth Comparison by Sales Channel, 2025–2035
  • Figure 82: South Asia & Pacific Market Attractiveness Analysis by Sales Channel
  • Figure 83: Middle East and Africa Market Value Share and BPS Analysis by Country, 2025 and 2035
  • Figure 84: Middle East and Africa Market Value Share and BPS Analysis by Product, 2025 and 2035
  • Figure 85: Middle East and Africa Market Y-o-Y Growth Comparison by Product, 2025–2035
  • Figure 86: Middle East and Africa Market Attractiveness Analysis by Product
  • Figure 87: Middle East and Africa Market Value Share and BPS Analysis by Application, 2025 and 2035
  • Figure 88: Middle East and Africa Market Y-o-Y Growth Comparison by Application, 2025–2035
  • Figure 89: Middle East and Africa Market Attractiveness Analysis by Application
  • Figure 90: Middle East and Africa Market Value Share and BPS Analysis by Sales Channel, 2025 and 2035
  • Figure 91: Middle East and Africa Market Y-o-Y Growth Comparison by Sales Channel, 2025–2035
  • Figure 92: Middle East and Africa Market Attractiveness Analysis by Sales Channel
  • Figure 93: Global Market – Tier Structure Analysis
  • Figure 94: Global Market – Company Share Analysis

Frequently Asked Questions

What is the projected industry size of the OTC appetite suppressant market by 2035?

The industry is projected to reach USD 34.4 billion by 2035.

What is the expected CAGR of the OTC appetite suppressant market from 2025 to 2035?

The industry is expected to grow at a CAGR of 7.9% from 2025 to 2035.

Which segment is expected to lead the OTC appetite suppressant market in 2025?

Plant-based extracts are expected to lead with a 20.0% share in 2025.

What is the industry size of the OTC appetite suppressant market in 2025?

The industry is estimated to reach USD 16.1 billion in 2025.

Which region is expected to witness the highest growth in the OTC appetite suppressant market?

South Asia & Pacific, particularly India, is expected to show the highest growth with a projected CAGR of 13.5%.

Explore Similar Insights

Future Market Insights

OTC Appetite Suppressant Market