

- Market Size (2026)
- USD 37.7 Bn
- Forecast (2036)
- USD 66.2 Bn
- CAGR (2026 to 2036)
- 5.8%
Ovalbumin Powder Market Size, Market Forecast and Outlook By FMI
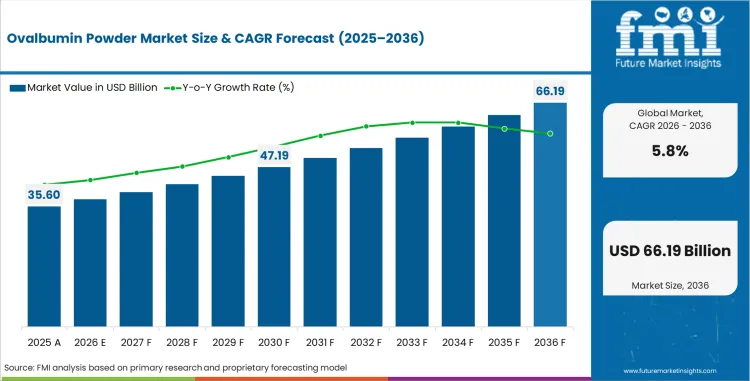
The ovalbumin powder market was valued at USD 35.6 billion in 2025. The market is set to reach USD 37.7 billion by 2026-end and grow at a CAGR of 5.8% between 2026-2036 to reach USD 66.2 billion by 2036. Food Grade Ovalbumin Powder will dominate with a 60.0% share, while Food And Beverage will lead with a 65.0% share.
Summary of the Ovalbumin Powder Market
- Demand and Growth Drivers
- Food and beverage accounts for 65.0% of application demand, reflecting the essential role of ovalbumin powder as a foaming agent, emulsifier, and binding protein in bakery, confectionery, meat processing, and prepared food manufacturing.
- Food grade ovalbumin powder accounts for 60.0% of product demand, with spray-dried egg white powder providing consistent functionality for industrial food formulation across large-scale production operations.
- Chicken egg derived ovalbumin accounts for 95.0% of source demand, reflecting the established supply chain from egg processing operations to spray-dried powder production.
- Product and Segment View
- Food grade ovalbumin powder is expected to account for 60.0% of product demand, serving bakery, confectionery, and processed food manufacturing with standardized protein functionality.
- Chicken egg derived ovalbumin represents 95.0% of source demand, with established egg breaking and spray drying infrastructure supporting industrial-scale production.
- Food manufacturers account for 60.0% of end-use demand, with pharmaceutical and animal nutrition companies completing the balance.
- Geography and Competitive Outlook
- India (6.6%) leads global growth, supported by expanding food processing capacity and functional ingredient demand.
- Europe sustains demand through established food processing and pharmaceutical-grade ovalbumin applications.
- Kewpie Corporation (10.0%) leads through integrated egg processing and ovalbumin powder production in Asia.
- Analyst Opinion
- Nandini Roy Choudhury, Principal Consultant at FMI says, 'Producers that maintain pharmaceutical-grade ovalbumin capabilities while scaling food-grade production efficiency are likely to capture share across both high-value biotech and high-volume food ingredient segments.'
- The ovalbumin powder market is shaped by egg processing economics, food manufacturing formulation requirements, and growing pharmaceutical and biotechnology applications.
- Pharmaceutical-grade ovalbumin for vaccine production and biotechnology research provides a higher-margin secondary segment with distinct purity specifications.
- Supply chain reliability from egg breaking operations through spray drying is a competitive differentiator for industrial food ingredient supply.
Key Takeaways, Market Size, and Forecast
- The ovalbumin powder market was valued at USD 35.60 billion in 2025.
- By 2036, the Ovalbumin Powder Market is expected to be worth USD 66.19 billion.
- From 2026 to 2036, the market is projected to expand at a CAGR of 5.8%.
- The market is projected to create an incremental opportunity of USD 28.53 billion between 2026 and 2036.
- In 2026, food and beverage is expected to account for 65% of the application segment, driven by demand for egg-derived protein and foaming agents in bakery, confectionery, and processed food manufacturing.
- India (6.6%) and Germany (5.9%) are two of the fastest growing markets in the world.
Ovalbumin Powder Market Definition
The ovalbumin powder market includes food grade, pharmaceutical grade, and industrial grade spray-dried egg white protein powder derived primarily from chicken eggs, used as a functional ingredient in food manufacturing, pharmaceutical and biotechnology applications, and animal nutrition.
Ovalbumin Powder Market Inclusions
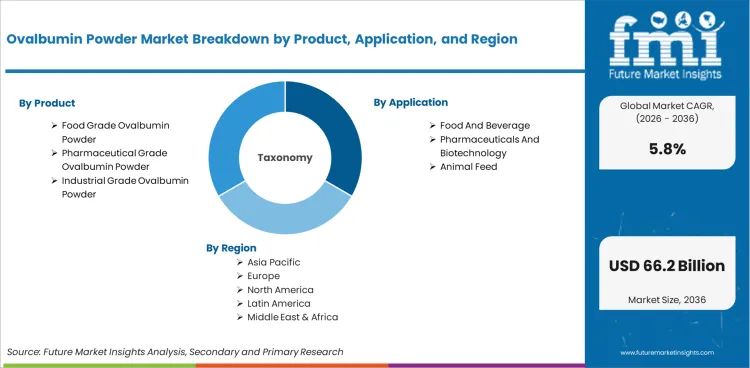
Market scope encompasses all commercially traded ovalbumin powder categorized by product (food grade, pharmaceutical grade, industrial grade), application (food and beverage, pharmaceuticals and biotechnology, animal feed), end use (food manufacturers, pharmaceutical companies, animal nutrition companies), distribution channel (direct sales, distributors), and source (chicken egg derived, alternative sources). Revenue estimates cover the period from 2026 to 2036.
Ovalbumin Powder Market Exclusions
The scope does not include liquid egg whites, whole egg powder, egg yolk powder, or plant-based protein alternatives marketed as egg replacers.
Ovalbumin Powder Market Research Methodology
- Primary Research: FMI analysts interviewed ovalbumin powder manufacturers, food ingredient formulators, pharmaceutical procurement managers, and egg processing industry consultants in key markets.
- Desk Research: Integrated data from egg processing industry associations, food ingredient market tracking and pharmaceutical excipient databases.
- Market size and forecast: Bottom up approach on ovalbumin powder production and trade data across food, pharmaceutical and animal nutrition segments, with regional egg processing capacity adjustment
- Data validation: Quarterly cross-checked against egg production statistics, food ingredient market tracking and manufacturer disclosures.
Why is the Ovalbumin Powder Market Growing?
- Ovalbumin powder is used predominantly by food manufacturers requiring standardized protein functionality for bakery, confectionery and processed food applications.
- The demand for adjuvants in vaccine production and for research-grade proteins in pharmaceutical and biotechnology applications carries higher margins and has specific requirements for purity and documentation.
The ovalbumin powder market is anticipated to grow at a CAGR of 5.8%, projected to reach USD 66.19 billion by the year 2036 from USD 37.66 billion in 2026. Demand is driven by the protein needs of food manufacturers, pharmaceutical uses and the economics of egg processing. Product demand by food grade accounts for 60.0%.
Ovalbumin powder is produced in the market supplied by the egg processing supply chains as a value added product from egg breaking operations. Kewpie Corporation leads with 10.0% through integrated egg processing in Japan and Asia.
India leads with 6.6% CAGR, led by food processing growth. Germany at 5.9% CAGR signifies established demand for food processing and pharmaceutical grade.
Market Segmentation Analysis
- Food grade ovalbumin accounts for 60.0% of the product share. Spray dried egg white powder offers foaming, emulsification and binding functionality in the industrial food production.
- Application Demand Food and beverage accounts for 65.0% of application demand. Bakery, confectionery and meat processing are primary formulation categories.
- Distribution is dominated by direct sales at 65.0% because of the food and drug procurement's requirements for ingredient specification and quality certification.
The ovalbumin powder market can be segmented on the basis of product, application, end use, distribution channel and source. Demand patterns depend on the geography of food manufacturing, the infrastructure for processing eggs, and the requirements of pharmaceutical applications.
Insights into the Food and Beverage Application Segment
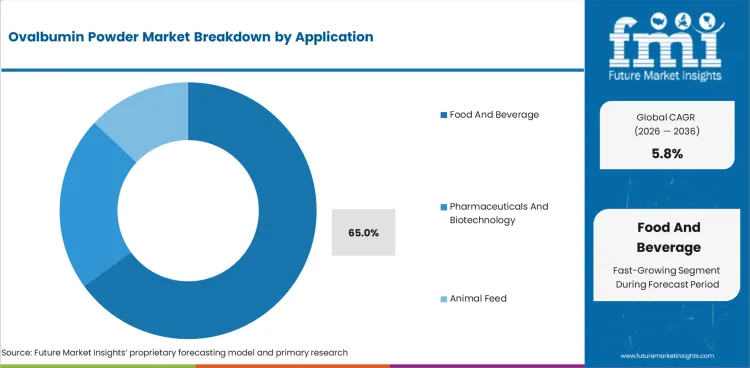
Application segment is projected to be the dominating segment in the food and beverage industry, in 2026, with 65.0% of the overall application segment. The main categories of formulation are bakery products (meringues, cakes, soufflés), confectionery (marshmallows, nougat) and processed meat (binding, emulsification).
The second largest application is in pharmaceuticals and biotechnology, where ovalbumin is used as an adjuvant for vaccine production, a research-grade protein standard, and a drug delivery carrier.
Insights into the Food Grade Ovalbumin Product Segment
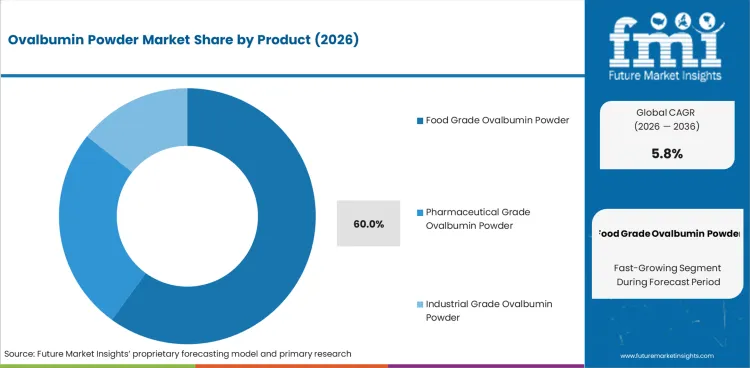
Food grade ovalbumin accounts for 60.0% of the product demand. Spray-dried processing turns liquid egg whites into a stable powder, with a consistent protein content, solubility and foaming characteristics for use in industrial food production.
Pharmaceutical grade, which has higher margins, represents a smaller portion of the segment than its lower-margin counterpart, but is capable of meeting the purity standards of the pharmacopoeia for vaccine production and biotechnology research applications.
Ovalbumin Powder Market Drivers, Restraints, and Opportunities
- The demand for protein in the food manufacturing industry is predictable, and it is proportional to the volume of bakery, confectionery and processed food production.
- Supply chain risks that impact the availability and pricing of ovalbumin powder are fluctuations in egg prices and the occurrence of avian influenza outbreaks.
- Pharmaceutical-grade applications are more profitable with purity specifications and regulatory documentation requirements.
Demand from the food manufacturing sector, the economics of egg processing and pharmaceutical applications with unique value propositions are driving the market.
Food Manufacturing Protein Demand
Ovalbumin powder provides essential foaming, emulsification, and binding functionality in bakery and confectionery. Demand correlates with processed food production volumes across global food manufacturing.
Egg Supply Chain Economics
Egg-breaking operations are connected with the manufacture of ovalbumin powder. Egg price volatility, driven by feed costs, avian influenza outbreaks and seasonal demand cycles, creates supply and pricing volatility for downstream powder markets.
Pharmaceutical and Biotech Applications
Pharmaceutical grade ovalbumin used in vaccine adjuvants and as research proteins commands premium pricing due to purity specs, GMP manufacturing and regulatory paperwork requirements.
Plant-Based Alternative Competition
Plant-based egg replacers are emerging for some food manufacturing applications. However, ovalbumin foaming and emulsification performance remains superior for many bakery and confectionery formulations.
Analysis of Ovalbumin Powder Market By Key Countries
.webp "Top Country Growth Comparison Ovalbumin Powder Market Cagr (2026 2036)")
| Country | CAGR |
|---|---|
| India | 6.6% |
| Germany | 5.9% |
| China | 5.8% |
| Japan | 4.4% |
| USA | 3.5% |
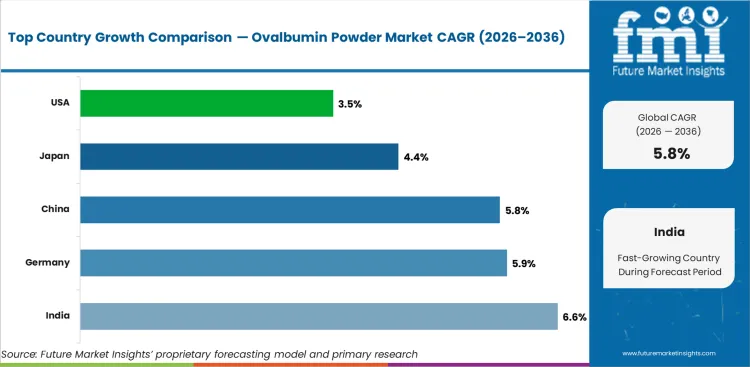
- India is in first place with a 6.6% CAGR, supported by expanding food processing manufacturing capacity and growing demand for functional food ingredients.
- Germany at 5.9% shows strong demand supported by established food processing industry concentration and pharmaceutical-grade ovalbumin demand.
Regional demand reflects food manufacturing scale, egg processing infrastructure, and pharmaceutical production. South Asia leads growth, while East Asia and Europe sustain established demand.
Demand Outlook for Ovalbumin Powder Market in India
India leads at 6.6% CAGR through 2036. Expanding food processing capacity, growing bakery and confectionery production, and increasing functional ingredient adoption create sustained demand.
- Food processing manufacturing expansion creates growing demand for standardized egg protein ingredients.
- Bakery and confectionery production growth increases ovalbumin consumption for foaming and emulsification.
- Growing organized food manufacturing adoption of functional ingredients expands the addressable market.
Future Outlook for Ovalbumin Powder Market in Germany
Germany is projected to grow at 5.9% CAGR through 2036. Food processing concentration, pharmaceutical applications, and EU food safety standards sustain demand.
- Food processing industry concentration sustains steady ovalbumin powder procurement for bakery and confectionery.
- Pharmaceutical-grade ovalbumin demand from biotech and vaccine production provides higher-margin applications.
- EU food safety regulations maintain ingredient specification standards for ovalbumin powder quality.
Opportunity Analysis of Ovalbumin Powder Market in China
China is projected to grow at 5.8% CAGR through 2036. Domestic food processing scale and growing functional ingredient adoption sustain demand.
- Food processing scale generates large procurement volumes for egg-derived protein ingredients.
- Growing bakery and confectionery production increases ovalbumin demand for foaming functionality.
- Domestic egg processing capacity supports local ovalbumin powder production development.
In-depth Analysis of Ovalbumin Powder Market in Japan
Japan is projected to grow at 4.4% CAGR through 2036. Kewpie Corporation leadership, established egg processing, and food manufacturing quality standards sustain demand.
- Kewpie Corporation maintains leadership through integrated egg processing and ovalbumin production.
- Food manufacturing quality standards sustain demand for high-specification ovalbumin powder.
- Pharmaceutical and biotechnology applications provide higher-margin consumption pathways.
Sales Analysis of Ovalbumin Powder Market in the United States
The USA is projected to grow at 3.5% CAGR through 2036. Established food processing, pharmaceutical applications, and research demand sustain mature market.
- Food processing demand sustains baseline ovalbumin procurement for bakery and confectionery production.
- Rose Acre Farms and domestic egg processors maintain competitive US supply positions.
- Pharmaceutical and research-grade ovalbumin provides higher-margin demand from biotech applications.
Competitive Landscape and Strategic Positioning
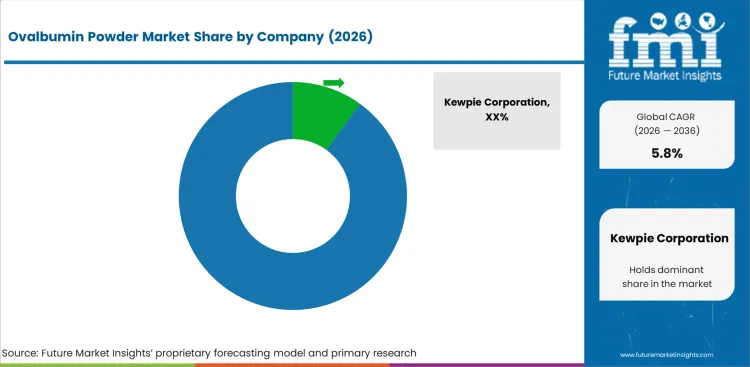
- Kewpie Corporation (10.0%) leads through integrated egg processing and ovalbumin production with established Asian and global food manufacturer supply relationships.
- Rose Acre Farms and Bouwhuis Enthoven compete through egg processing scale and regional food ingredient distribution.
- Market is fragmented, with egg processors competing alongside specialty ingredient suppliers.
Key Companies in the Ovalbumin Powder Market
Key global companies leading the ovalbumin powder market include:
- Kewpie Corporation, Rose Acre Farms, Bouwhuis Enthoven maintain leading positions through established manufacturing infrastructure, distribution networks, and product breadth.
- Ovostar Union, Dalian Hanovo Foods Co., Ltd., Thermo Fisher Scientific hold strong regional or segment-specific positions with specialized capabilities.
- Neova Technologies Inc., Merck & Co. Inc., Igreca S.A. represent emerging players expanding through technology innovation and niche market positioning.
Competitive Benchmarking: Ovalbumin Powder Market
| Company | Egg Processing Integration | Grade Portfolio | Food Safety Certification | Geographic Coverage |
|---|---|---|---|---|
| Kewpie Corporation | Very High | High | Strong | Asia, Global |
| Rose Acre Farms | Very High | Medium | Strong | N. America |
| Bouwhuis Enthoven | High | Medium | Strong | Europe |
| Ovostar Union | High | Medium | Moderate | Europe |
| Dalian Hanovo Foods | High | Medium | Moderate | Asia |
| Thermo Fisher Scientific | Low | Very High | Strong | Global |
| Neova Technologies | Medium | High | Moderate | N. America |
| Merck & Co. Inc. | Low | Very High | Strong | Global |
Source: Future Market Insights competitive analysis, 2026.
Key Developments in Ovalbumin Powder Market
- In 2025, Kewpie Corporation strengthened its egg-derived ingredient production capabilities across its manufacturing operations in Japan to support growing demand for functional food applications in the Asia-Pacific region. Leveraging its proprietary processing and spray-drying technologies, the company expanded the availability of high-purity egg white protein ingredients with enhanced emulsifying, gelling, and foam-stability properties for bakery, confectionery, and clean-label food manufacturers.
- In 2025, Thermo Fisher Scientific expanded its portfolio of pharmaceutical-grade ovalbumin products for vaccine research, immunology, and biotechnology applications. The enhanced range-including specialized lyophilized, activated, and fluorescently labeled ovalbumin formats-was designed to provide high biochemical consistency and low endotoxin levels for contract research organizations (CROs) and biopharmaceutical research workflows.
Key Players in the Ovalbumin Powder Market
Major Global Players
- Kewpie Corporation
- Rose Acre Farms
- Bouwhuis Enthoven
- Ovostar Union
- Dalian Hanovo Foods Co., Ltd.
- Thermo Fisher Scientific
Emerging Players/Startups
- Neova Technologies Inc.
- Merck & Co. Inc.
- Igreca S.A.
- Sanovo Technology Group
- Rembrandt Foods
Report Scope and Coverage
| Parameter | Details |
|---|---|
| Quantitative Units | USD 37.66 billion to USD 66.19 billion, at a CAGR of 5.8% |
| Market Definition | The ovalbumin powder market includes food grade, pharmaceutical grade, and industrial grade spray-dried egg white protein powder derived primarily from chicken eggs, used as a functional ingredient in food manufacturing, pharmaceutical and biotechnology applications, and animal nutrition. |
| Regions Covered | North America, Latin America, Europe, East Asia, South Asia and Pacific, Middle East and Africa |
| Countries Covered | India, Germany, China, Japan, USA, 30 plus countries |
| Key Companies Profiled | Kewpie Corporation, Rose Acre Farms, Bouwhuis Enthoven, Ovostar Union, Dalian Hanovo Foods Co., Ltd., Thermo Fisher Scientific, Neova Technologies Inc., Merck & Co. Inc., Modernist Pantry, LLC., Huzhou Zhenlu Biological Products Co., Ltd. |
| Forecast Period | 2026 to 2036 |
| Approach | Hybrid bottom-up and top-down methodology starting with verified transaction data, projecting adoption velocity across segments and regions. |
Market Segmentation Analysis
Ovalbumin Powder Market Segmented by Product:
- Food Grade Ovalbumin Powder
- Standard Food Grade
- Bakery Applications
- Confectionery Applications
- High Purity Food Grade
- Protein Fortification
- Functional Food Applications
- Standard Food Grade
- Pharmaceutical Grade Ovalbumin Powder
- Research Grade
- Laboratory Applications
- Clinical Research Applications
- Biotechnology Grade
- Vaccine Development
- Cell Culture Applications
- Research Grade
- Industrial Grade Ovalbumin Powder
- Technical Grade
- Industrial Processing
- Specialty Applications
- Technical Grade
Ovalbumin Powder Market Segmented by Application:
- Food And Beverage
- Bakery Products
- Cakes And Pastries
- Bread Products
- Confectionery Products
- Candies
- Dessert Products
- Protein Fortified Foods
- Sports Nutrition Products
- Functional Foods
- Bakery Products
- Pharmaceuticals And Biotechnology
- Vaccine Production
- Antigen Development
- Immunology Applications
- Drug Formulation
- Protein Based Formulations
- Stabilizing Agents
- Vaccine Production
- Animal Feed
- Pet Food
- Premium Pet Nutrition
- Protein Supplements
- Livestock Feed
- Poultry Feed
- Aquaculture Feed
- Pet Food
Ovalbumin Powder Market Segmented by End Use:
- Food Manufacturers
- Bakery Companies
- Industrial Bakeries
- Artisanal Bakeries
- Processed Food Companies
- Snack Manufacturers
- Functional Food Producers
- Bakery Companies
- Pharmaceutical Companies
- Biotechnology Companies
- Vaccine Manufacturers
- Research Organizations
- Drug Manufacturers
- Protein Drug Producers
- Nutraceutical Producers
- Biotechnology Companies
- Animal Nutrition Companies
- Pet Food Manufacturers
- Premium Pet Food Brands
- Mass Market Pet Food Brands
- Feed Producers
- Livestock Feed Companies
- Aquaculture Feed Producers
- Pet Food Manufacturers
Ovalbumin Powder Market Segmented by Distribution Channel:
- Direct Sales
- Manufacturer To Industry
- Bulk Ingredient Supply
- Long Term Supply Agreements
- Strategic Ingredient Partnerships
- Customized Ingredient Solutions
- Contract Manufacturing Supply
- Manufacturer To Industry
- Distributors
- Food Ingredient Distributors
- Regional Distributors
- Global Distributors
- Online Ingredient Platforms
- B2B Ingredient Platforms
- Industrial Procurement Portals
- Food Ingredient Distributors
Ovalbumin Powder Market Segmented by Source:
- Chicken Egg Derived Ovalbumin
- Conventional Egg Source
- Commercial Poultry Farms
- Industrial Egg Processing
- Specialty Egg Source
- Organic Eggs
- Free Range Eggs
- Conventional Egg Source
- Alternative Sources
- Recombinant Production
- Biotechnology Based Production
- Synthetic Protein Production
- Recombinant Production
Ovalbumin Powder Market by Region:
- North America
- USA
- Canada
- Mexico
- Latin America
- Brazil
- Chile
- Rest of Latin America
- Western Europe
- Germany
- UK
- Italy
- Spain
- France
- Nordic
- BENELUX
- Rest of Western Europe
- Eastern Europe
- Russia
- Poland
- Hungary
- Balkan & Baltic
- Rest of Eastern Europe
- East Asia
- China
- Japan
- South Korea
- South Asia and Pacific
- India
- ASEAN
- Australia & New Zealand
- Rest of South Asia and Pacific
- Middle East & Africa
- Kingdom of Saudi Arabia
- Other GCC Countries
- Turkiye
- South Africa
- Other African Union
- Rest of Middle East & Africa
Research Sources and Bibliography
- 1. Food and Agriculture Organization. (2025). FAO Global Egg Production and Processing Statistics. FAO.
- 2. European Commission. (2024). EU Regulation on Egg Products: Processing and Safety Standards. EC.
- 3. USA Food and Drug Administration. (2025). FDA GRAS Notification: Egg White Protein Products. FDA.
- 4. International Egg Commission. (2025). IEC Annual Review: Global Egg Industry Production Data. IEC.
- 5. USA Pharmacopeia. (2024). USP Monograph: Ovalbumin Quality Standards for Pharmaceutical Applications. USP.
This bibliography is provided for reader reference. The full Future Market Insights report contains the complete reference list with publication dates, URLs, and supporting data for all cited works.
This Report Answers
- Estimating the size of the market and revenue projections from 2026 to 2036.
- Segmentation by product, application, end use, distribution channel, and source.
- Insights about more than 30 country markets.
- Analysis of food manufacturing demand and pharmaceutical application trends.
- Assessment of the competitive landscape and egg processing integration advantages.
- Finding investment opportunities in food grade, pharmaceutical grade, and emerging market segments.
- Tracking egg supply chain economics and avian influenza impact on availability.
- Delivery of data in PDF and Excel formats.
Frequently Asked Questions
How big is the ovalbumin powder market in 2026?
The global ovalbumin powder market is estimated to be valued at USD 37.66 billion in 2026.
What will be the size of ovalbumin powder market in 2036?
The market size for the ovalbumin powder market is projected to reach USD 66.19 billion by 2036.
How much will be the ovalbumin powder market growth between 2026 and 2036?
The ovalbumin powder market is expected to grow at a 5.8% CAGR between 2026 and 2036.
What are the key product types in the ovalbumin powder market?
The key product types in ovalbumin powder market are food grade ovalbumin powder, pharmaceutical grade ovalbumin powder and industrial grade ovalbumin powder.
Which application segment is expected to contribute significant share in the ovalbumin powder market in 2026?
In terms of application, food and beverage segment is expected to command 65.0% share in the ovalbumin powder market in 2026.
Preview the report firsthand - request a free sample
Get SampleGet the brochure for pricing and purchase details.
Get PDFTable of Content
- Executive Summary
- Global Market Outlook
- Demand-side Trends
- Supply-side Trends
- Technology Roadmap Analysis
- Analysis and Recommendations
- Market Overview
- Market Coverage / Taxonomy
- Market Definition / Scope / Limitations
- Research Methodology
- Chapter Orientation
- Analytical Lens and Working Hypotheses
- Market Structure, Signals, and Trend Drivers
- Benchmarking and Cross-market Comparability
- Market Sizing, Forecasting, and Opportunity Mapping
- Research Design and Evidence Framework
- Desk Research Programme (Secondary Evidence)
- Company Annual and Sustainability Reports
- Peer-reviewed Journals and Academic Literature
- Corporate Websites, Product Literature, and Technical Notes
- Earnings Decks and Investor Briefings
- Statutory Filings and Regulatory Disclosures
- Technical White Papers and Standards Notes
- Trade Journals, Industry Magazines, and Analyst Briefs
- Conference Proceedings, Webinars, and Seminar Materials
- Government Statistics Portals and Public Data Releases
- Press Releases and Reputable Media Coverage
- Specialist Newsletters and Curated Briefings
- Sector Databases and Reference Repositories
- FMI Internal Proprietary Databases and Historical Market Datasets
- Subscription Datasets and Paid Sources
- Social Channels, Communities, and Digital Listening Inputs
- Additional Desk Sources
- Expert Input and Fieldwork (Primary Evidence)
- Primary Modes
- Qualitative Interviews and Expert Elicitation
- Quantitative Surveys and Structured Data Capture
- Blended Approach
- Why Primary Evidence is Used
- Field Techniques
- Interviews
- Surveys
- Focus Groups
- Observational and In-context Research
- Social and Community Interactions
- Stakeholder Universe Engaged
- C-suite Leaders
- Board Members
- Presidents and Vice Presidents
- R&D and Innovation Heads
- Technical Specialists
- Domain Subject-matter Experts
- Scientists
- Physicians and Other Healthcare Professionals
- Governance, Ethics, and Data Stewardship
- Research Ethics
- Data Integrity and Handling
- Primary Modes
- Tooling, Models, and Reference Databases
- Desk Research Programme (Secondary Evidence)
- Data Engineering and Model Build
- Data Acquisition and Ingestion
- Cleaning, Normalisation, and Verification
- Synthesis, Triangulation, and Analysis
- Quality Assurance and Audit Trail
- Market Background
- Market Dynamics
- Drivers
- Restraints
- Opportunity
- Trends
- Scenario Forecast
- Demand in Optimistic Scenario
- Demand in Likely Scenario
- Demand in Conservative Scenario
- Opportunity Map Analysis
- Product Life Cycle Analysis
- Supply Chain Analysis
- Investment Feasibility Matrix
- Value Chain Analysis
- PESTLE and Porter’s Analysis
- Regulatory Landscape
- Regional Parent Market Outlook
- Production and Consumption Statistics
- Import and Export Statistics
- Market Dynamics
- Global Market Analysis 2021 to 2025 and Forecast, 2026 to 2036
- Historical Market Size Value (USD Million) Analysis, 2021 to 2025
- Current and Future Market Size Value (USD Million) Projections, 2026 to 2036
- Y-o-Y Growth Trend Analysis
- Absolute $ Opportunity Analysis
- Global Market Pricing Analysis 2021 to 2025 and Forecast 2026 to 2036
- Global Market Analysis 2021 to 2025 and Forecast 2026 to 2036, By Product
- Introduction / Key Findings
- Historical Market Size Value (USD Million) Analysis By Product , 2021 to 2025
- Current and Future Market Size Value (USD Million) Analysis and Forecast By Product , 2026 to 2036
- Food Grade Ovalbumin Powder
- Standard Food Grade
- Bakery Applications
- Confectionery Applications
- High Purity Food Grade
- Protein Fortification
- Functional Food Applications
- Food Grade Ovalbumin Powder
- Y-o-Y Growth Trend Analysis By Product , 2021 to 2025
- Absolute $ Opportunity Analysis By Product , 2026 to 2036
- Global Market Analysis 2021 to 2025 and Forecast 2026 to 2036, By Application
- Introduction / Key Findings
- Historical Market Size Value (USD Million) Analysis By Application, 2021 to 2025
- Current and Future Market Size Value (USD Million) Analysis and Forecast By Application, 2026 to 2036
- Food And Beverage
- Bakery Products
- Cakes And Pastries
- Bread Products
- Confectionery Products
- Candies
- Dessert Products
- Protein Fortified Foods
- Sports Nutrition Products
- Functional Foods
- Pharmaceuticals And Biotechnology
- Vaccine Production
- Antigen Development
- Immunology Applications
- Drug Formulation
- Protein Based Formulations
- Animal Feed
- Pet Food
- Premium Pet Nutrition
- Protein Supplements
- Livestock Feed
- Poultry Feed
- Food And Beverage
- Y-o-Y Growth Trend Analysis By Application, 2021 to 2025
- Absolute $ Opportunity Analysis By Application, 2026 to 2036
- Global Market Analysis 2021 to 2025 and Forecast 2026 to 2036, By End Use
- Introduction / Key Findings
- Historical Market Size Value (USD Million) Analysis By End Use, 2021 to 2025
- Current and Future Market Size Value (USD Million) Analysis and Forecast By End Use, 2026 to 2036
- Food Manufacturers
- Bakery Companies
- Industrial Bakeries
- Artisanal Bakeries
- Processed Food Companies
- Snack Manufacturers
- Functional Food Producers
- Pharmaceutical Companies
- Biotechnology Companies
- Vaccine Manufacturers
- Research Organizations
- Drug Manufacturers
- Protein Drug Producers
- Animal Nutrition Companies
- Pet Food Manufacturers
- Premium Pet Food Brands
- Mass Market Pet Food Brands
- Feed Producers
- Livestock Feed Companies
- Food Manufacturers
- Y-o-Y Growth Trend Analysis By End Use, 2021 to 2025
- Absolute $ Opportunity Analysis By End Use, 2026 to 2036
- Global Market Analysis 2021 to 2025 and Forecast 2026 to 2036, By Distribution Channel
- Introduction / Key Findings
- Historical Market Size Value (USD Million) Analysis By Distribution Channel, 2021 to 2025
- Current and Future Market Size Value (USD Million) Analysis and Forecast By Distribution Channel, 2026 to 2036
- Direct Sales
- Manufacturer To Industry
- Bulk Ingredient Supply
- Long Term Supply Agreements
- Strategic Ingredient Partnerships
- Customized Ingredient Solutions
- Contract Manufacturing Supply
- Distributors
- Food Ingredient Distributors
- Regional Distributors
- Global Distributors
- Online Ingredient Platforms
- B2B Ingredient Platforms
- Direct Sales
- Y-o-Y Growth Trend Analysis By Distribution Channel, 2021 to 2025
- Absolute $ Opportunity Analysis By Distribution Channel, 2026 to 2036
- Global Market Analysis 2021 to 2025 and Forecast 2026 to 2036, By Source
- Introduction / Key Findings
- Historical Market Size Value (USD Million) Analysis By Source, 2021 to 2025
- Current and Future Market Size Value (USD Million) Analysis and Forecast By Source, 2026 to 2036
- Chicken Egg Derived Ovalbumin
- Conventional Egg Source
- Commercial Poultry Farms
- Industrial Egg Processing
- Specialty Egg Source
- Organic Eggs
- Free Range Eggs
- Alternative Sources
- Recombinant Production
- Biotechnology Based Production
- Synthetic Protein Production
- Chicken Egg Derived Ovalbumin
- Y-o-Y Growth Trend Analysis By Source, 2021 to 2025
- Absolute $ Opportunity Analysis By Source, 2026 to 2036
- Global Market Analysis 2021 to 2025 and Forecast 2026 to 2036, By Region
- Introduction
- Historical Market Size Value (USD Million) Analysis By Region, 2021 to 2025
- Current Market Size Value (USD Million) Analysis and Forecast By Region, 2026 to 2036
- North America
- Latin America
- Western Europe
- Eastern Europe
- East Asia
- South Asia and Pacific
- Middle East & Africa
- Market Attractiveness Analysis By Region
- North America Market Analysis 2021 to 2025 and Forecast 2026 to 2036, By Country
- Historical Market Size Value (USD Million) Trend Analysis By Market Taxonomy, 2021 to 2025
- Market Size Value (USD Million) Forecast By Market Taxonomy, 2026 to 2036
- By Country
- USA
- Canada
- Mexico
- By Product
- By Application
- By End Use
- By Distribution Channel
- By Source
- By Country
- Market Attractiveness Analysis
- By Country
- By Product
- By Application
- By End Use
- By Distribution Channel
- By Source
- Key Takeaways
- Latin America Market Analysis 2021 to 2025 and Forecast 2026 to 2036, By Country
- Historical Market Size Value (USD Million) Trend Analysis By Market Taxonomy, 2021 to 2025
- Market Size Value (USD Million) Forecast By Market Taxonomy, 2026 to 2036
- By Country
- Brazil
- Chile
- Rest of Latin America
- By Product
- By Application
- By End Use
- By Distribution Channel
- By Source
- By Country
- Market Attractiveness Analysis
- By Country
- By Product
- By Application
- By End Use
- By Distribution Channel
- By Source
- Key Takeaways
- Western Europe Market Analysis 2021 to 2025 and Forecast 2026 to 2036, By Country
- Historical Market Size Value (USD Million) Trend Analysis By Market Taxonomy, 2021 to 2025
- Market Size Value (USD Million) Forecast By Market Taxonomy, 2026 to 2036
- By Country
- Germany
- UK
- Italy
- Spain
- France
- Nordic
- BENELUX
- Rest of Western Europe
- By Product
- By Application
- By End Use
- By Distribution Channel
- By Source
- By Country
- Market Attractiveness Analysis
- By Country
- By Product
- By Application
- By End Use
- By Distribution Channel
- By Source
- Key Takeaways
- Eastern Europe Market Analysis 2021 to 2025 and Forecast 2026 to 2036, By Country
- Historical Market Size Value (USD Million) Trend Analysis By Market Taxonomy, 2021 to 2025
- Market Size Value (USD Million) Forecast By Market Taxonomy, 2026 to 2036
- By Country
- Russia
- Poland
- Hungary
- Balkan & Baltic
- Rest of Eastern Europe
- By Product
- By Application
- By End Use
- By Distribution Channel
- By Source
- By Country
- Market Attractiveness Analysis
- By Country
- By Product
- By Application
- By End Use
- By Distribution Channel
- By Source
- Key Takeaways
- East Asia Market Analysis 2021 to 2025 and Forecast 2026 to 2036, By Country
- Historical Market Size Value (USD Million) Trend Analysis By Market Taxonomy, 2021 to 2025
- Market Size Value (USD Million) Forecast By Market Taxonomy, 2026 to 2036
- By Country
- China
- Japan
- South Korea
- By Product
- By Application
- By End Use
- By Distribution Channel
- By Source
- By Country
- Market Attractiveness Analysis
- By Country
- By Product
- By Application
- By End Use
- By Distribution Channel
- By Source
- Key Takeaways
- South Asia and Pacific Market Analysis 2021 to 2025 and Forecast 2026 to 2036, By Country
- Historical Market Size Value (USD Million) Trend Analysis By Market Taxonomy, 2021 to 2025
- Market Size Value (USD Million) Forecast By Market Taxonomy, 2026 to 2036
- By Country
- India
- ASEAN
- Australia & New Zealand
- Rest of South Asia and Pacific
- By Product
- By Application
- By End Use
- By Distribution Channel
- By Source
- By Country
- Market Attractiveness Analysis
- By Country
- By Product
- By Application
- By End Use
- By Distribution Channel
- By Source
- Key Takeaways
- Middle East & Africa Market Analysis 2021 to 2025 and Forecast 2026 to 2036, By Country
- Historical Market Size Value (USD Million) Trend Analysis By Market Taxonomy, 2021 to 2025
- Market Size Value (USD Million) Forecast By Market Taxonomy, 2026 to 2036
- By Country
- Kingdom of Saudi Arabia
- Other GCC Countries
- Turkiye
- South Africa
- Other African Union
- Rest of Middle East & Africa
- By Product
- By Application
- By End Use
- By Distribution Channel
- By Source
- By Country
- Market Attractiveness Analysis
- By Country
- By Product
- By Application
- By End Use
- By Distribution Channel
- By Source
- Key Takeaways
- Key Countries Market Analysis
- USA
- Pricing Analysis
- Market Share Analysis, 2025
- By Product
- By Application
- By End Use
- By Distribution Channel
- By Source
- Canada
- Pricing Analysis
- Market Share Analysis, 2025
- By Product
- By Application
- By End Use
- By Distribution Channel
- By Source
- Mexico
- Pricing Analysis
- Market Share Analysis, 2025
- By Product
- By Application
- By End Use
- By Distribution Channel
- By Source
- Brazil
- Pricing Analysis
- Market Share Analysis, 2025
- By Product
- By Application
- By End Use
- By Distribution Channel
- By Source
- Chile
- Pricing Analysis
- Market Share Analysis, 2025
- By Product
- By Application
- By End Use
- By Distribution Channel
- By Source
- Germany
- Pricing Analysis
- Market Share Analysis, 2025
- By Product
- By Application
- By End Use
- By Distribution Channel
- By Source
- UK
- Pricing Analysis
- Market Share Analysis, 2025
- By Product
- By Application
- By End Use
- By Distribution Channel
- By Source
- Italy
- Pricing Analysis
- Market Share Analysis, 2025
- By Product
- By Application
- By End Use
- By Distribution Channel
- By Source
- Spain
- Pricing Analysis
- Market Share Analysis, 2025
- By Product
- By Application
- By End Use
- By Distribution Channel
- By Source
- France
- Pricing Analysis
- Market Share Analysis, 2025
- By Product
- By Application
- By End Use
- By Distribution Channel
- By Source
- India
- Pricing Analysis
- Market Share Analysis, 2025
- By Product
- By Application
- By End Use
- By Distribution Channel
- By Source
- ASEAN
- Pricing Analysis
- Market Share Analysis, 2025
- By Product
- By Application
- By End Use
- By Distribution Channel
- By Source
- Australia & New Zealand
- Pricing Analysis
- Market Share Analysis, 2025
- By Product
- By Application
- By End Use
- By Distribution Channel
- By Source
- China
- Pricing Analysis
- Market Share Analysis, 2025
- By Product
- By Application
- By End Use
- By Distribution Channel
- By Source
- Japan
- Pricing Analysis
- Market Share Analysis, 2025
- By Product
- By Application
- By End Use
- By Distribution Channel
- By Source
- South Korea
- Pricing Analysis
- Market Share Analysis, 2025
- By Product
- By Application
- By End Use
- By Distribution Channel
- By Source
- Russia
- Pricing Analysis
- Market Share Analysis, 2025
- By Product
- By Application
- By End Use
- By Distribution Channel
- By Source
- Poland
- Pricing Analysis
- Market Share Analysis, 2025
- By Product
- By Application
- By End Use
- By Distribution Channel
- By Source
- Hungary
- Pricing Analysis
- Market Share Analysis, 2025
- By Product
- By Application
- By End Use
- By Distribution Channel
- By Source
- Kingdom of Saudi Arabia
- Pricing Analysis
- Market Share Analysis, 2025
- By Product
- By Application
- By End Use
- By Distribution Channel
- By Source
- Turkiye
- Pricing Analysis
- Market Share Analysis, 2025
- By Product
- By Application
- By End Use
- By Distribution Channel
- By Source
- South Africa
- Pricing Analysis
- Market Share Analysis, 2025
- By Product
- By Application
- By End Use
- By Distribution Channel
- By Source
- USA
- Market Structure Analysis
- Competition Dashboard
- Competition Benchmarking
- Market Share Analysis of Top Players
- By Regional
- By Product
- By Application
- By End Use
- By Distribution Channel
- By Source
- Competition Analysis
- Competition Deep Dive
- Kewpie Corporation
- Overview
- Product Portfolio
- Profitability by Market Segments (Product/Age /Sales Channel/Region)
- Sales Footprint
- Strategy Overview
- Marketing Strategy
- Product Strategy
- Channel Strategy
- Rose Acre Farms
- Bouwhuis Enthoven
- Ovostar Union
- Dalian Hanovo Foods Co., Ltd.
- Thermo Fisher Scientific
- Neova Technologies Inc.
- Merck & Co. Inc.
- Modernist Pantry, LLC.
- Huzhou Zhenlu Biological Products Co., Ltd.
- Research Products International Corporation
- Other Emerging Players
- Kewpie Corporation
- Competition Deep Dive
- Assumptions & Acronyms Used


