Reports
- Global Locations -
Headquarters
Future Market Insights, Inc.
Christiana Corporate, 200
Continental Drive, Suite 401,
Newark, Delaware - 19713,
United States
Americas
Future Market Insights, Inc.
616 Corporate Way, Suite 2-9018,
Valley Cottage, NY 10989, United States
MEA
Future Market Insights
1602-6 Jumeirah Bay X2 Tower, Plot No: JLT-PH2-X2A,
Jumeirah Lakes Towers, Dubai,
United Arab Emirates
Europe
Future Market Insights
3rd Floor, 207 Regent Street,
W1B 3HH London
United Kingdom
Asia Pacific
Future Market Insights
Office No. 401-A, 4th Floor,
VANTAGE 9, S.No. 36/1/1,
Baner, Pune 411045, India
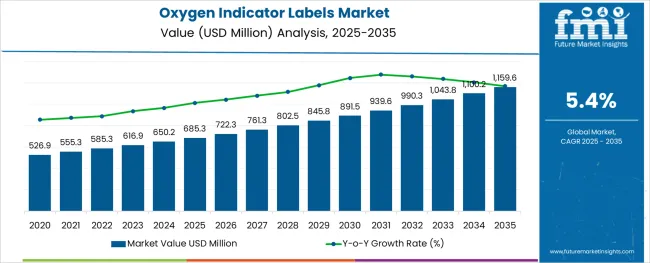
[340 Pages Report] The global oxygen indicator labels market size is expected to reach US$ 989.3 Million in 2032. The oxygen indicator labels market is growing rapidly. As per FMI Analysts, the global Oxygen indicator labels market is estimated to be valued at US$ 585.3 Million in 2022 and is projected to increase at a CAGR of 5.4% in the forecast period from 2022 to 2032.
Report Attribute | Details |
---|---|
Oxygen Indicator Labels Market Estimated Base Year Value (2021) | US$ 555.31 Million |
Oxygen Indicator Labels Market Expected Market Value (2022) | US$ 585.3 Million |
Oxygen Indicator Labels Market Anticipated Forecast Value (2032) | US$ 989.3 Million |
Oxygen Indicator Labels Market Projected Growth Rate (2022-2032) | 5.4% CAGR |
The oxygen indicator label is a type of smart label that is self-adhesive and contains an invisible liquid that changes colors when oxygen is not present. Oxygen indicator labels are designed to indicate that radiation, exposure to prescribed amounts of gas, time, and sunlight have taken place.
Oxygen indicator labels play a significant role in ensuring the quality and freshness of food products. Increasing consumer interest in natural and organic products is forcing oxygen indicator labels to grow rapidly and affecting the market size of the oxygen indicator label market. During packaging, various technologies are employed to enhance the atmosphere in which food products are stored and increase their shelf life.
Labels that indicate the content of oxygen are one of the best preserving techniques as they are adapted to the packaging container to improve preservation. Labels that indicate oxygen use a color change technique that is extremely versatile and signals that the modified atmosphere inside the package has been maintained.
Oxygen indicator labels are a subclass of analytical packaging and can be used for real-time monitoring and shelf-life estimation. Manufacturers and brand owners are adopting a variety of smart packaging technologies developed recently. Growing online food retail has led to an increase in demand for oxygen indicator labels.
With a market share worth 39%, North America is expected to lead numerous regions due to the high consumer acceptance of intelligent packaging technologies. The oxygen indicator labels market in Western Europe, with a market share of 29%, will also see high growth due to the increased demand for case-ready meals.
Don't pay for what you don't need
Customize your report by selecting specific countries or regions and save 30%!
The oxygen indicator labels market has received a lot of traction in the industry. Oxygen indicator labels are experiencing high growth as consumers become increasingly interested in natural and organic products, propelling sales of oxygen indicator labels.
Oxygen indicator labels are crucial to ensuring the freshness and quality of food products. Various technologies transform the atmosphere in which food products are stored during packaging to maintain their quality and maximize their shelf life.
The oxygen indicator labels use a very diverse and easy-to-use technology that uses the change in color method to indicate that the modified atmosphere has been maintained within the packaging containers. The label uses a preserving technique in which different seasoning agents are adapted within packaging containers.
The oxygen indicator labels offer a perfect indication that the modified atmosphere has been maintained inside the packaging containers; such factors drive the growth of the oxygen indicator labels market.
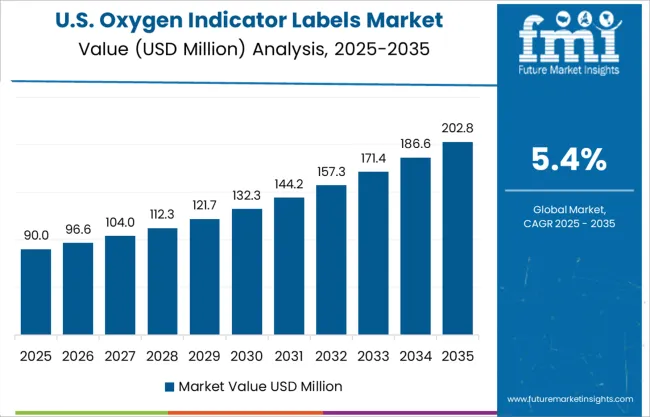
As of now, North America dominates the global oxygen indicator labels market with a 39% share value, thanks to consumer acceptance of intelligent packaging technologies.
In recent years, a wide range of intelligent packaging technologies has been developed that manufacturers and brand owners are already using. The oxygen indicator label belongs to the analytical packaging category as a member of intelligent packaging. These oxygen indicator labels are used for safety and can be applied directly to the shelf life of food. Growing online food retail has led to an increase in demand for oxygen indicator labels.
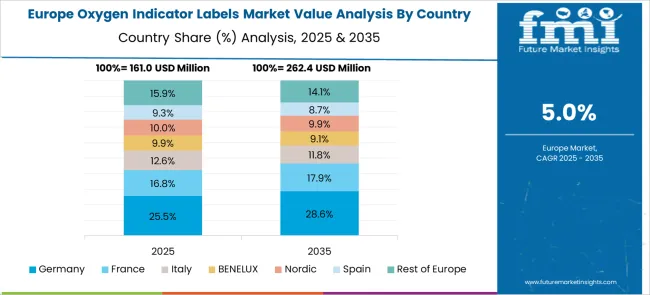
Besides North America, the Western Europe oxygen indicator labels market has a market share value of 29% and is expected to grow rapidly due to the growing demand for oxygen indicator labels. It is also expected that Africa will significantly contribute to the growth of the oxygen indicator labels market during the forecast period.
A large-scale oxygen indicator developed by Saarinen et al. (2017) relies on colorimetric changes, is activated by ultraviolet light, and can be printed or attached to the inside of packaging materials to provide an inexpensive leak indication; such developments are generating new opportunities in the oxygen indicator labels market.
According to Vu and Won (2013), ozone indicator labels can recover their original color if exposed to UV light. They have also developed a way to prevent the dye from seeping out when ozone indicator labels are exposed to UV light.
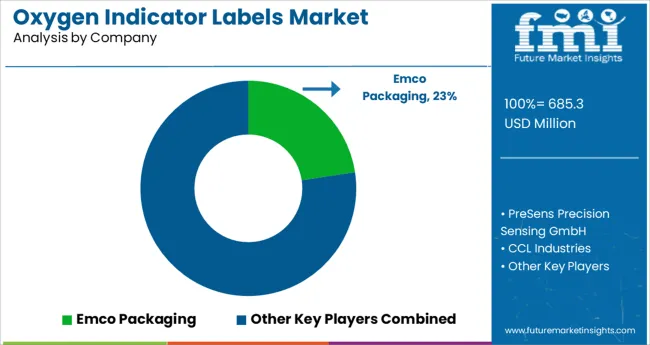
Some of the leading companies operating in the global membrane filter cartridge market include Emco Packaging and PreSens Precision Sensing GmbH.
According to the Packaging and Packaging Waste Directive (European Commission, 2018), European Union companies should ensure the environmental impact of the packaging operations they conduct. Waste Reduction Model (WARM; version 13) is US EPA's model for managing end-of-life food and waste [US EPA (U.S. Environmental Protection Agency), 2015].
In an attempt to find a cheaper MAP leak indicator, Saarinen et al. (2017) developed a large-scale oxygen indicator based on a colorimetric change and activated by ultraviolet light. The label can be attached to packaging material or printed on the packaging itself.
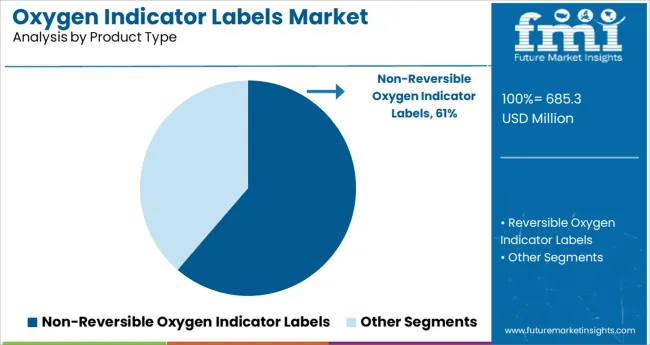
Emco Packaging developed a non-reversible oxygen indicator label for modified atmosphere packaging to indicate any leaks. OxySense uses luminescence to indicate leaks in modified atmosphere packaging; such developments are shifting the start-up ecosystem of the oxygen indicator labels market.
Get the data you need at a Fraction of the cost
Personalize your report by choosing insights you need
and save 40%!
Some of the leading companies operating in the global oxygen indicator labels market include Emco Packaging and PreSens Precision Sensing GmbH.
To alert customers of leaks in modified atmosphere packaging, OxySense is a commercial luminescence indicator label, and Emco Packaging developed non-reversible O2 indicators.
In the USA, industries follow the US EPA's Waste Reduction Model (WARM; version 13) as their waste management model at the end of the life cycle of food and waste. The Packaging and Packaging Waste Directive (European Commission, 2018) requires companies in the European Union to minimize their environmental impact when packaging their products.
As part of their project, Vu and Won (2013) developed an O2 indicator that is activated by ultraviolet light and can recover its original color under oxygen conditions. They also found a way to prevent dye from seeping out of the O2 indicator labels by utilizing alginate.
Report Attribute | Details |
---|---|
Growth Rate | CAGR of 5.4% from 2022 to 2032 |
Base Year for Estimation | 2021 |
Historical Data | 2015-2021 |
Forecast Period | 2022-2032 |
Quantitative Units | Revenue in USD Million and CAGR from 2022-2032 |
Report Coverage | Revenue Forecast, Volume Forecast, Company Ranking, Competitive Landscape, Growth Factors, Trends and Pricing Analysis |
Segments Covered |
|
Regions Covered |
|
Key Countries Profiled |
|
Key Companies Profiled | |
Customization | Available Upon Request |
1. Executive Summary 1.1. Global Market Outlook 1.2. Demand-side Trends 1.3. Supply-side Trends 1.4. Technology Roadmap Analysis 1.5. Analysis and Recommendations 2. Market Overview 2.1. Market Coverage / Taxonomy 2.2. Market Definition / Scope / Limitations 3. Market Background 3.1. Market Dynamics 3.1.1. Drivers 3.1.2. Restraints 3.1.3. Opportunity 3.1.4. Trends 3.2. Scenario Forecast 3.2.1. Demand in Optimistic Scenario 3.2.2. Demand in Likely Scenario 3.2.3. Demand in Conservative Scenario 3.3. Opportunity Map Analysis 3.4. Product Life Cycle Analysis 3.5. Supply Chain Analysis 3.5.1. Supply Side Participants and their Roles 3.5.1.1. Producers 3.5.1.2. Mid-Level Participants (Traders/ Agents/ Brokers) 3.5.1.3. Wholesalers and Distributors 3.5.2. Value Added and Value Created at Node in the Supply Chain 3.5.3. List of Raw Material Suppliers 3.5.4. List of Existing and Potential Buyer’s 3.6. Investment Feasibility Matrix 3.7. Value Chain Analysis 3.7.1. Profit Margin Analysis 3.7.2. Wholesalers and Distributors 3.7.3. Retailers 3.8. PESTLE and Porter’s Analysis 3.9. Regulatory Landscape 3.9.1. By Key Regions 3.9.2. By Key Countries 3.10. Regional Parent Market Outlook 3.11. Production and Consumption Statistics 3.12. Import and Export Statistics 4. Global Oxygen Indicator Labels Market Analysis 2017-2021 and Forecast, 2022-2032 4.1. Historical Market Size Value (US$ Mn) & Volume (Sq. Mtr) Analysis, 2017-2021 4.2. Current and Future Market Size Value (US$ Mn) & Volume (Sq. Mtr) Projections, 2022-2032 4.2.1. Y-o-Y Growth Trend Analysis 4.2.2. Absolute $ Opportunity Analysis 5. Global Oxygen Indicator Labels Market Analysis 2017-2021 and Forecast 2022-2032, By Product Type 5.1. Introduction / Key Findings 5.2. Historical Market Size Value (US$ Mn) & Volume (Sq. Mtr) Analysis By Product Type, 2017-2021 5.3. Current and Future Market Size Value (US$ Mn) & Volume (Sq. Mtr) Analysis and Forecast By Product Type, 2022-2032 5.3.1. Reversible Oxygen Indicator Labels 5.3.2. Non Reversible Oxygen Indicator Labels 5.4. Y-o-Y Growth Trend Analysis By Product Type, 2017-2021 5.5. Absolute $ Opportunity Analysis By Product Type, 2022-2032 6. Global Oxygen Indicator Labels Market Analysis 2017-2021 and Forecast 2022-2032, By Application 6.1. Introduction / Key Findings 6.2. Historical Market Size Value (US$ Mn) & Volume (Sq. Mtr) Analysis By Application, 2017-2021 6.3. Current and Future Market Size Value (US$ Mn) & Volume (Sq. Mtr) Analysis and Forecast By Application, 2022-2032 6.3.1. Cheese 6.3.2. Sliced and Cooked Meat 6.3.3. Bread 6.3.4. Catering Pack 6.3.5. Airline Meals 6.3.6. Others 6.4. Y-o-Y Growth Trend Analysis By Application, 2017-2021 6.5. Absolute $ Opportunity Analysis By Application, 2022-2032 7. Global Oxygen Indicator Labels Market Analysis 2017-2021 and Forecast 2022-2032, By Region 7.1. Introduction 7.2. Historical Market Size Value (US$ Mn) & Volume (Sq. Mtr) Analysis By Region, 2017-2021 7.3. Current Market Size Value (US$ Mn) & Volume (Sq. Mtr) Analysis and Forecast By Region, 2022-2032 7.3.1. North America 7.3.2. Latin America 7.3.3. Europe 7.3.4. Asia Pacific 7.3.5. MEA 7.4. Market Attractiveness Analysis By Region 8. North America Oxygen Indicator Labels Market Analysis 2017-2021 and Forecast 2022-2032, By Country 8.1. Historical Market Size Value (US$ Mn) & Volume (Sq. Mtr) Trend Analysis By Market Taxonomy, 2017-2021 8.2. Market Size Value (US$ Mn) & Volume (Sq. Mtr) Forecast By Market Taxonomy, 2022-2032 8.2.1. By Country 8.2.1.1. U.S. 8.2.1.2. Canada 8.2.2. By Product Type 8.2.3. By Application 8.3. Market Attractiveness Analysis 8.3.1. By Country 8.3.2. By Product Type 8.3.3. By Application 8.4. Key Takeaways 9. Latin America Oxygen Indicator Labels Market Analysis 2017-2021 and Forecast 2022-2032, By Country 9.1. Historical Market Size Value (US$ Mn) & Volume (Sq. Mtr) Trend Analysis By Market Taxonomy, 2017-2021 9.2. Market Size Value (US$ Mn) & Volume (Sq. Mtr) Forecast By Market Taxonomy, 2022-2032 9.2.1. By Country 9.2.1.1. Brazil 9.2.1.2. Mexico 9.2.1.3. Rest of Latin America 9.2.2. By Product Type 9.2.3. By Application 9.3. Market Attractiveness Analysis 9.3.1. By Country 9.3.2. By Product Type 9.3.3. By Application 9.4. Key Takeaways 10. Europe Oxygen Indicator Labels Market Analysis 2017-2021 and Forecast 2022-2032, By Country 10.1. Historical Market Size Value (US$ Mn) & Volume (Sq. Mtr) Trend Analysis By Market Taxonomy, 2017-2021 10.2. Market Size Value (US$ Mn) & Volume (Sq. Mtr) Forecast By Market Taxonomy, 2022-2032 10.2.1. By Country 10.2.1.1. Germany 10.2.1.2. U.K. 10.2.1.3. France 10.2.1.4. Spain 10.2.1.5. Italy 10.2.1.6. Rest of Europe 10.2.2. By Product Type 10.2.3. By Application 10.3. Market Attractiveness Analysis 10.3.1. By Country 10.3.2. By Product Type 10.3.3. By Application 10.4. Key Takeaways 11. Asia Pacific Oxygen Indicator Labels Market Analysis 2017-2021 and Forecast 2022-2032, By Country 11.1. Historical Market Size Value (US$ Mn) & Volume (Sq. Mtr) Trend Analysis By Market Taxonomy, 2017-2021 11.2. Market Size Value (US$ Mn) & Volume (Sq. Mtr) Forecast By Market Taxonomy, 2022-2032 11.2.1. By Country 11.2.1.1. China 11.2.1.2. Japan 11.2.1.3. South Korea 11.2.1.4. Malaysia 11.2.1.5. Singapore 11.2.1.6. Australia 11.2.1.7. New Zealand 11.2.1.8. Rest of APAC 11.2.2. By Product Type 11.2.3. By Application 11.3. Market Attractiveness Analysis 11.3.1. By Country 11.3.2. By Product Type 11.3.3. By Application 11.4. Key Takeaways 12. MEA Oxygen Indicator Labels Market Analysis 2017-2021 and Forecast 2022-2032, By Country 12.1. Historical Market Size Value (US$ Mn) & Volume (Sq. Mtr) Trend Analysis By Market Taxonomy, 2017-2021 12.2. Market Size Value (US$ Mn) & Volume (Sq. Mtr) Forecast By Market Taxonomy, 2022-2032 12.2.1. By Country 12.2.1.1. GCC Countries 12.2.1.2. South Africa 12.2.1.3. Israel 12.2.1.4. Rest of MEA 12.2.2. By Product Type 12.2.3. By Application 12.3. Market Attractiveness Analysis 12.3.1. By Country 12.3.2. By Product Type 12.3.3. By Application 12.4. Key Takeaways 13. Key Countries Oxygen Indicator Labels Market Analysis 13.1. U.S. 13.1.1. Pricing Analysis 13.1.2. Market Share Analysis, 2021 13.1.2.1. By Product Type 13.1.2.2. By Application 13.2. Canada 13.2.1. Pricing Analysis 13.2.2. Market Share Analysis, 2021 13.2.2.1. By Product Type 13.2.2.2. By Application 13.3. Brazil 13.3.1. Pricing Analysis 13.3.2. Market Share Analysis, 2021 13.3.2.1. By Product Type 13.3.2.2. By Application 13.4. Mexico 13.4.1. Pricing Analysis 13.4.2. Market Share Analysis, 2021 13.4.2.1. By Product Type 13.4.2.2. By Application 13.5. Germany 13.5.1. Pricing Analysis 13.5.2. Market Share Analysis, 2021 13.5.2.1. By Product Type 13.5.2.2. By Application 13.6. U.K. 13.6.1. Pricing Analysis 13.6.2. Market Share Analysis, 2021 13.6.2.1. By Product Type 13.6.2.2. By Application 13.7. France 13.7.1. Pricing Analysis 13.7.2. Market Share Analysis, 2021 13.7.2.1. By Product Type 13.7.2.2. By Application 13.8. Spain 13.8.1. Pricing Analysis 13.8.2. Market Share Analysis, 2021 13.8.2.1. By Product Type 13.8.2.2. By Application 13.9. Italy 13.9.1. Pricing Analysis 13.9.2. Market Share Analysis, 2021 13.9.2.1. By Product Type 13.9.2.2. By Application 13.10. China 13.10.1. Pricing Analysis 13.10.2. Market Share Analysis, 2021 13.10.2.1. By Product Type 13.10.2.2. By Application 13.11. Japan 13.11.1. Pricing Analysis 13.11.2. Market Share Analysis, 2021 13.11.2.1. By Product Type 13.11.2.2. By Application 13.12. South Korea 13.12.1. Pricing Analysis 13.12.2. Market Share Analysis, 2021 13.12.2.1. By Product Type 13.12.2.2. By Application 13.13. Malaysia 13.13.1. Pricing Analysis 13.13.2. Market Share Analysis, 2021 13.13.2.1. By Product Type 13.13.2.2. By Application 13.14. Singapore 13.14.1. Pricing Analysis 13.14.2. Market Share Analysis, 2021 13.14.2.1. By Product Type 13.14.2.2. By Application 13.15. Australia 13.15.1. Pricing Analysis 13.15.2. Market Share Analysis, 2021 13.15.2.1. By Product Type 13.15.2.2. By Application 13.16. New Zealand 13.16.1. Pricing Analysis 13.16.2. Market Share Analysis, 2021 13.16.2.1. By Product Type 13.16.2.2. By Application 13.17. GCC Countries 13.17.1. Pricing Analysis 13.17.2. Market Share Analysis, 2021 13.17.2.1. By Product Type 13.17.2.2. By Application 13.18. South Africa 13.18.1. Pricing Analysis 13.18.2. Market Share Analysis, 2021 13.18.2.1. By Product Type 13.18.2.2. By Application 13.19. Israel 13.19.1. Pricing Analysis 13.19.2. Market Share Analysis, 2021 13.19.2.1. By Product Type 13.19.2.2. By Application 14. Market Structure Analysis 14.1. Competition Dashboard 14.2. Competition Benchmarking 14.3. Market Share Analysis of Top Players 14.3.1. By Regional 14.3.2. By Product Type 14.3.3. By Application 15. Competition Analysis 15.1. Competition Deep Dive 15.1.1. Emco Packaging 15.1.1.1. Overview 15.1.1.2. Product Portfolio 15.1.1.3. Profitability by Market Segments 15.1.1.4. Sales Footprint 15.1.1.5. Strategy Overview 15.1.1.5.1. Marketing Strategy 15.1.1.5.2. Product Strategy 15.1.1.5.3. Channel Strategy 15.1.2. PreSens Precision Sensing GmbH 15.1.2.1. Overview 15.1.2.2. Product Portfolio 15.1.2.3. Profitability by Market Segments 15.1.2.4. Sales Footprint 15.1.2.5. Strategy Overview 15.1.2.5.1. Marketing Strategy 15.1.2.5.2. Product Strategy 15.1.2.5.3. Channel Strategy 15.1.3. CCL Industries 15.1.3.1. Overview 15.1.3.2. Product Portfolio 15.1.3.3. Profitability by Market Segments 15.1.3.4. Sales Footprint 15.1.3.5. Strategy Overview 15.1.3.5.1. Marketing Strategy 15.1.3.5.2. Product Strategy 15.1.3.5.3. Channel Strategy 15.1.4. PackFreshUSA 15.1.4.1. Overview 15.1.4.2. Product Portfolio 15.1.4.3. Profitability by Market Segments 15.1.4.4. Sales Footprint 15.1.4.5. Strategy Overview 15.1.4.5.1. Marketing Strategy 15.1.4.5.2. Product Strategy 15.1.4.5.3. Channel Strategy 15.1.5. Mitsubishi Gas Chemical 15.1.5.1. Overview 15.1.5.2. Product Portfolio 15.1.5.3. Profitability by Market Segments 15.1.5.4. Sales Footprint 15.1.5.5. Strategy Overview 15.1.5.5.1. Marketing Strategy 15.1.5.5.2. Product Strategy 15.1.5.5.3. Channel Strategy 15.1.6. DryPak Industries 15.1.6.1. Overview 15.1.6.2. Product Portfolio 15.1.6.3. Profitability by Market Segments 15.1.6.4. Sales Footprint 15.1.6.5. Strategy Overview 15.1.6.5.1. Marketing Strategy 15.1.6.5.2. Product Strategy 15.1.6.5.3. Channel Strategy 16. Assumptions & Acronyms Used 17. Research Methodology
Don't pay for what you don't need
Customize your report by selecting specific countries or regions and save 30%!
Table 01: Global Oxygen Indicator Labels Market Value (US$ Mn) Forecast by Region, 2017-2032 Table 02: Global Oxygen Indicator Labels Market Volume (Sq. Mtr) Forecast by Region, 2017-2032 Table 03: Global Oxygen Indicator Labels Market Value (US$ Mn) Forecast by Product Type, 2017-2032 Table 04: Global Oxygen Indicator Labels Market Volume (Sq. Mtr) Forecast by Product Type, 2017-2032 Table 05: Global Oxygen Indicator Labels Market Value (US$ Mn) Forecast by Application, 2017-2032 Table 06: Global Oxygen Indicator Labels Market Volume (Sq. Mtr) Forecast by Application, 2017-2032 Table 07: North America Oxygen Indicator Labels Market Value (US$ Mn) Forecast by Country, 2017-2032 Table 08: North America Oxygen Indicator Labels Market Volume (Sq. Mtr) Forecast by Country, 2017-2032 Table 09: North America Oxygen Indicator Labels Market Value (US$ Mn) Forecast by Product Type, 2017-2032 Table 10: North America Oxygen Indicator Labels Market Volume (Sq. Mtr) Forecast by Product Type, 2017-2032 Table 11: North America Oxygen Indicator Labels Market Value (US$ Mn) Forecast by Application, 2017-2032 Table 12: North America Oxygen Indicator Labels Market Volume (Sq. Mtr) Forecast by Application, 2017-2032 Table 13: Latin America Oxygen Indicator Labels Market Value (US$ Mn) Forecast by Country, 2017-2032 Table 14: Latin America Oxygen Indicator Labels Market Volume (Sq. Mtr) Forecast by Country, 2017-2032 Table 15: Latin America Oxygen Indicator Labels Market Value (US$ Mn) Forecast by Product Type, 2017-2032 Table 16: Latin America Oxygen Indicator Labels Market Volume (Sq. Mtr) Forecast by Product Type, 2017-2032 Table 17: Latin America Oxygen Indicator Labels Market Value (US$ Mn) Forecast by Application, 2017-2032 Table 18: Latin America Oxygen Indicator Labels Market Volume (Sq. Mtr) Forecast by Application, 2017-2032 Table 19: Europe Oxygen Indicator Labels Market Value (US$ Mn) Forecast by Country, 2017-2032 Table 20: Europe Oxygen Indicator Labels Market Volume (Sq. Mtr) Forecast by Country, 2017-2032 Table 21: Europe Oxygen Indicator Labels Market Value (US$ Mn) Forecast by Product Type, 2017-2032 Table 22: Europe Oxygen Indicator Labels Market Volume (Sq. Mtr) Forecast by Product Type, 2017-2032 Table 23: Europe Oxygen Indicator Labels Market Value (US$ Mn) Forecast by Application, 2017-2032 Table 24: Europe Oxygen Indicator Labels Market Volume (Sq. Mtr) Forecast by Application, 2017-2032 Table 25: Asia Pacific Oxygen Indicator Labels Market Value (US$ Mn) Forecast by Country, 2017-2032 Table 26: Asia Pacific Oxygen Indicator Labels Market Volume (Sq. Mtr) Forecast by Country, 2017-2032 Table 27: Asia Pacific Oxygen Indicator Labels Market Value (US$ Mn) Forecast by Product Type, 2017-2032 Table 28: Asia Pacific Oxygen Indicator Labels Market Volume (Sq. Mtr) Forecast by Product Type, 2017-2032 Table 29: Asia Pacific Oxygen Indicator Labels Market Value (US$ Mn) Forecast by Application, 2017-2032 Table 30: Asia Pacific Oxygen Indicator Labels Market Volume (Sq. Mtr) Forecast by Application, 2017-2032 Table 31: MEA Oxygen Indicator Labels Market Value (US$ Mn) Forecast by Country, 2017-2032 Table 32: MEA Oxygen Indicator Labels Market Volume (Sq. Mtr) Forecast by Country, 2017-2032 Table 33: MEA Oxygen Indicator Labels Market Value (US$ Mn) Forecast by Product Type, 2017-2032 Table 34: MEA Oxygen Indicator Labels Market Volume (Sq. Mtr) Forecast by Product Type, 2017-2032 Table 35: MEA Oxygen Indicator Labels Market Value (US$ Mn) Forecast by Application, 2017-2032 Table 36: MEA Oxygen Indicator Labels Market Volume (Sq. Mtr) Forecast by Application, 2017-2032
Figure 01: Global Oxygen Indicator Labels Market Value (US$ Mn) by Product Type, 2022-2032 Figure 02: Global Oxygen Indicator Labels Market Value (US$ Mn) by Application, 2022-2032 Figure 03: Global Oxygen Indicator Labels Market Value (US$ Mn) by Region, 2022-2032 Figure 04: Global Oxygen Indicator Labels Market Value (US$ Mn) Analysis by Region, 2017-2032 Figure 05: Global Oxygen Indicator Labels Market Volume (Sq. Mtr) Analysis by Region, 2017-2032 Figure 06: Global Oxygen Indicator Labels Market Value Share (%) and BPS Analysis by Region, 2022-2032 Figure 07: Global Oxygen Indicator Labels Market Y-o-Y Growth (%) Projections by Region, 2022-2032 Figure 08: Global Oxygen Indicator Labels Market Value (US$ Mn) Analysis by Product Type, 2017-2032 Figure 09: Global Oxygen Indicator Labels Market Volume (Sq. Mtr) Analysis by Product Type, 2017-2032 Figure 10: Global Oxygen Indicator Labels Market Value Share (%) and BPS Analysis by Product Type, 2022-2032 Figure 11: Global Oxygen Indicator Labels Market Y-o-Y Growth (%) Projections by Product Type, 2022-2032 Figure 12: Global Oxygen Indicator Labels Market Value (US$ Mn) Analysis by Application, 2017-2032 Figure 13: Global Oxygen Indicator Labels Market Volume (Sq. Mtr) Analysis by Application, 2017-2032 Figure 14: Global Oxygen Indicator Labels Market Value Share (%) and BPS Analysis by Application, 2022-2032 Figure 15: Global Oxygen Indicator Labels Market Y-o-Y Growth (%) Projections by Application, 2022-2032 Figure 16: Global Oxygen Indicator Labels Market Attractiveness by Product Type, 2022-2032 Figure 17: Global Oxygen Indicator Labels Market Attractiveness by Application, 2022-2032 Figure 18: Global Oxygen Indicator Labels Market Attractiveness by Region, 2022-2032 Figure 19: North America Oxygen Indicator Labels Market Value (US$ Mn) by Product Type, 2022-2032 Figure 20: North America Oxygen Indicator Labels Market Value (US$ Mn) by Application, 2022-2032 Figure 21: North America Oxygen Indicator Labels Market Value (US$ Mn) by Country, 2022-2032 Figure 22: North America Oxygen Indicator Labels Market Value (US$ Mn) Analysis by Country, 2017-2032 Figure 23: North America Oxygen Indicator Labels Market Volume (Sq. Mtr) Analysis by Country, 2017-2032 Figure 24: North America Oxygen Indicator Labels Market Value Share (%) and BPS Analysis by Country, 2022-2032 Figure 25: North America Oxygen Indicator Labels Market Y-o-Y Growth (%) Projections by Country, 2022-2032 Figure 26: North America Oxygen Indicator Labels Market Value (US$ Mn) Analysis by Product Type, 2017-2032 Figure 27: North America Oxygen Indicator Labels Market Volume (Sq. Mtr) Analysis by Product Type, 2017-2032 Figure 28: North America Oxygen Indicator Labels Market Value Share (%) and BPS Analysis by Product Type, 2022-2032 Figure 29: North America Oxygen Indicator Labels Market Y-o-Y Growth (%) Projections by Product Type, 2022-2032 Figure 30: North America Oxygen Indicator Labels Market Value (US$ Mn) Analysis by Application, 2017-2032 Figure 31: North America Oxygen Indicator Labels Market Volume (Sq. Mtr) Analysis by Application, 2017-2032 Figure 32: North America Oxygen Indicator Labels Market Value Share (%) and BPS Analysis by Application, 2022-2032 Figure 33: North America Oxygen Indicator Labels Market Y-o-Y Growth (%) Projections by Application, 2022-2032 Figure 34: North America Oxygen Indicator Labels Market Attractiveness by Product Type, 2022-2032 Figure 35: North America Oxygen Indicator Labels Market Attractiveness by Application, 2022-2032 Figure 36: North America Oxygen Indicator Labels Market Attractiveness by Country, 2022-2032 Figure 37: Latin America Oxygen Indicator Labels Market Value (US$ Mn) by Product Type, 2022-2032 Figure 38: Latin America Oxygen Indicator Labels Market Value (US$ Mn) by Application, 2022-2032 Figure 39: Latin America Oxygen Indicator Labels Market Value (US$ Mn) by Country, 2022-2032 Figure 40: Latin America Oxygen Indicator Labels Market Value (US$ Mn) Analysis by Country, 2017-2032 Figure 41: Latin America Oxygen Indicator Labels Market Volume (Sq. Mtr) Analysis by Country, 2017-2032 Figure 42: Latin America Oxygen Indicator Labels Market Value Share (%) and BPS Analysis by Country, 2022-2032 Figure 43: Latin America Oxygen Indicator Labels Market Y-o-Y Growth (%) Projections by Country, 2022-2032 Figure 44: Latin America Oxygen Indicator Labels Market Value (US$ Mn) Analysis by Product Type, 2017-2032 Figure 45: Latin America Oxygen Indicator Labels Market Volume (Sq. Mtr) Analysis by Product Type, 2017-2032 Figure 46: Latin America Oxygen Indicator Labels Market Value Share (%) and BPS Analysis by Product Type, 2022-2032 Figure 47: Latin America Oxygen Indicator Labels Market Y-o-Y Growth (%) Projections by Product Type, 2022-2032 Figure 48: Latin America Oxygen Indicator Labels Market Value (US$ Mn) Analysis by Application, 2017-2032 Figure 49: Latin America Oxygen Indicator Labels Market Volume (Sq. Mtr) Analysis by Application, 2017-2032 Figure 50: Latin America Oxygen Indicator Labels Market Value Share (%) and BPS Analysis by Application, 2022-2032 Figure 51: Latin America Oxygen Indicator Labels Market Y-o-Y Growth (%) Projections by Application, 2022-2032 Figure 52: Latin America Oxygen Indicator Labels Market Attractiveness by Product Type, 2022-2032 Figure 53: Latin America Oxygen Indicator Labels Market Attractiveness by Application, 2022-2032 Figure 54: Latin America Oxygen Indicator Labels Market Attractiveness by Country, 2022-2032 Figure 55: Europe Oxygen Indicator Labels Market Value (US$ Mn) by Product Type, 2022-2032 Figure 56: Europe Oxygen Indicator Labels Market Value (US$ Mn) by Application, 2022-2032 Figure 57: Europe Oxygen Indicator Labels Market Value (US$ Mn) by Country, 2022-2032 Figure 58: Europe Oxygen Indicator Labels Market Value (US$ Mn) Analysis by Country, 2017-2032 Figure 59: Europe Oxygen Indicator Labels Market Volume (Sq. Mtr) Analysis by Country, 2017-2032 Figure 60: Europe Oxygen Indicator Labels Market Value Share (%) and BPS Analysis by Country, 2022-2032 Figure 61: Europe Oxygen Indicator Labels Market Y-o-Y Growth (%) Projections by Country, 2022-2032 Figure 62: Europe Oxygen Indicator Labels Market Value (US$ Mn) Analysis by Product Type, 2017-2032 Figure 63: Europe Oxygen Indicator Labels Market Volume (Sq. Mtr) Analysis by Product Type, 2017-2032 Figure 64: Europe Oxygen Indicator Labels Market Value Share (%) and BPS Analysis by Product Type, 2022-2032 Figure 65: Europe Oxygen Indicator Labels Market Y-o-Y Growth (%) Projections by Product Type, 2022-2032 Figure 66: Europe Oxygen Indicator Labels Market Value (US$ Mn) Analysis by Application, 2017-2032 Figure 67: Europe Oxygen Indicator Labels Market Volume (Sq. Mtr) Analysis by Application, 2017-2032 Figure 68: Europe Oxygen Indicator Labels Market Value Share (%) and BPS Analysis by Application, 2022-2032 Figure 69: Europe Oxygen Indicator Labels Market Y-o-Y Growth (%) Projections by Application, 2022-2032 Figure 70: Europe Oxygen Indicator Labels Market Attractiveness by Product Type, 2022-2032 Figure 71: Europe Oxygen Indicator Labels Market Attractiveness by Application, 2022-2032 Figure 72: Europe Oxygen Indicator Labels Market Attractiveness by Country, 2022-2032 Figure 73: Asia Pacific Oxygen Indicator Labels Market Value (US$ Mn) by Product Type, 2022-2032 Figure 74: Asia Pacific Oxygen Indicator Labels Market Value (US$ Mn) by Application, 2022-2032 Figure 75: Asia Pacific Oxygen Indicator Labels Market Value (US$ Mn) by Country, 2022-2032 Figure 76: Asia Pacific Oxygen Indicator Labels Market Value (US$ Mn) Analysis by Country, 2017-2032 Figure 77: Asia Pacific Oxygen Indicator Labels Market Volume (Sq. Mtr) Analysis by Country, 2017-2032 Figure 78: Asia Pacific Oxygen Indicator Labels Market Value Share (%) and BPS Analysis by Country, 2022-2032 Figure 79: Asia Pacific Oxygen Indicator Labels Market Y-o-Y Growth (%) Projections by Country, 2022-2032 Figure 80: Asia Pacific Oxygen Indicator Labels Market Value (US$ Mn) Analysis by Product Type, 2017-2032 Figure 81: Asia Pacific Oxygen Indicator Labels Market Volume (Sq. Mtr) Analysis by Product Type, 2017-2032 Figure 82: Asia Pacific Oxygen Indicator Labels Market Value Share (%) and BPS Analysis by Product Type, 2022-2032 Figure 83: Asia Pacific Oxygen Indicator Labels Market Y-o-Y Growth (%) Projections by Product Type, 2022-2032 Figure 84: Asia Pacific Oxygen Indicator Labels Market Value (US$ Mn) Analysis by Application, 2017-2032 Figure 85: Asia Pacific Oxygen Indicator Labels Market Volume (Sq. Mtr) Analysis by Application, 2017-2032 Figure 86: Asia Pacific Oxygen Indicator Labels Market Value Share (%) and BPS Analysis by Application, 2022-2032 Figure 87: Asia Pacific Oxygen Indicator Labels Market Y-o-Y Growth (%) Projections by Application, 2022-2032 Figure 88: Asia Pacific Oxygen Indicator Labels Market Attractiveness by Product Type, 2022-2032 Figure 89: Asia Pacific Oxygen Indicator Labels Market Attractiveness by Application, 2022-2032 Figure 90: Asia Pacific Oxygen Indicator Labels Market Attractiveness by Country, 2022-2032 Figure 91: MEA Oxygen Indicator Labels Market Value (US$ Mn) by Product Type, 2022-2032 Figure 92: MEA Oxygen Indicator Labels Market Value (US$ Mn) by Application, 2022-2032 Figure 93: MEA Oxygen Indicator Labels Market Value (US$ Mn) by Country, 2022-2032 Figure 94: MEA Oxygen Indicator Labels Market Value (US$ Mn) Analysis by Country, 2017-2032 Figure 95: MEA Oxygen Indicator Labels Market Volume (Sq. Mtr) Analysis by Country, 2017-2032 Figure 96: MEA Oxygen Indicator Labels Market Value Share (%) and BPS Analysis by Country, 2022-2032 Figure 97: MEA Oxygen Indicator Labels Market Y-o-Y Growth (%) Projections by Country, 2022-2032 Figure 98: MEA Oxygen Indicator Labels Market Value (US$ Mn) Analysis by Product Type, 2017-2032 Figure 99: MEA Oxygen Indicator Labels Market Volume (Sq. Mtr) Analysis by Product Type, 2017-2032 Figure 100: MEA Oxygen Indicator Labels Market Value Share (%) and BPS Analysis by Product Type, 2022-2032 Figure 101: MEA Oxygen Indicator Labels Market Y-o-Y Growth (%) Projections by Product Type, 2022-2032 Figure 102: MEA Oxygen Indicator Labels Market Value (US$ Mn) Analysis by Application, 2017-2032 Figure 103: MEA Oxygen Indicator Labels Market Volume (Sq. Mtr) Analysis by Application, 2017-2032 Figure 104: MEA Oxygen Indicator Labels Market Value Share (%) and BPS Analysis by Application, 2022-2032 Figure 105: MEA Oxygen Indicator Labels Market Y-o-Y Growth (%) Projections by Application, 2022-2032 Figure 106: MEA Oxygen Indicator Labels Market Attractiveness by Product Type, 2022-2032 Figure 107: MEA Oxygen Indicator Labels Market Attractiveness by Application, 2022-2032 Figure 108: MEA Oxygen Indicator Labels Market Attractiveness by Country, 2022-2032
Recommendations
Explore Packaging Insights
View Reports