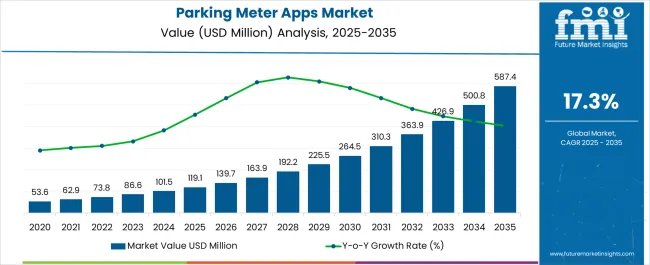
The Parking Meter Apps Market is estimated to be valued at USD 119.1 million in 2025 and is projected to reach USD 587.4 million by 2035, registering a compound annual growth rate (CAGR) of 17.3% over the forecast period.
| Metric | Value |
|---|---|
| Parking Meter Apps Market Estimated Value in (2025 E) | USD 119.1 million |
| Parking Meter Apps Market Forecast Value in (2035 F) | USD 587.4 million |
| Forecast CAGR (2025 to 2035) | 17.3% |
The parking meter apps market is experiencing steady expansion due to the increasing need for urban mobility solutions, reduced traffic congestion, and seamless parking fee collection. Municipal authorities and private operators are actively digitizing parking infrastructure to improve operational efficiency, promote compliance, and reduce manual intervention.
Growing smartphone penetration, mobile payment integration, and demand for real-time space availability are further encouraging adoption. The market is also benefiting from supportive regulatory frameworks promoting smart city initiatives and cashless transactions.
Technological advancements such as geolocation services, license plate recognition, and app-based enforcement capabilities have transformed the user experience. Looking ahead, increased adoption of multi-city apps, integration with mobility-as-a-service (MaaS) platforms, and enhanced data analytics are expected to shape the next phase of innovation and competitiveness in this sector.
The market is segmented by Platform and End User and region. By Platform, the market is divided into iOS and Android. In terms of End User, the market is classified into Personal and Businesses. Regionally, the market is classified into North America, Latin America, Western Europe, Eastern Europe, Balkan & Baltic Countries, Russia & Belarus, Central Asia, East Asia, South Asia & Pacific, and the Middle East & Africa.
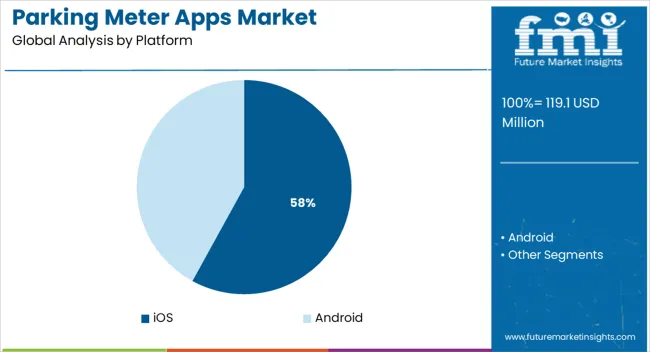
The iOS platform is expected to account for 58.0% of the total revenue in the parking meter apps market by 2025, making it the dominant segment by platform. This leadership is being attributed to the higher average revenue per user (ARPU) associated with iOS users, along with their stronger adoption of paid app features and in-app services.
Urban professionals, who constitute a large portion of iOS users, frequently interact with app-based mobility services, boosting engagement with parking applications. Enhanced app performance on the iOS ecosystem, faster integration with Apple Pay, and strong security protocols have also driven greater trust and repeat usage.
Additionally, developers tend to prioritize iOS platforms for premium app features, which has contributed to higher user retention and monetization rates within this segment.
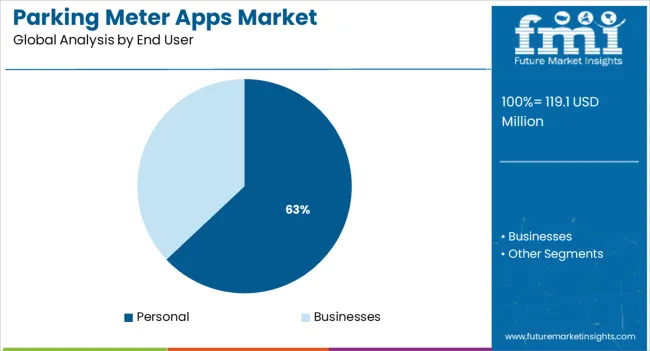
The personal end user segment is projected to hold 63.0% of the overall revenue share in the parking meter apps market in 2025, establishing it as the leading consumer base. Growth in this segment is being driven by the rising use of private vehicles in urban areas and the growing convenience of app-based parking over traditional meters.
Increasing time sensitivity among daily commuters has amplified demand for real-time space reservation, digital payments, and app notifications—features widely adopted by personal users. The growing availability of zone-based parking, residential permit integration, and loyalty benefits has further incentivized app downloads and active usage.
As cities continue to implement smart parking infrastructure, the personal user base is expected to expand, benefiting from streamlined parking experiences and lower dependency on manual systems.
North American region holds the largest market for parking meter apps mainly due to the increasing number of vehicles, lesser land availability for parking, and smart city initiatives from governments.
The US Green Building Council (USGBC) has increased the amount of clean and greener space available in buildings as part of its smart city projects, which raises demand for parking meter apps that reduce time spent on processing payments and keeping track of parking spaces by making these tasks accessible electronically.
Besides, a total of 1,456 on-street parking places, 29 off-street parking lots, 1,449 parking spaces, and 2 municipal garages with 966 parking slots are all equipped with smart parking meter solutions by the Canadian government.
Asia Pacific region sees the fastest growth in demand for Parking Meter Apps. The rising technological advancements in developing countries like India and China are attracting several new market players in the region. Heavy capital investments are being made by the government of these developing countries to resolve traffic congestion, and parking space availability issue, and to reduce air pollution caused due to vehicles.
Get My Parking is an Indian Parking Meter App, founded in 2020. The system is presently implemented in over 250 parking areas in Chicago, Houston, Mumbai, Johannesburg, Ottawa, and Pune, at lengths including Delhi-National Capital Region, Kolkata, Hyderabad, Nagpur, and Bangalore, among others.
As a part of its operation, Get My Parking has completed three smart city projects in the country, as well as successful navigators for various municipalities and government agencies. To ensure increased parking revenues through efficient parking lot management GMP has also partnered with parking operators.
Administrators have also enabled city parking permits and offer reduced parking rates for the citizens using Get My Parking Permit. Get MY Parking is now expanding its services to 17 other countries.
In April 2024, a fund worth USD 680 Million was awarded to Flowbird and HKT by the Transport Department of the Hong Kong Special Administrative Region to develop digital on-street parking systems under their smart city program.
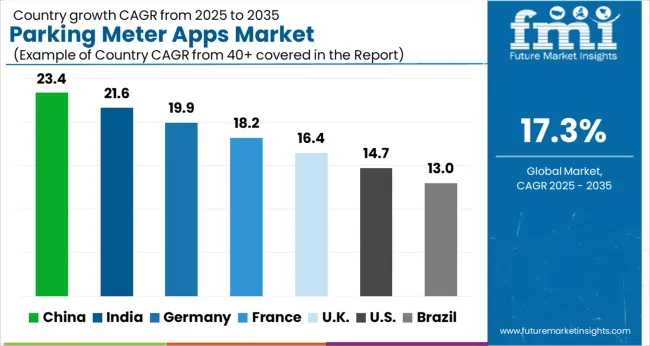
The USA holds the largest market for Parking Meter Apps, which is projected to reach a valuation of USD 587.4 Million by 2035. From 2020 to 2024, the market in the US grew at a CAGR of 18.4%. Between 2025 and 2035, the US is expected to be a market with a USD 94.7 Million absolute dollar opportunity.
According to the parking and transportation ticketing business Flowbird, which has its USA headquarters in Moorestown and clients in Chicago, New York, Miami, Los Angeles, and Philadelphia, among other major US cities, the majority of these cities offer parking meter apps.
Along with parking meters, many applications help drivers locate quick or inexpensive parking in major US cities. Parking spot bookings are available through services like ParkWhiz, SpotHero, and Parking Panda in numerous locations. Drivers can use the app to search for parking and reserve a space.
To improve accessibility, there are also valet applications available in several US locations. The valet applications Luxe, Zwayo, SpotLight Parking, and Veer are available in Boston. San Francisco, San Diego, Seattle, Los Angeles, and Washington, DC drivers can use Zirx. ValetAnywhere provides services in New York City while Carbon is only available in San Francisco. Blucar is accessible on the west coast in Boulder, Denver, Beverly Hills, and San Diego.
China has the most optimistic market for Parking Meter Apps after the US. China’s Parking Meter App market is expected to be worth USD 24.1 Million by the year 2035 with an absolute dollar growth of USD 53.6 Million. China has previously experienced a CAGR of 17.9% from 2020 to 2024 and is expected to witness a CAGR of 16% from 2025 to 2035.
Key Chinese cities struggle to meet the rising demand for parking. Therefore, a common feature in Chinese parking apps is the option to pre-book and pay for parking. Ubo and Tingchebao are the two most popular parking meter apps in China.
Ping An Ventures and Yonghua Capital recently provided Tingchebao with a series of funding totaling USD 2.6 Million. It is a parking application that uses location to find available spaces nearby. It displays the costs and facilitates users' ability to reserve parking spaces in advance.
A little monthly subscription charge is required to receive limitless parking. Tingchebao's newest offering, on-demand valet parking, will be soon introduced with the help of this most recent round of funding.
Although Android holds a significant share of the market, iOS is the most used Platform for downloading Parking Meter Apps. Revenue through this category expanded at a CAGR of 18.6% from 2020 to 2024 and is projected to grow at a CAGR of 16.9% by 2035.
The number of Android users is more than the number of iOS users worldwide. But, the majority of iOS users come from developed regions or countries where parking meter apps are more in demand in comparison to developing nations where although the number of Android users is more, the demand for parking meter apps is still quite less.
The personal end-user contributes the most of the market revenue due to its increasing acceptance among drivers for easily finding parking spaces and making payments quickly. The use of parking meters by individuals experienced a CAGR of 18.4% from 2020 to 2024 and is expected to witness a CAGR of 16.6% in the next ten years. However, businesses are increasingly deploying parking meter app solutions for the ease of employees.
To make their product as accessible as possible for individual users, market participants consistently focus on new product breakthroughs and advances. To stay competitive, some of the key players also form alliances with corporations and other institutions.
For instance, in October 2024, ParkMobile and North Carolina Central University partnered to offer contactless parking reservations for the school's basketball and football games. ParkMobile now has more than 574,000 users in North Carolina as a result of this relocation.
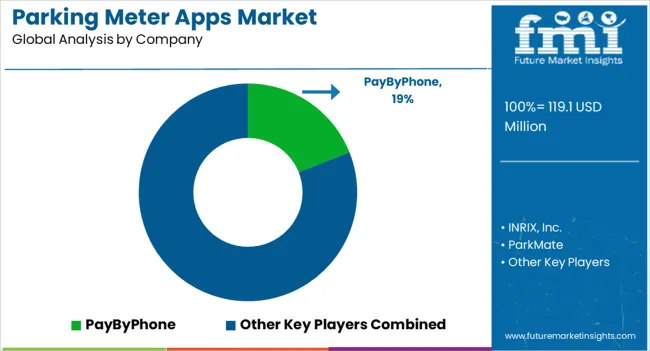
The Parking Meter App Market is getting quite competitive recently. Some of the key players in the industry are IEM SA, INRIX, Inc., ParkMate, Parkopedia, Arrive (ParkWhiz), ParkMobile, LLC, PASSPORT LABS, INC., Flowbird, PayByPhone, EasyPark, Parking Panda, Streetline, BestParking, Waze, HONK, JustPark, and Telpark.
Some of the key developments in the parking meter apps market include the following:
The global parking meter apps market is estimated to be valued at USD 119.1 million in 2025.
The market size for the parking meter apps market is projected to reach USD 587.4 million by 2035.
The parking meter apps market is expected to grow at a 17.3% CAGR between 2025 and 2035.
The key product types in parking meter apps market are ios and android.
In terms of end user, personal segment to command 63.0% share in the parking meter apps market in 2025.


Our Research Products

The "Full Research Suite" delivers actionable market intel, deep dives on markets or technologies, so clients act faster, cut risk, and unlock growth.

The Leaderboard benchmarks and ranks top vendors, classifying them as Established Leaders, Leading Challengers, or Disruptors & Challengers.

Locates where complements amplify value and substitutes erode it, forecasting net impact by horizon

We deliver granular, decision-grade intel: market sizing, 5-year forecasts, pricing, adoption, usage, revenue, and operational KPIs—plus competitor tracking, regulation, and value chains—across 60 countries broadly.

Spot the shifts before they hit your P&L. We track inflection points, adoption curves, pricing moves, and ecosystem plays to show where demand is heading, why it is changing, and what to do next across high-growth markets and disruptive tech

Real-time reads of user behavior. We track shifting priorities, perceptions of today’s and next-gen services, and provider experience, then pace how fast tech moves from trial to adoption, blending buyer, consumer, and channel inputs with social signals (#WhySwitch, #UX).

Partner with our analyst team to build a custom report designed around your business priorities. From analysing market trends to assessing competitors or crafting bespoke datasets, we tailor insights to your needs.
Supplier Intelligence
Discovery & Profiling
Capacity & Footprint
Performance & Risk
Compliance & Governance
Commercial Readiness
Who Supplies Whom
Scorecards & Shortlists
Playbooks & Docs
Category Intelligence
Definition & Scope
Demand & Use Cases
Cost Drivers
Market Structure
Supply Chain Map
Trade & Policy
Operating Norms
Deliverables
Buyer Intelligence
Account Basics
Spend & Scope
Procurement Model
Vendor Requirements
Terms & Policies
Entry Strategy
Pain Points & Triggers
Outputs
Pricing Analysis
Benchmarks
Trends
Should-Cost
Indexation
Landed Cost
Commercial Terms
Deliverables
Brand Analysis
Positioning & Value Prop
Share & Presence
Customer Evidence
Go-to-Market
Digital & Reputation
Compliance & Trust
KPIs & Gaps
Outputs
Full Research Suite comprises of:
Market outlook & trends analysis
Interviews & case studies
Strategic recommendations
Vendor profiles & capabilities analysis
5-year forecasts
8 regions and 60+ country-level data splits
Market segment data splits
12 months of continuous data updates
DELIVERED AS:
PDF EXCEL ONLINE
Parking Management Market Forecast and Outlook 2025 to 2035
Parking Management Solutions Market Size and Share Forecast Outlook 2025 to 2035
Parking Ticket Dispenser Market Growth, Trends & Forecast 2025 to 2035
Parking Finder Apps Market Size and Share Forecast Outlook 2025 to 2035
Smart Parking Market Size and Share Forecast Outlook 2025 to 2035
Diesel Parking Heater Market Size and Share Forecast Outlook 2025 to 2035
Real Time Parking System Market Growth - Trends & Forecast 2025 to 2035
Autonomous Parking Market Size and Share Forecast Outlook 2025 to 2035
Automotive Sparking Cable Market Size and Share Forecast Outlook 2025 to 2035
Demand for Diesel Parking Heater in USA Size and Share Forecast Outlook 2025 to 2035
On Street Vehicle Parking Meter Market Growth - Trends & Forecast 2024 to 2034
Metering Pump Market Size and Share Forecast Outlook 2025 to 2035
Metered Dose Squeeze Dispenser Market Size and Share Forecast Outlook 2025 to 2035
The Metered Dose Inhalers Market is Segmented by Type, and End User from 2025 to 2035
Cemetery Software Market Size and Share Forecast Outlook 2025 to 2035
Ammeters Market Size and Share Forecast Outlook 2025 to 2035
Diameter Signaling Market Size and Share Forecast Outlook 2025 to 2035
Odometer Market Trends – Growth & Forecast 2025 to 2035
pH Meter Market Growth – Trends & Forecast 2019-2027
Bolometer Market Size and Share Forecast Outlook 2025 to 2035

Thank you!
You will receive an email from our Business Development Manager. Please be sure to check your SPAM/JUNK folder too.
Chat With
MaRIA