LCR Meters Market Outlook (2023 to 2033)

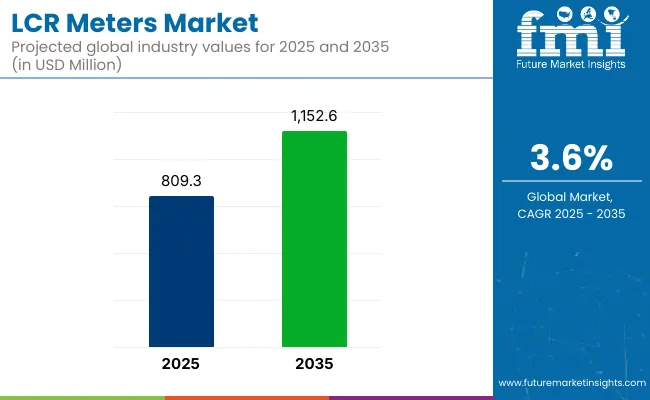
The global LCR meters market is likely to reach a valuation of US$ 754 million in 2023. It is estimated to surpass US$ 1077.4 million by 2033. The market is projected to witness steady growth at a CAGR of 3.6% over the forecast period 2023 to 2033.

The market for LCR (inductance, capacitance, resistance) meters has shown steady growth over the years. Consumers across several sectors such as electronics, communications, automotive, aerospace, and medical use LCR meters to measure the electrical parameters of components.

With the spread of electronic devices and technology, the demand for electronic components is increasing. LCR meters are essential tools to characterize and test these components and contribute to market growth. As with any technology, consumers demand more cost-effective LCR measurement solutions to optimally run their business.

Manufacturers are working to provide affordable options without compromising on critical measurement accuracy and performance. This trend aims to make LCR meters accessible to a wider audience.

LCR meters have advanced in terms of measurement accuracy, speed, and functionality. Manufacturers have incorporated features such as multi-frequency measurements, automatic component identification, data logging capabilities, and integration with automation systems. These advancements have expanded the application potential and increased the efficiency of LCR meters, driving the growth of the market.

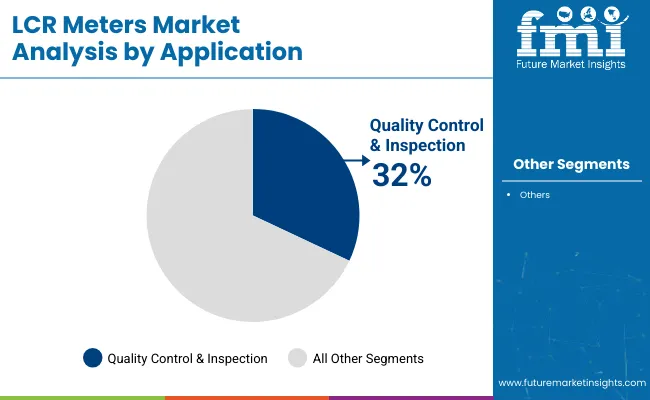
Quality control is very important in sectors that rely on electronic components. LCR meters are used by manufacturers to ensure product quality and reliability by accurately measuring component parameters. A growing regard for quality control has increased the demand for LCR meters.

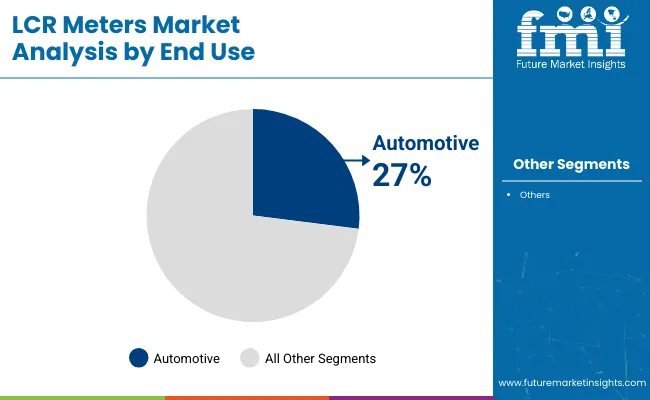
The automotive and electronics sectors are the key buyers of LCR meters. The growth of these sectors, driven by factors such as technological advances and rising automobile production, is having a positive impact on the LCR meter market. The market is also helped by the growing demand for consumer electronics.

Portable LCR meters are becoming more popular due to their convenience and ease of use. These enable on-site testing and field measurements, which are important in many applications. Demand for portable LCR meters is increasing, especially in domains that require mobility and flexibility.

Developing countries, especially in the Asia-Pacific region, are seeing strong growth in the electronics and automotive sectors. Increasing industrialization, urbanization, and increasing disposable income in these regions are contributing to the expansion of the LCR meter market.

Don't pay for what you don't need

Customize your report by selecting specific countries or regions and save 30%!

Top LCR Meters Market Trends Listed by Future Market Insights (FMI)

Measurement accuracy - As electronic components become smaller and more complex, there is a growing need for high-precision LCR meters that can accurately measure small capacitance, inductance, and resistance values. Manufacturers of LCR meters focus on improving measurement accuracy and reducing uncertainty.

Integration of features - LCR meters go beyond basic measurements to incorporate advanced features such as automatic component identification, auto-ranging, and built-in data logging capabilities. These additional features improve the usability and efficiency of the LCR meter, making it more versatile for a variety of applications.

Portability & Convenience - Portable LCR meters are becoming more popular due to their convenience and ease of use. These compact devices allow field technicians and engineers to make measurements in the field without the need for bulky laboratory equipment.

Versatility of functions - LCR meters are used in several industries such as electronics, telecommunications, automotive, aerospace, and medical. Each industry has specific requirements, and manufacturers of LCR meters have focused on developing specific solutions to meet these industry-specific needs.

Attributes Key Insights
LCR Meters Market Estimated Size (2023E) US$ 754 million
Projected Market Valuation (2033F) US$ 1077.4 million
Value-based CAGR (2023 to 2033) 3.6%
Historical CAGR (2018 to 2022) 4.6%

2018 to 2022 LCR Meters Sales Outlook Compared to Demand Forecast from 2023 to 2033

Future Market Insights (FMI) mentions that the global LCR meters market is anticipated to showcase a CAGR of 3.6% through 2033. In the historical period between 2018 and 2022, the market witnessed a decent CAGR of 4.6%. It reached US$ 725 million at the end of 2022.

Growing demand for consumer electronics such as smartphones, tablets, and wearable devices has increased the need for accurate component testing and quality control. LCR meters play an important role in manufacturing and testing the electronic components used in these devices.

The automotive industry has made significant advances in electronic systems and components such as sensors, controllers, and communication modules. LCR meters are essential tools to validate the performance and reliability of these components and contribute to the growth of the LCR meter market.

Demand for LCR meters increased, particularly due to the expansion of communication infrastructure due to the use of wireless networks and the development of high-speed data transmission technology. These gauges are used in the manufacturing and testing of communication components such as filters, antennas, and connectors.

LCR meters are commonly used for unit testing, but alternative methods and technologies may give similar or better results in certain applications. For example, certain industries may prefer impedance analyzers or vector network analyzers for their specific testing needs. The availability and suitability of alternative test methods may impact the demand for LCR meters.

In a mature market or industry with well-established test methodologies, there may be a saturation point where demand for LCR meters plateaus. Once the market is saturated with LCR meters, demand is likely to stabilize or grow at a slower pace unless there are significant technological advances or new applications to stimulate demand.

Nikhil Kaitwade
Nikhil Kaitwade

Principal Consultant

Talk to Analyst

Find your sweet spots for generating winning opportunities in this market.

What Factors Can Hinder Demand for LCR Meters Globally?

Rapid advances in semiconductor and electronic component technology could have a double impact on the demand for LCR meters. On the one hand, these advances could lead to the development of smaller, more integrated components that are difficult to test with traditional LCR meters.

LCR meters can be relatively expensive, especially those with advanced features and high accuracy. In price-sensitive markets, especially in industries with significant budget constraints, cost considerations may limit the adoption of LCR meters.

The increasing trend toward automation and integration of test and measurement systems may impact the demand for stand-alone LCR meters.

LCR meters are specialized instruments for measuring electrical parameters and require a certain level of technical knowledge and expertise to use effectively. A lack of understanding of the benefits and uses of LCR meters can hinder their demand.

Country-wise Insights

Would LCR Meters Demand Continue to Surge in the United States?

Stringent Quality Control Measures Pushing Innovation in the United States

The USA has a strong electronics industry spanning a wide range of sectors such as consumer electronics, communications, automotive electronics, aerospace, and defense. As the demand for electronic components and devices increases, so does the need for LCR meters to test and characterize these components.

The United States is known for innovation and technological progress. The emergence of new technologies such as 5G, the Internet of Things (IoT), autonomous vehicles, and renewable energy is increasing the demand for advanced test equipment such as electronic components and LCR meters. LCR meters play an important role in the development and quality assurance of these technologies.

The market emphasizes quality control and reliability across all industries. LCR meters are essential tools for accurately measuring component parameters and ensuring the quality and reliability of electronic products. The need for stringent quality control measures has increased the demand for LCR meters in the United States.

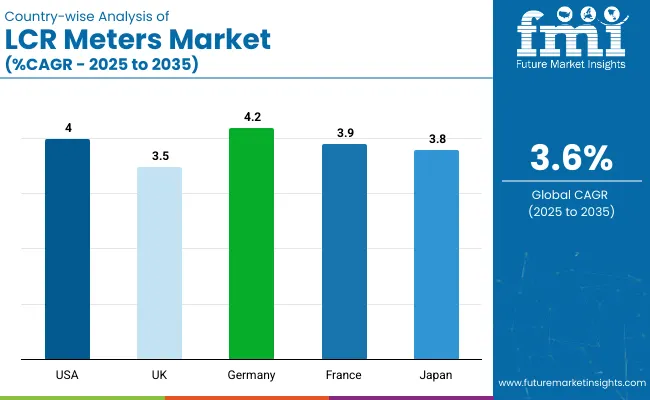
The country is estimated to be valued at US$ 191 million with a CAGR of 3.6% by 2033.

What is the Potential for China's Performance in the Field of LCR Meters?

High Adoption of Electronic Components in China to Spur Demand

China has a strong presence in the electronics industry and has established itself as a global manufacturing hub. The country has a large network of electronics manufacturers producing a wide range of components, devices, and equipment. There is a high demand for LCR counters in this manufacturing ecosystem, driving the growth of the LCR counter market in China.

China has a huge domestic market for electronic components and devices. The country's growing middle class, urbanization, and increasing consumer electronics consumption all contribute to the demand for LCR meters.

The expansion of industries such as telecommunications, automotive, consumer electronics, and renewable energy in China provides opportunities for LCR meter manufacturers to serve the local market.

China is projected to surge at a CAGR of 3.5% during 2023 to 2033, and reach US$ 207.5 million by the end of 2033.

Will United Kingdom Become a Hub for LCR Meters?

Focus on Renewable Energy Sources in the United Kingdom to Flourish Sales

Several sectors based in the United Kingdom such as aerospace, defense, automotive and medical have stringent standards and regulations. These mandate accurate testing and measurement of electronic components. LCR meters provide the features required to comply with these standards and are an integral part of the quality control process.

In the United Kingdom, automation and smart manufacturing practices are being introduced across the industry. Integrated test systems and automated production lines often require LCR meters for accurate and efficient unit testing. Demand for LCR meters is driven by the need for seamless integration into automated processes.

The United Kingdom is increasing its focus on renewable energy sources and the introduction of electric vehicles (EVs). LCR meters are essential for testing and characterizing components used in renewable energy systems, electric vehicles, and charging infrastructure. The shift to clean energy and electric vehicles is contributing to the demand for LCR meters.

As per the report, the United Kingdom LCR meters industry is likely to witness a CAGR of around 3.5% from 2023 to 2033, reaching US$ 40.1 million by its end.

Get the data you need at a Fraction of the cost

Personalize your report by choosing insights you need
and save 40%!

Category-wise Insights

Which is the Highly Preferred Type in LCR Meters Market?

Portable Feature in Handled LCR Meters to Propel Their Demand by 2033

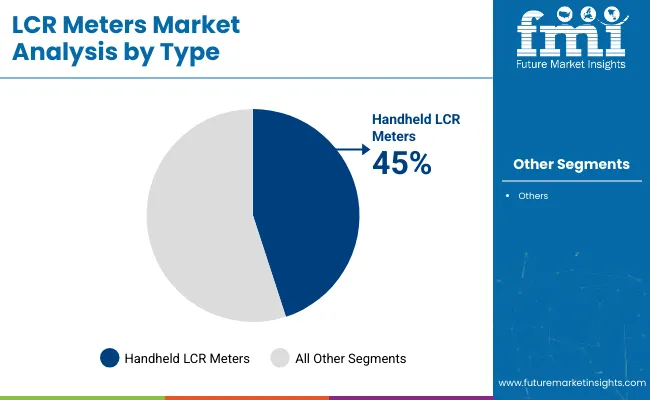
Based on type, the handheld LCR meter segment is likely to lead the global LCR meters market through 2033. It is estimated to exhibit a CAGR of 3.2% over the forecast period, as compared to 4.5% CAGR from 2018 to 2022.

A handheld LCR (inductance, capacitance, resistance) meter is a handheld electronic device used to measure the electrical properties of passive electronic components such as resistors, capacitors, and inductors. This allows to quickly and accurately determine the values ??of these components.

Handheld LCR meters are typically equipped with an LCD or OLED display, a button or touchscreen interface, and a set of test leads or probes for connecting to the component under test. Its compact size and portability make it useful for measurements on the go or in situations where a benchtop LCR meter is not available or impractical.

Handheld LCR meters are widely used in a variety of applications such as electronics repair, circuit testing, quality control, and research and development. They are especially useful for field technicians, hobbyists, and students who need portable measurement tools.

Which is the Top Application in LCR Meters Market?

Test Frequency Segment to be the Leading Application

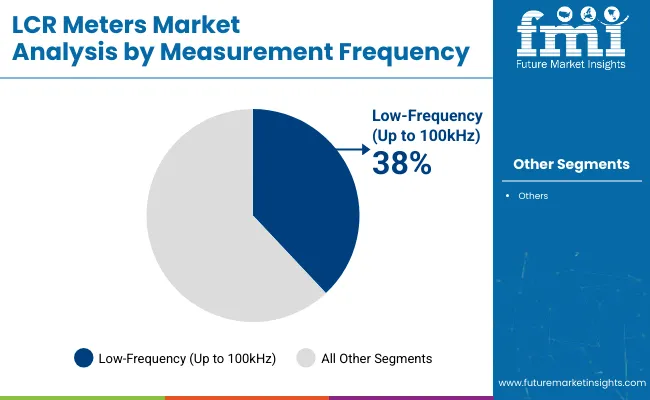
In terms of application, the test frequency category is projected to showcase a CAGR of 3.1% from 2023 to 2033. It exhibited a decent CAGR of about 4.3% during the historical period.

In the LCR (Inductance, Capacitance, and Resistance) market, test frequency refers to the frequency at which the LCR meter applies an AC signal to the component being measured. Test frequency is an important parameter because the electrical properties of passive components can change with frequency.

Selecting the appropriate test frequency depends on the specific component being tested and the intended application. Different frequencies reveal different properties and behaviors of the component such as impedance, resonant frequency, or frequency-dependent behavior.

When choosing an LCR meter, it is important to consider the test frequency range available and ensure that it covers the frequencies required for specific measurement needs. Some LCR meters allow the user to manually set the test frequency, while others automatically select the frequency based on the component being measured.

Competitive Landscape

The global market for LCR meters is highly fragmented with multiple local and regional vendors offering similar products. The market also has a wide variety of international, regional, and local suppliers.

Several local suppliers are entering the market, but find it difficult to compete with existing international suppliers in terms of quality, reliability, durability, and innovation. Competition in the market is likely to intensify, with more technological innovations and mergers and acquisitions expected in the future.

For instance,

  • In June 2022, Farnell launched new LCR measurement device from Rohde & Schwarz.

Scope of the Report

Attributes Details
Estimated Market Size (2023) US$ 754 million
Projected Market Valuation (2033) US$ 1077.4 million
Value-based CAGR (2023 to 2033) 3.6%
Forecast Period 2023 to 2033
Historical Data Available for 2018 to 2022
Market Analysis Value (US$ million)
Key Regions Covered Latin America; North America; Europe; South Asia; East Asia; Oceania; and the Middle East & Africa
Key Market Segments Covered Type, Application
Key Companies Profiled Applent Instruments; B&K Precision; Chroma ATE Inc.; Doble Engineering Company; Extech Instruments
Pricing Market Forecast, Company Share Analysis, Competition Intelligence, Market Dynamics and Challenges, and Strategic Growth Initiatives

LCR Meters Market Outlook by Category

Type:

  • Handheld LCR Meter
  • Benchtop LCR Meter

Application:

  • Test Frequency
  • Voltage
  • Accuracy
  • Speed
  • Other

Frequently Asked Questions

What is the LCR Meters Market Size in 2023?

The market is valued at US$ 754.0 million in 2023.

Who are the Key Competitors in the Market?

Applent Instruments, and B&K Precision are the key competitors in the market.

What will the Market Size be in 2033?

The market is anticipated to be worth US$ 1.0 billion by 2033.

What Drives the Sales of the LCR Meters?

Expansion of communication infrastructure, due to wireless networks is estimated to fuel the market.

How was the Historical Performance of the Market?

From 2018 to 2022, the market registered a CAGR of 4.6%.

Table of Content
1. Executive Summary
    1.1. Global Market Outlook
    1.2. Demand to side Trends
    1.3. Supply to side Trends
    1.4. Technology Roadmap Analysis
    1.5. Analysis and Recommendations
2. Market Overview
    2.1. Market Coverage / Taxonomy
    2.2. Market Definition / Scope / Limitations
3. Market Background
    3.1. Market Dynamics
        3.1.1. Drivers
        3.1.2. Restraints
        3.1.3. Opportunity
        3.1.4. Trends
    3.2. Scenario Forecast
        3.2.1. Demand in Optimistic Scenario
        3.2.2. Demand in Likely Scenario
        3.2.3. Demand in Conservative Scenario
    3.3. Opportunity Map Analysis
    3.4. Product Life Cycle Analysis
    3.5. Supply Chain Analysis
        3.5.1. Supply Side Participants and their Roles
            3.5.1.1. Producers
            3.5.1.2. Mid to Level Participants (Traders/ Agents/ Brokers)
            3.5.1.3. Wholesalers and Distributors
        3.5.2. Value Added and Value Created at Node in the Supply Chain
        3.5.3. List of Raw Material Suppliers
        3.5.4. List of Existing and Potential Buyer’s
    3.6. Investment Feasibility Matrix
    3.7. Value Chain Analysis
        3.7.1. Profit Margin Analysis
        3.7.2. Wholesalers and Distributors
        3.7.3. Retailers
    3.8. PESTLE and Porter’s Analysis
    3.9. Regulatory Landscape
        3.9.1. By Key Regions
        3.9.2. By Key Countries
    3.10. Regional Parent Market Outlook
    3.11. Production and Consumption Statistics
    3.12. Import and Export Statistics
4. Global Market Analysis 2018 to 2022 and Forecast, 2023 to 2033
    4.1. Historical Market Size Value (US$ million) & Volume (Units) Analysis, 2018 to 2022
    4.2. Current and Future Market Size Value (US$ million) & Volume (Units) Projections, 2023 to 2033
        4.2.1. Y to o to Y Growth Trend Analysis
        4.2.2. Absolute $ Opportunity Analysis
5. Global Market Analysis 2018 to 2022 and Forecast 2023 to 2033, By Type
    5.1. Introduction / Key Findings
    5.2. Historical Market Size Value (US$ million) & Volume (Units) Analysis By Type, 2018 to 2022
    5.3. Current and Future Market Size Value (US$ million) & Volume (Units) Analysis and Forecast By Type, 2023 to 2033
        5.3.1. Handheld LCR Meter
        5.3.2. Benchtop LCR Meter
    5.4. Y to o to Y Growth Trend Analysis By Type, 2018 to 2022
    5.5. Absolute $ Opportunity Analysis By Type, 2023 to 2033
6. Global Market Analysis 2018 to 2022 and Forecast 2023 to 2033, By Application
    6.1. Introduction / Key Findings
    6.2. Historical Market Size Value (US$ million) & Volume (Units) Analysis By Application, 2018 to 2022
    6.3. Current and Future Market Size Value (US$ million) & Volume (Units) Analysis and Forecast By Application, 2023 to 2033
        6.3.1. Test Frequency
        6.3.2. Voltage
        6.3.3. Accuracy
        6.3.4. Speed
        6.3.5. Others
    6.4. Y-on-Y Growth Trend Analysis By Application, 2018 to 2022
    6.5. Absolute $ Opportunity Analysis By Application, 2023 to 2033
7. Global Market Analysis 2018 to 2022 and Forecast 2023 to 2033, By Region
    7.1. Introduction
    7.2. Historical Market Size Value (US$ million) & Volume (Units) Analysis By Region, 2018 to 2022
    7.3. Current Market Size Value (US$ million) & Volume (Units) Analysis and Forecast By Region, 2023 to 2033
        7.3.1. North America
        7.3.2. Latin America
        7.3.3. Western Europe
        7.3.4. Eastern Europe
        7.3.5. South Asia and Pacific
        7.3.6. East Asia
        7.3.7. Middle East and Africa
    7.4. Market Attractiveness Analysis By Region
8. North America Market Analysis 2018 to 2022 and Forecast 2023 to 2033, By Country
    8.1. Historical Market Size Value (US$ million) & Volume (Units) Trend Analysis By Market Taxonomy, 2018 to 2022
    8.2. Market Size Value (US$ million) & Volume (Units) Forecast By Market Taxonomy, 2023 to 2033
        8.2.1. By Country
            8.2.1.1. The United States
            8.2.1.2. Canada
        8.2.2. By Type
        8.2.3. By Application
    8.3. Market Attractiveness Analysis
        8.3.1. By Country
        8.3.2. By Type
        8.3.3. By Application
    8.4. Key Takeaways
9. Latin America Market Analysis 2018 to 2022 and Forecast 2023 to 2033, By Country
    9.1. Historical Market Size Value (US$ million) & Volume (Units) Trend Analysis By Market Taxonomy, 2018 to 2022
    9.2. Market Size Value (US$ million) & Volume (Units) Forecast By Market Taxonomy, 2023 to 2033
        9.2.1. By Country
            9.2.1.1. Brazil
            9.2.1.2. Mexico
            9.2.1.3. Rest of Latin America
        9.2.2. By Type
        9.2.3. By Application
    9.3. Market Attractiveness Analysis
        9.3.1. By Country
        9.3.2. By Type
        9.3.3. By Application
    9.4. Key Takeaways
10. Western Europe Market Analysis 2018 to 2022 and Forecast 2023 to 2033, By Country
    10.1. Historical Market Size Value (US$ million) & Volume (Units) Trend Analysis By Market Taxonomy, 2018 to 2022
    10.2. Market Size Value (US$ million) & Volume (Units) Forecast By Market Taxonomy, 2023 to 2033
        10.2.1. By Country
            10.2.1.1. Germany
            10.2.1.2. The United Kingdom
            10.2.1.3. France
            10.2.1.4. Spain
            10.2.1.5. Italy
            10.2.1.6. Rest of Western Europe
        10.2.2. By Type
        10.2.3. By Application
    10.3. Market Attractiveness Analysis
        10.3.1. By Country
        10.3.2. By Type
        10.3.3. By Application
    10.4. Key Takeaways
11. Eastern Europe Market Analysis 2018 to 2022 and Forecast 2023 to 2033, By Country
    11.1. Historical Market Size Value (US$ million) & Volume (Units) Trend Analysis By Market Taxonomy, 2018 to 2022
    11.2. Market Size Value (US$ million) & Volume (Units) Forecast By Market Taxonomy, 2023 to 2033
        11.2.1. By Country
            11.2.1.1. Poland
            11.2.1.2. Russia
            11.2.1.3. Czech Republic
            11.2.1.4. Romania
            11.2.1.5. Rest of Eastern Europe
        11.2.2. By Type
        11.2.3. By Application
    11.3. Market Attractiveness Analysis
        11.3.1. By Country
        11.3.2. By Type
        11.3.3. By Application
    11.4. Key Takeaways
12. South Asia and Pacific Market Analysis 2018 to 2022 and Forecast 2023 to 2033, By Country
    12.1. Historical Market Size Value (US$ million) & Volume (Units) Trend Analysis By Market Taxonomy, 2018 to 2022
    12.2. Market Size Value (US$ million) & Volume (Units) Forecast By Market Taxonomy, 2023 to 2033
        12.2.1. By Country
            12.2.1.1. India
            12.2.1.2. Bangladesh
            12.2.1.3. Australia
            12.2.1.4. New Zealand
            12.2.1.5. Rest of South Asia and Pacific
        12.2.2. By Type
        12.2.3. By Application
    12.3. Market Attractiveness Analysis
        12.3.1. By Country
        12.3.2. By Type
        12.3.3. By Application
    12.4. Key Takeaways
13. East Asia Market Analysis 2018 to 2022 and Forecast 2023 to 2033, By Country
    13.1. Historical Market Size Value (US$ million) & Volume (Units) Trend Analysis By Market Taxonomy, 2018 to 2022
    13.2. Market Size Value (US$ million) & Volume (Units) Forecast By Market Taxonomy, 2023 to 2033
        13.2.1. By Country
            13.2.1.1. China
            13.2.1.2. Japan
            13.2.1.3. South Korea
        13.2.2. By Type
        13.2.3. By Application
    13.3. Market Attractiveness Analysis
        13.3.1. By Country
        13.3.2. By Type
        13.3.3. By Application
    13.4. Key Takeaways
14. Middle East and Africa Market Analysis 2018 to 2022 and Forecast 2023 to 2033, By Country
    14.1. Historical Market Size Value (US$ million) & Volume (Units) Trend Analysis By Market Taxonomy, 2018 to 2022
    14.2. Market Size Value (US$ million) & Volume (Units) Forecast By Market Taxonomy, 2023 to 2033
        14.2.1. By Country
            14.2.1.1. GCC Countries
            14.2.1.2. South Africa
            14.2.1.3. Israel
            14.2.1.4. Rest of Middle East and Africa
        14.2.2. By Type
        14.2.3. By Application
    14.3. Market Attractiveness Analysis
        14.3.1. By Country
        14.3.2. By Type
        14.3.3. By Application
    14.4. Key Takeaways
15. Key Countries Market Analysis
    15.1. The United States
        15.1.1. Pricing Analysis
        15.1.2. Market Share Analysis, 2022
            15.1.2.1. By Type
            15.1.2.2. By Application
    15.2. Canada
        15.2.1. Pricing Analysis
        15.2.2. Market Share Analysis, 2022
            15.2.2.1. By Type
            15.2.2.2. By Application
    15.3. Brazil
        15.3.1. Pricing Analysis
        15.3.2. Market Share Analysis, 2022
            15.3.2.1. By Type
            15.3.2.2. By Application
    15.4. Mexico
        15.4.1. Pricing Analysis
        15.4.2. Market Share Analysis, 2022
            15.4.2.1. By Type
            15.4.2.2. By Application
    15.5. Germany
        15.5.1. Pricing Analysis
        15.5.2. Market Share Analysis, 2022
            15.5.2.1. By Type
            15.5.2.2. By Application
    15.6. The United Kingdom
        15.6.1. Pricing Analysis
        15.6.2. Market Share Analysis, 2022
            15.6.2.1. By Type
            15.6.2.2. By Application
    15.7. France
        15.7.1. Pricing Analysis
        15.7.2. Market Share Analysis, 2022
            15.7.2.1. By Type
            15.7.2.2. By Application
    15.8. Spain
        15.8.1. Pricing Analysis
        15.8.2. Market Share Analysis, 2022
            15.8.2.1. By Type
            15.8.2.2. By Application
    15.9. Italy
        15.9.1. Pricing Analysis
        15.9.2. Market Share Analysis, 2022
            15.9.2.1. By Type
            15.9.2.2. By Application
    15.10. Poland
        15.10.1. Pricing Analysis
        15.10.2. Market Share Analysis, 2022
            15.10.2.1. By Type
            15.10.2.2. By Application
    15.11. Russia
        15.11.1. Pricing Analysis
        15.11.2. Market Share Analysis, 2022
            15.11.2.1. By Type
            15.11.2.2. By Application
    15.12. Czech Republic
        15.12.1. Pricing Analysis
        15.12.2. Market Share Analysis, 2022
            15.12.2.1. By Type
            15.12.2.2. By Application
    15.13. Romania
        15.13.1. Pricing Analysis
        15.13.2. Market Share Analysis, 2022
            15.13.2.1. By Type
            15.13.2.2. By Application
    15.14. India
        15.14.1. Pricing Analysis
        15.14.2. Market Share Analysis, 2022
            15.14.2.1. By Type
            15.14.2.2. By Application
    15.15. Bangladesh
        15.15.1. Pricing Analysis
        15.15.2. Market Share Analysis, 2022
            15.15.2.1. By Type
            15.15.2.2. By Application
    15.16. Australia
        15.16.1. Pricing Analysis
        15.16.2. Market Share Analysis, 2022
            15.16.2.1. By Type
            15.16.2.2. By Application
    15.17. New Zealand
        15.17.1. Pricing Analysis
        15.17.2. Market Share Analysis, 2022
            15.17.2.1. By Type
            15.17.2.2. By Application
    15.18. China
        15.18.1. Pricing Analysis
        15.18.2. Market Share Analysis, 2022
            15.18.2.1. By Type
            15.18.2.2. By Application
    15.19. Japan
        15.19.1. Pricing Analysis
        15.19.2. Market Share Analysis, 2022
            15.19.2.1. By Type
            15.19.2.2. By Application
    15.20. South Korea
        15.20.1. Pricing Analysis
        15.20.2. Market Share Analysis, 2022
            15.20.2.1. By Type
            15.20.2.2. By Application
    15.21. GCC Countries
        15.21.1. Pricing Analysis
        15.21.2. Market Share Analysis, 2022
            15.21.2.1. By Type
            15.21.2.2. By Application
    15.22. South Africa
        15.22.1. Pricing Analysis
        15.22.2. Market Share Analysis, 2022
            15.22.2.1. By Type
            15.22.2.2. By Application
    15.23. Israel
        15.23.1. Pricing Analysis
        15.23.2. Market Share Analysis, 2022
            15.23.2.1. By Type
            15.23.2.2. By Application
16. Market Structure Analysis
    16.1. Competition Dashboard
    16.2. Competition Benchmarking
    16.3. Market Share Analysis of Top Players
        16.3.1. By Regional
        16.3.2. By Type
        16.3.3. By Application
17. Competition Analysis
    17.1. Competition Deep Dive
        17.1.1. Applent Instruments
            17.1.1.1. Overview
            17.1.1.2. Product Portfolio
            17.1.1.3. Profitability by Market Segments
            17.1.1.4. Sales Footprint
            17.1.1.5. Strategy Overview
                17.1.1.5.1. Marketing Strategy
                17.1.1.5.2. Product Strategy
                17.1.1.5.3. Channel Strategy
        17.1.2. B&K Precision
            17.1.2.1. Overview
            17.1.2.2. Product Portfolio
            17.1.2.3. Profitability by Market Segments
            17.1.2.4. Sales Footprint
            17.1.2.5. Strategy Overview
                17.1.2.5.1. Marketing Strategy
                17.1.2.5.2. Product Strategy
                17.1.2.5.3. Channel Strategy
        17.1.3. Chroma ATE Inc
            17.1.3.1. Overview
            17.1.3.2. Product Portfolio
            17.1.3.3. Profitability by Market Segments
            17.1.3.4. Sales Footprint
            17.1.3.5. Strategy Overview
                17.1.3.5.1. Marketing Strategy
                17.1.3.5.2. Product Strategy
                17.1.3.5.3. Channel Strategy
        17.1.4. Doble Engineering Company
            17.1.4.1. Overview
            17.1.4.2. Product Portfolio
            17.1.4.3. Profitability by Market Segments
            17.1.4.4. Sales Footprint
            17.1.4.5. Strategy Overview
                17.1.4.5.1. Marketing Strategy
                17.1.4.5.2. Product Strategy
                17.1.4.5.3. Channel Strategy
        17.1.5. Extech Instruments
            17.1.5.1. Overview
            17.1.5.2. Product Portfolio
            17.1.5.3. Profitability by Market Segments
            17.1.5.4. Sales Footprint
            17.1.5.5. Strategy Overview
                17.1.5.5.1. Marketing Strategy
                17.1.5.5.2. Product Strategy
                17.1.5.5.3. Channel Strategy
        17.1.6. GW Instek
            17.1.6.1. Overview
            17.1.6.2. Product Portfolio
            17.1.6.3. Profitability by Market Segments
            17.1.6.4. Sales Footprint
            17.1.6.5. Strategy Overview
                17.1.6.5.1. Marketing Strategy
                17.1.6.5.2. Product Strategy
                17.1.6.5.3. Channel Strategy
        17.1.7. Hameg Instruments
            17.1.7.1. Overview
            17.1.7.2. Product Portfolio
            17.1.7.3. Profitability by Market Segments
            17.1.7.4. Sales Footprint
            17.1.7.5. Strategy Overview
                17.1.7.5.1. Marketing Strategy
                17.1.7.5.2. Product Strategy
                17.1.7.5.3. Channel Strategy
        17.1.8. Hioki EE
            17.1.8.1. Overview
            17.1.8.2. Product Portfolio
            17.1.8.3. Profitability by Market Segments
            17.1.8.4. Sales Footprint
            17.1.8.5. Strategy Overview
                17.1.8.5.1. Marketing Strategy
                17.1.8.5.2. Product Strategy
                17.1.8.5.3. Channel Strategy
        17.1.9. Keysight Technologies
            17.1.9.1. Overview
            17.1.9.2. Product Portfolio
            17.1.9.3. Profitability by Market Segments
            17.1.9.4. Sales Footprint
            17.1.9.5. Strategy Overview
                17.1.9.5.1. Marketing Strategy
                17.1.9.5.2. Product Strategy
                17.1.9.5.3. Channel Strategy
        17.1.10. MECO Instruments
            17.1.10.1. Overview
            17.1.10.2. Product Portfolio
            17.1.10.3. Profitability by Market Segments
            17.1.10.4. Sales Footprint
            17.1.10.5. Strategy Overview
                17.1.10.5.1. Marketing Strategy
                17.1.10.5.2. Product Strategy
                17.1.10.5.3. Channel Strategy
18. Assumptions & Acronyms Used
19. Research Methodology
Recommendations

Industrial Automation

Stair Lift Motors Market

June 2023

REP-GB-5460

324 pages

Industrial Automation

Metered Dose Squeeze Dispenser Market

November 2024

REP-GB-2208

Upcoming

Explore Industrial Automation Insights

View Reports
Future Market Insights

LCR Meters Market

Schedule a Call