Turbidity Meters Market Size and Share Forecast Outlook 2025 to 2035

The Turbidity Meters Market is estimated to be valued at USD 812.3 million in 2025 and is projected to reach USD 1496.5 million by 2035, registering a compound annual growth rate (CAGR) of 6.3% over the forecast period.
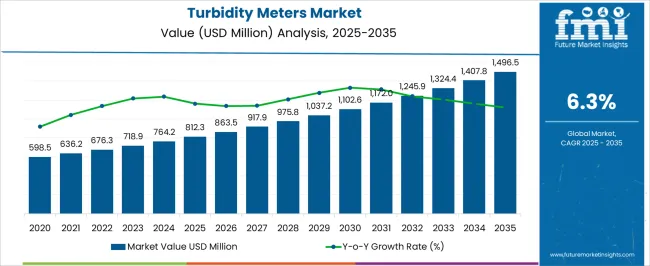
Quick Stats for Turbidity Meters Market

  • Turbidity Meters Market Value (2025): USD 812.3 million
  • Turbidity Meters Market Forecast Value (2035): USD 1496.5 million
  • Turbidity Meters Market Forecast CAGR: 6.3%
  • Leading Segment in Turbidity Meters Market in 2025: Portable Turbidity Meter (46.8%)
  • Key Growth Regions in Turbidity Meters Market: North America, Asia-Pacific, Europe
  • Top Key Players in Turbidity Meters Market: Hach Company, Thermo Fisher Scientific, Xylem Inc., Emerson Electric Co., LaMotte Company, Hanna Instruments, Endress+Hauser Group, Lovibond (Tintometer Group), YSI Inc., METTLER TOLEDO, Horiba Ltd., SWAN Analytical Instruments, GF Piping Systems, AQUALABO Group, KROHNE Group, Sutron Corporation, Hack Company

Turbidity Meters Market Market Value Analysis

Turbidity Meters Market Key Takeaways

Metric Value
Turbidity Meters Market Estimated Value in (2025 E) USD 812.3 million
Turbidity Meters Market Forecast Value in (2035 F) USD 1496.5 million
Forecast CAGR (2025 to 2035) 6.3%

Why is the Turbidity Meters Market Growing?

The Turbidity Meters market is experiencing steady growth as the demand for precise water quality monitoring continues to rise across industrial, municipal, and environmental applications. The current market scenario reflects an increasing focus on water safety standards, regulatory compliance, and sustainable water management practices. The need for efficient monitoring systems has been further emphasized by stricter government regulations and growing concerns over industrial discharge, wastewater treatment, and drinking water contamination.

The future outlook is strengthened by advancements in sensor technologies, miniaturization of equipment, and the integration of smart monitoring systems that offer real-time data analytics. Investments in upgrading aging water infrastructure and rising awareness regarding environmental protection are contributing to expanding market adoption.

Moreover, the need for portable and easy-to-use monitoring solutions is being recognized as a cost-effective method to conduct field testing and rapid assessments As urbanization and industrial activities continue to increase, turbidity meters are expected to play a critical role in ensuring water safety, operational efficiency, and sustainable resource management, presenting new growth opportunities in both established and emerging regions.

Segmental Analysis

The turbidity meters market is segmented by type, end use, distribution channel, application, and geographic regions. By type, turbidity meters market is divided into Portable Turbidity Meter, Laser Turbidity Meter, In-Line Turbidity Meter, Monitoring Turbidity Meter, and Compact Turbidity Meter. In terms of end use, turbidity meters market is classified into Water Treatment, Process Monitoring, and Laboratory.

Based on distribution channel, turbidity meters market is segmented into Distributors, Direct Sales, Sales Force, Company Website, Indirect Sales, and Online Channel. By application, turbidity meters market is segmented into Water And Wastewater Treatment, Water Quality Testing, River Monitoring, Stream Measurement, Reservoir Water Quality Testing, Groundwater Measuring, Effluent, And Industrial Control, Beverage Testing, and Others.

Regionally, the turbidity meters industry is classified into North America, Latin America, Western Europe, Eastern Europe, Balkan & Baltic Countries, Russia & Belarus, Central Asia, East Asia, South Asia & Pacific, and the Middle East & Africa.
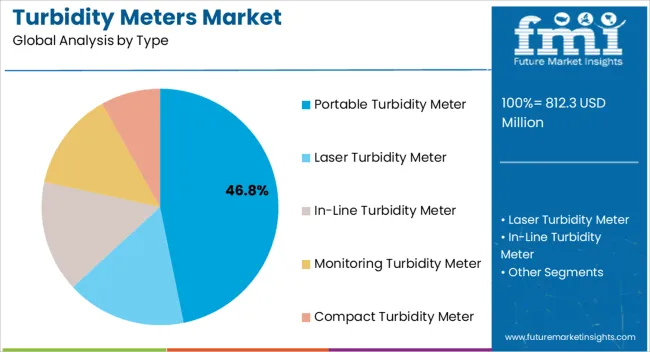
Insights into the Portable Turbidity Meter Segment

Turbidity Meters Market Analysis By Type

The portable turbidity meter segment is expected to hold 46.80% of the market revenue share in 2025, making it the leading type in the turbidity meters market. This segment’s dominance has been driven by the growing need for field-based water quality testing where access to fixed monitoring systems is limited or impractical. Portability has allowed operators to quickly measure turbidity levels at different locations, facilitating real-time assessments and faster decision-making processes.

The segment has also benefited from advances in lightweight designs, improved battery life, and wireless connectivity that enable data logging and remote reporting. The demand from industries requiring frequent monitoring, such as wastewater treatment and environmental testing, has further propelled its adoption.

Additionally, the increasing emphasis on water safety protocols and rapid incident response has made portable solutions preferable in emergency scenarios As cost-effective, user-friendly solutions are sought across sectors, the portable turbidity meter segment is expected to maintain its leadership by offering enhanced flexibility, precision, and adaptability to various monitoring environments.
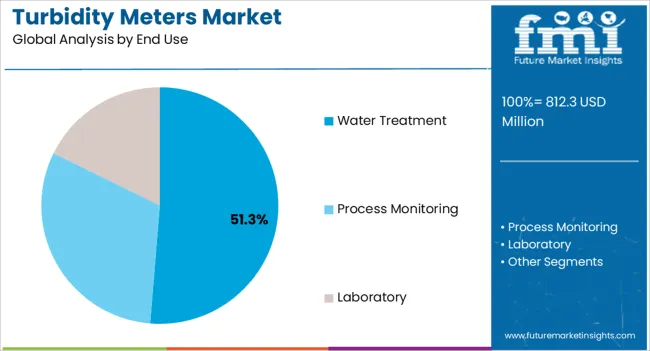
Insights into the Water Treatment Segment

Turbidity Meters Market Analysis By End Use

The water treatment segment is anticipated to hold 51.30% of the turbidity meters market revenue share in 2025, emerging as the largest end-use application. This leadership is being attributed to the critical role turbidity measurement plays in ensuring the efficiency and safety of water treatment processes. Monitoring turbidity levels is essential for controlling filtration systems, chemical dosing, and assessing contamination risks during treatment operations.

The segment has been supported by growing regulatory requirements for treated water quality and heightened public health concerns. Increasing investments in upgrading water treatment plants and expanding access to clean water, especially in developing regions, have further boosted demand. The ability to perform accurate, continuous turbidity monitoring helps operators maintain compliance and avoid costly downtime, making these solutions indispensable in treatment facilities.

The segment’s growth has also been encouraged by rising concerns over industrial wastewater discharge and the need for sustainable water management As governments and organizations continue to invest in water infrastructure and safety initiatives, the water treatment segment is expected to remain a key driver of market expansion.
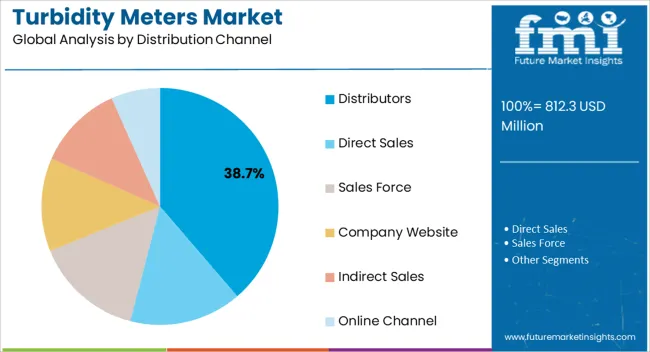
Insights into the Distributors Segment

Turbidity Meters Market Analysis By Distribution Channel

The distributors segment is projected to hold 38.70% of the market revenue share in 2025, making it the largest distribution channel within the turbidity meters market. This leading position is being driven by the increasing demand for localized support, fast delivery, and after-sales services that distributors are well-equipped to provide. Distributors have played a pivotal role in expanding market reach by offering a broad range of products from various manufacturers, allowing customers to choose from multiple options tailored to their specific requirements.

Their ability to provide technical guidance, calibration services, and field support has been critical in ensuring proper equipment usage and reliability. The segment has also benefited from the growing need for on-site installations and training, especially in sectors requiring frequent monitoring.

The expansion of distributor networks into emerging regions has facilitated market penetration where direct manufacturer presence is limited Furthermore, the distributors’ role in providing value-added services and fostering customer relationships has reinforced trust and accelerated adoption across both public and private sector projects, positioning them as vital partners in the turbidity meters market’s sustained growth.

Market Overview

Turbidity Meters Market: Introduction

Turbidity meters are been introduced to keep an eye on the purity of water or liquids. Turbidity meters are used to determine the concentration of suspended particles in a sample of water or liquid by measuring the incident light scattered at right angles from the sample. This is the principle of operation of the turbidity meters of any type. The turbidity meters are mostly used at breweries and water treatment plants.
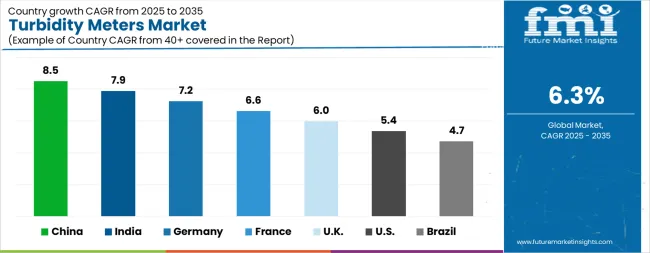
Analysis of Turbidity Meters Market By Key Countries

Turbidity Meters Market Cagr Analysis By Country

Country CAGR
China 8.5%
India 7.9%
Germany 7.2%
France 6.6%
UK 6.0%
USA 5.4%
Brazil 4.7%

Country-wise Analysis

The Turbidity Meters Market is expected to register a CAGR of 6.3% during the forecast period, exhibiting varied country level momentum. China leads with the highest CAGR of 8.5%, followed by India at 7.9%. Developed markets such as Germany, France, and the UK continue to expand steadily, while the USA is likely to grow at consistent rates.

Brazil posts the lowest CAGR at 4.7%, yet still underscores a broadly positive trajectory for the global Turbidity Meters Market. In 2024, Germany held a dominant revenue in the Western Europe market and is expected to grow with a CAGR of 7.2%.

The USA Turbidity Meters Market is estimated to be valued at USD 281.4 million in 2025 and is anticipated to reach a valuation of USD 474.1 million by 2035. Sales are projected to rise at a CAGR of 5.4% over the forecast period between 2025 and 2035. While Japan and South Korea markets are estimated to be valued at USD 42.5 million and USD 26.2 million respectively in 2025.
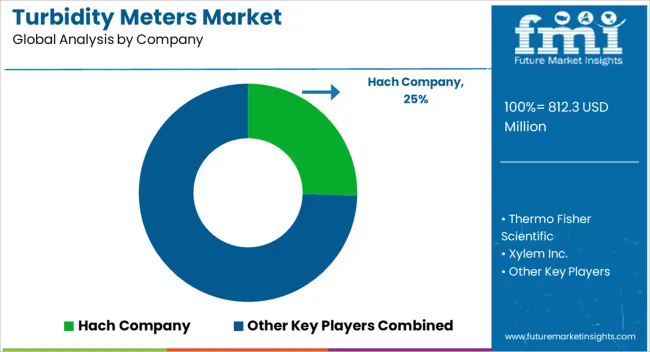
Key Players in the Turbidity Meters Market

Turbidity Meters Market Analysis By Company

  • Hach Company
  • Thermo Fisher Scientific
  • Xylem Inc.
  • Emerson Electric Co.
  • LaMotte Company
  • Hanna Instruments
  • Endress+Hauser Group
  • Lovibond (Tintometer Group)
  • YSI Inc.
  • METTLER TOLEDO
  • Horiba Ltd.
  • SWAN Analytical Instruments
  • GF Piping Systems
  • AQUALABO Group
  • KROHNE Group
  • Sutron Corporation
  • Hack Company

Scope of the Report

Item Value
Quantitative Units USD 812.3 Million
Type Portable Turbidity Meter, Laser Turbidity Meter, In-Line Turbidity Meter, Monitoring Turbidity Meter, and Compact Turbidity Meter
End Use Water Treatment, Process Monitoring, and Laboratory
Distribution Channel Distributors, Direct Sales, Sales Force, Company Website, Indirect Sales, and Online Channel
Application Water And Wastewater Treatment, Water Quality Testing, River Monitoring, Stream Measurement, Reservoir Water Quality Testing, Groundwater Measuring, Effluent, And Industrial Control, Beverage Testing, and Others
Regions Covered North America, Europe, Asia-Pacific, Latin America, Middle East & Africa
Country Covered United States, Canada, Germany, France, United Kingdom, China, Japan, India, Brazil, South Africa
Key Companies Profiled Hach Company, Thermo Fisher Scientific, Xylem Inc., Emerson Electric Co., LaMotte Company, Hanna Instruments, Endress+Hauser Group, Lovibond (Tintometer Group), YSI Inc., METTLER TOLEDO, Horiba Ltd., SWAN Analytical Instruments, GF Piping Systems, AQUALABO Group, KROHNE Group, Sutron Corporation, and Hack Company

Turbidity Meters Market by Segments

Type:

  • Portable Turbidity Meter
  • Laser Turbidity Meter
  • In-Line Turbidity Meter
  • Monitoring Turbidity Meter
  • Compact Turbidity Meter

End Use:

  • Water Treatment
  • Process Monitoring
  • Laboratory

Distribution Channel:

  • Distributors
  • Direct Sales
  • Sales Force
  • Company Website
  • Indirect Sales
  • Online Channel

Application:

  • Water And Wastewater Treatment
  • Water Quality Testing
  • River Monitoring
  • Stream Measurement
  • Reservoir Water Quality Testing
  • Groundwater Measuring
  • Effluent, And Industrial Control
  • Beverage Testing
  • Others

Region:

  • North America
    • USA
    • Canada
    • Mexico
  • Latin America
    • Brazil
    • Chile
    • Rest of Latin America
  • Western Europe
    • Germany
    • UK
    • Italy
    • Spain
    • France
    • Nordic
    • BENELUX
    • Rest of Western Europe
  • Eastern Europe
    • Russia
    • Poland
    • Hungary
    • Balkan & Baltic
    • Rest of Eastern Europe
  • East Asia
    • China
    • Japan
    • South Korea
  • South Asia and Pacific
    • India
    • ASEAN
    • Australia & New Zealand
    • Rest of South Asia and Pacific
  • Middle East & Africa
    • Kingdom of Saudi Arabia
    • Other GCC Countries
    • Turkiye
    • South Africa
    • Other African Union
    • Rest of Middle East & Africa

Frequently Asked Questions

How big is the turbidity meters market in 2025?

The global turbidity meters market is estimated to be valued at USD 812.3 million in 2025.

What will be the size of turbidity meters market in 2035?

The market size for the turbidity meters market is projected to reach USD 1,496.5 million by 2035.

How much will be the turbidity meters market growth between 2025 and 2035?

The turbidity meters market is expected to grow at a 6.3% CAGR between 2025 and 2035.

What are the key product types in the turbidity meters market?

The key product types in turbidity meters market are portable turbidity meter, laser turbidity meter, in-line turbidity meter, monitoring turbidity meter and compact turbidity meter.

Which end use segment to contribute significant share in the turbidity meters market in 2025?

In terms of end use, water treatment segment to command 51.3% share in the turbidity meters market in 2025.

Table of Content

  1. Executive Summary
    • Global Market Outlook
    • Demand-side Trends
    • Supply-side Trends
    • Technology Roadmap Analysis
    • Analysis and Recommendations
  2. Market Overview
    • Market Coverage / Taxonomy
    • Market Definition / Scope / Limitations
  3. Market Background
    • Market Dynamics
      • Drivers
      • Restraints
      • Opportunity
      • Trends
    • Scenario Forecast
      • Demand in Optimistic Scenario
      • Demand in Likely Scenario
      • Demand in Conservative Scenario
    • Opportunity Map Analysis
    • Product Life Cycle Analysis
    • Supply Chain Analysis
    • Investment Feasibility Matrix
    • Value Chain Analysis
    • PESTLE and Porter’s Analysis
    • Regulatory Landscape
    • Regional Parent Market Outlook
    • Production and Consumption Statistics
    • Import and Export Statistics
  4. Global Market Analysis 2020 to 2024 and Forecast, 2025 to 2035
    • Historical Market Size Value (USD Million) Analysis, 2020 to 2024
    • Current and Future Market Size Value (USD Million) Projections, 2025 to 2035
      • Y-o-Y Growth Trend Analysis
      • Absolute $ Opportunity Analysis
  5. Global Market Pricing Analysis 2020 to 2024 and Forecast 2025 to 2035
  6. Global Market Analysis 2020 to 2024 and Forecast 2025 to 2035, By Type
    • Introduction / Key Findings
    • Historical Market Size Value (USD Million) Analysis By Type, 2020 to 2024
    • Current and Future Market Size Value (USD Million) Analysis and Forecast By Type, 2025 to 2035
      • Portable Turbidity Meter
      • Laser Turbidity Meter
      • In-Line Turbidity Meter
      • Monitoring Turbidity Meter
      • Compact Turbidity Meter
    • Y-o-Y Growth Trend Analysis By Type, 2020 to 2024
    • Absolute $ Opportunity Analysis By Type, 2025 to 2035
  7. Global Market Analysis 2020 to 2024 and Forecast 2025 to 2035, By End Use
    • Introduction / Key Findings
    • Historical Market Size Value (USD Million) Analysis By End Use, 2020 to 2024
    • Current and Future Market Size Value (USD Million) Analysis and Forecast By End Use, 2025 to 2035
      • Water Treatment
      • Process Monitoring
      • Laboratory
    • Y-o-Y Growth Trend Analysis By End Use, 2020 to 2024
    • Absolute $ Opportunity Analysis By End Use, 2025 to 2035
  8. Global Market Analysis 2020 to 2024 and Forecast 2025 to 2035, By Distribution Channel
    • Introduction / Key Findings
    • Historical Market Size Value (USD Million) Analysis By Distribution Channel, 2020 to 2024
    • Current and Future Market Size Value (USD Million) Analysis and Forecast By Distribution Channel, 2025 to 2035
      • Distributors
      • Direct Sales
      • Sales Force
      • Company Website
      • Indirect Sales
      • Online Channel
    • Y-o-Y Growth Trend Analysis By Distribution Channel, 2020 to 2024
    • Absolute $ Opportunity Analysis By Distribution Channel, 2025 to 2035
  9. Global Market Analysis 2020 to 2024 and Forecast 2025 to 2035, By Application
    • Introduction / Key Findings
    • Historical Market Size Value (USD Million) Analysis By Application, 2020 to 2024
    • Current and Future Market Size Value (USD Million) Analysis and Forecast By Application, 2025 to 2035
      • Water And Wastewater Treatment
      • Water Quality Testing
      • River Monitoring
      • Stream Measurement
      • Reservoir Water Quality Testing
      • Groundwater Measuring
      • Effluent, And Industrial Control
      • Beverage Testing
      • Others
    • Y-o-Y Growth Trend Analysis By Application, 2020 to 2024
    • Absolute $ Opportunity Analysis By Application, 2025 to 2035
  10. Global Market Analysis 2020 to 2024 and Forecast 2025 to 2035, By Region
    • Introduction
    • Historical Market Size Value (USD Million) Analysis By Region, 2020 to 2024
    • Current Market Size Value (USD Million) Analysis and Forecast By Region, 2025 to 2035
      • North America
      • Latin America
      • Western Europe
      • Eastern Europe
      • East Asia
      • South Asia and Pacific
      • Middle East & Africa
    • Market Attractiveness Analysis By Region
  11. North America Market Analysis 2020 to 2024 and Forecast 2025 to 2035, By Country
    • Historical Market Size Value (USD Million) Trend Analysis By Market Taxonomy, 2020 to 2024
    • Market Size Value (USD Million) Forecast By Market Taxonomy, 2025 to 2035
      • By Country
        • USA
        • Canada
        • Mexico
      • By Type
      • By End Use
      • By Distribution Channel
      • By Application
    • Market Attractiveness Analysis
      • By Country
      • By Type
      • By End Use
      • By Distribution Channel
      • By Application
    • Key Takeaways
  12. Latin America Market Analysis 2020 to 2024 and Forecast 2025 to 2035, By Country
    • Historical Market Size Value (USD Million) Trend Analysis By Market Taxonomy, 2020 to 2024
    • Market Size Value (USD Million) Forecast By Market Taxonomy, 2025 to 2035
      • By Country
        • Brazil
        • Chile
        • Rest of Latin America
      • By Type
      • By End Use
      • By Distribution Channel
      • By Application
    • Market Attractiveness Analysis
      • By Country
      • By Type
      • By End Use
      • By Distribution Channel
      • By Application
    • Key Takeaways
  13. Western Europe Market Analysis 2020 to 2024 and Forecast 2025 to 2035, By Country
    • Historical Market Size Value (USD Million) Trend Analysis By Market Taxonomy, 2020 to 2024
    • Market Size Value (USD Million) Forecast By Market Taxonomy, 2025 to 2035
      • By Country
        • Germany
        • UK
        • Italy
        • Spain
        • France
        • Nordic
        • BENELUX
        • Rest of Western Europe
      • By Type
      • By End Use
      • By Distribution Channel
      • By Application
    • Market Attractiveness Analysis
      • By Country
      • By Type
      • By End Use
      • By Distribution Channel
      • By Application
    • Key Takeaways
  14. Eastern Europe Market Analysis 2020 to 2024 and Forecast 2025 to 2035, By Country
    • Historical Market Size Value (USD Million) Trend Analysis By Market Taxonomy, 2020 to 2024
    • Market Size Value (USD Million) Forecast By Market Taxonomy, 2025 to 2035
      • By Country
        • Russia
        • Poland
        • Hungary
        • Balkan & Baltic
        • Rest of Eastern Europe
      • By Type
      • By End Use
      • By Distribution Channel
      • By Application
    • Market Attractiveness Analysis
      • By Country
      • By Type
      • By End Use
      • By Distribution Channel
      • By Application
    • Key Takeaways
  15. East Asia Market Analysis 2020 to 2024 and Forecast 2025 to 2035, By Country
    • Historical Market Size Value (USD Million) Trend Analysis By Market Taxonomy, 2020 to 2024
    • Market Size Value (USD Million) Forecast By Market Taxonomy, 2025 to 2035
      • By Country
        • China
        • Japan
        • South Korea
      • By Type
      • By End Use
      • By Distribution Channel
      • By Application
    • Market Attractiveness Analysis
      • By Country
      • By Type
      • By End Use
      • By Distribution Channel
      • By Application
    • Key Takeaways
  16. South Asia and Pacific Market Analysis 2020 to 2024 and Forecast 2025 to 2035, By Country
    • Historical Market Size Value (USD Million) Trend Analysis By Market Taxonomy, 2020 to 2024
    • Market Size Value (USD Million) Forecast By Market Taxonomy, 2025 to 2035
      • By Country
        • India
        • ASEAN
        • Australia & New Zealand
        • Rest of South Asia and Pacific
      • By Type
      • By End Use
      • By Distribution Channel
      • By Application
    • Market Attractiveness Analysis
      • By Country
      • By Type
      • By End Use
      • By Distribution Channel
      • By Application
    • Key Takeaways
  17. Middle East & Africa Market Analysis 2020 to 2024 and Forecast 2025 to 2035, By Country
    • Historical Market Size Value (USD Million) Trend Analysis By Market Taxonomy, 2020 to 2024
    • Market Size Value (USD Million) Forecast By Market Taxonomy, 2025 to 2035
      • By Country
        • Kingdom of Saudi Arabia
        • Other GCC Countries
        • Turkiye
        • South Africa
        • Other African Union
        • Rest of Middle East & Africa
      • By Type
      • By End Use
      • By Distribution Channel
      • By Application
    • Market Attractiveness Analysis
      • By Country
      • By Type
      • By End Use
      • By Distribution Channel
      • By Application
    • Key Takeaways
  18. Key Countries Market Analysis
    • USA
      • Pricing Analysis
      • Market Share Analysis, 2024
        • By Type
        • By End Use
        • By Distribution Channel
        • By Application
    • Canada
      • Pricing Analysis
      • Market Share Analysis, 2024
        • By Type
        • By End Use
        • By Distribution Channel
        • By Application
    • Mexico
      • Pricing Analysis
      • Market Share Analysis, 2024
        • By Type
        • By End Use
        • By Distribution Channel
        • By Application
    • Brazil
      • Pricing Analysis
      • Market Share Analysis, 2024
        • By Type
        • By End Use
        • By Distribution Channel
        • By Application
    • Chile
      • Pricing Analysis
      • Market Share Analysis, 2024
        • By Type
        • By End Use
        • By Distribution Channel
        • By Application
    • Germany
      • Pricing Analysis
      • Market Share Analysis, 2024
        • By Type
        • By End Use
        • By Distribution Channel
        • By Application
    • UK
      • Pricing Analysis
      • Market Share Analysis, 2024
        • By Type
        • By End Use
        • By Distribution Channel
        • By Application
    • Italy
      • Pricing Analysis
      • Market Share Analysis, 2024
        • By Type
        • By End Use
        • By Distribution Channel
        • By Application
    • Spain
      • Pricing Analysis
      • Market Share Analysis, 2024
        • By Type
        • By End Use
        • By Distribution Channel
        • By Application
    • France
      • Pricing Analysis
      • Market Share Analysis, 2024
        • By Type
        • By End Use
        • By Distribution Channel
        • By Application
    • India
      • Pricing Analysis
      • Market Share Analysis, 2024
        • By Type
        • By End Use
        • By Distribution Channel
        • By Application
    • ASEAN
      • Pricing Analysis
      • Market Share Analysis, 2024
        • By Type
        • By End Use
        • By Distribution Channel
        • By Application
    • Australia & New Zealand
      • Pricing Analysis
      • Market Share Analysis, 2024
        • By Type
        • By End Use
        • By Distribution Channel
        • By Application
    • China
      • Pricing Analysis
      • Market Share Analysis, 2024
        • By Type
        • By End Use
        • By Distribution Channel
        • By Application
    • Japan
      • Pricing Analysis
      • Market Share Analysis, 2024
        • By Type
        • By End Use
        • By Distribution Channel
        • By Application
    • South Korea
      • Pricing Analysis
      • Market Share Analysis, 2024
        • By Type
        • By End Use
        • By Distribution Channel
        • By Application
    • Russia
      • Pricing Analysis
      • Market Share Analysis, 2024
        • By Type
        • By End Use
        • By Distribution Channel
        • By Application
    • Poland
      • Pricing Analysis
      • Market Share Analysis, 2024
        • By Type
        • By End Use
        • By Distribution Channel
        • By Application
    • Hungary
      • Pricing Analysis
      • Market Share Analysis, 2024
        • By Type
        • By End Use
        • By Distribution Channel
        • By Application
    • Kingdom of Saudi Arabia
      • Pricing Analysis
      • Market Share Analysis, 2024
        • By Type
        • By End Use
        • By Distribution Channel
        • By Application
    • Turkiye
      • Pricing Analysis
      • Market Share Analysis, 2024
        • By Type
        • By End Use
        • By Distribution Channel
        • By Application
    • South Africa
      • Pricing Analysis
      • Market Share Analysis, 2024
        • By Type
        • By End Use
        • By Distribution Channel
        • By Application
  19. Market Structure Analysis
    • Competition Dashboard
    • Competition Benchmarking
    • Market Share Analysis of Top Players
      • By Regional
      • By Type
      • By End Use
      • By Distribution Channel
      • By Application
  20. Competition Analysis
    • Competition Deep Dive
      • Hach Company
        • Overview
        • Product Portfolio
        • Profitability by Market Segments (Product/Age /Sales Channel/Region)
        • Sales Footprint
        • Strategy Overview
          • Marketing Strategy
          • Product Strategy
          • Channel Strategy
      • Thermo Fisher Scientific
      • Xylem Inc.
      • Emerson Electric Co.
      • LaMotte Company
      • Hanna Instruments
      • Endress+Hauser Group
      • Lovibond (Tintometer Group)
      • YSI Inc.
      • METTLER TOLEDO
      • Horiba Ltd.
      • SWAN Analytical Instruments
      • GF Piping Systems
      • AQUALABO Group
      • KROHNE Group
      • Sutron Corporation
      • Hack Company
  21. Assumptions & Acronyms Used
  22. Research Methodology

List of Tables

  • Table 1: Global Turbidity Meters Market Value (USD Mn) Forecast by Region, 2020-2035
  • Table 2: Global Turbidity Meters Market Value (USD Mn) Forecast by Type , 2020-2035
  • Table 3: Global Turbidity Meters Market Value (USD Mn) Forecast by End Use, 2020-2035
  • Table 4: Global Turbidity Meters Market Value (USD Mn) Forecast by Distribution Channel, 2020-2035
  • Table 5: Global Turbidity Meters Market Value (USD Mn) Forecast by Application, 2020-2035
  • Table 6: North America Turbidity Meters Market Value (USD Mn) Forecast by Country, 2020-2035
  • Table 7: North America Turbidity Meters Market Value (USD Mn) Forecast by Type , 2020-2035
  • Table 8: North America Turbidity Meters Market Value (USD Mn) Forecast by End Use, 2020-2035
  • Table 9: North America Turbidity Meters Market Value (USD Mn) Forecast by Distribution Channel, 2020-2035
  • Table 10: North America Turbidity Meters Market Value (USD Mn) Forecast by Application, 2020-2035
  • Table 11: Latin America Turbidity Meters Market Value (USD Mn) Forecast by Country, 2020-2035
  • Table 12: Latin America Turbidity Meters Market Value (USD Mn) Forecast by Type , 2020-2035
  • Table 13: Latin America Turbidity Meters Market Value (USD Mn) Forecast by End Use, 2020-2035
  • Table 14: Latin America Turbidity Meters Market Value (USD Mn) Forecast by Distribution Channel, 2020-2035
  • Table 15: Latin America Turbidity Meters Market Value (USD Mn) Forecast by Application, 2020-2035
  • Table 16: Western Europe Turbidity Meters Market Value (USD Mn) Forecast by Country, 2020-2035
  • Table 17: Western Europe Turbidity Meters Market Value (USD Mn) Forecast by Type , 2020-2035
  • Table 18: Western Europe Turbidity Meters Market Value (USD Mn) Forecast by End Use, 2020-2035
  • Table 19: Western Europe Turbidity Meters Market Value (USD Mn) Forecast by Distribution Channel, 2020-2035
  • Table 20: Western Europe Turbidity Meters Market Value (USD Mn) Forecast by Application, 2020-2035
  • Table 21: Eastern Europe Turbidity Meters Market Value (USD Mn) Forecast by Country, 2020-2035
  • Table 22: Eastern Europe Turbidity Meters Market Value (USD Mn) Forecast by Type , 2020-2035
  • Table 23: Eastern Europe Turbidity Meters Market Value (USD Mn) Forecast by End Use, 2020-2035
  • Table 24: Eastern Europe Turbidity Meters Market Value (USD Mn) Forecast by Distribution Channel, 2020-2035
  • Table 25: Eastern Europe Turbidity Meters Market Value (USD Mn) Forecast by Application, 2020-2035
  • Table 26: East Asia Turbidity Meters Market Value (USD Mn) Forecast by Country, 2020-2035
  • Table 27: East Asia Turbidity Meters Market Value (USD Mn) Forecast by Type , 2020-2035
  • Table 28: East Asia Turbidity Meters Market Value (USD Mn) Forecast by End Use, 2020-2035
  • Table 29: East Asia Turbidity Meters Market Value (USD Mn) Forecast by Distribution Channel, 2020-2035
  • Table 30: East Asia Turbidity Meters Market Value (USD Mn) Forecast by Application, 2020-2035
  • Table 31: South Asia and Pacific Turbidity Meters Market Value (USD Mn) Forecast by Country, 2020-2035
  • Table 32: South Asia and Pacific Turbidity Meters Market Value (USD Mn) Forecast by Type , 2020-2035
  • Table 33: South Asia and Pacific Turbidity Meters Market Value (USD Mn) Forecast by End Use, 2020-2035
  • Table 34: South Asia and Pacific Turbidity Meters Market Value (USD Mn) Forecast by Distribution Channel, 2020-2035
  • Table 35: South Asia and Pacific Turbidity Meters Market Value (USD Mn) Forecast by Application, 2020-2035
  • Table 36: Middle East & Africa Turbidity Meters Market Value (USD Mn) Forecast by Country, 2020-2035
  • Table 37: Middle East & Africa Turbidity Meters Market Value (USD Mn) Forecast by Type , 2020-2035
  • Table 38: Middle East & Africa Turbidity Meters Market Value (USD Mn) Forecast by End Use, 2020-2035
  • Table 39: Middle East & Africa Turbidity Meters Market Value (USD Mn) Forecast by Distribution Channel, 2020-2035
  • Table 40: Middle East & Africa Turbidity Meters Market Value (USD Mn) Forecast by Application, 2020-2035

List of Figures

  • Figure 1: Global Turbidity Meters Market Pricing Analysis
  • Figure 2: Global Turbidity Meters Market Value (USD Mn) Forecast 2020-2035
  • Figure 3: Global Turbidity Meters Market Value Share and BPS Analysis by Type, 2025 and 2035
  • Figure 4: Global Turbidity Meters Market Y-o-Y Growth Comparison by Type, 2025-2035
  • Figure 5: Global Turbidity Meters Market Attractiveness Analysis by Type
  • Figure 6: Global Turbidity Meters Market Value Share and BPS Analysis by End Use, 2025 and 2035
  • Figure 7: Global Turbidity Meters Market Y-o-Y Growth Comparison by End Use, 2025-2035
  • Figure 8: Global Turbidity Meters Market Attractiveness Analysis by End Use
  • Figure 9: Global Turbidity Meters Market Value Share and BPS Analysis by Distribution Channel, 2025 and 2035
  • Figure 10: Global Turbidity Meters Market Y-o-Y Growth Comparison by Distribution Channel, 2025-2035
  • Figure 11: Global Turbidity Meters Market Attractiveness Analysis by Distribution Channel
  • Figure 12: Global Turbidity Meters Market Value Share and BPS Analysis by Application, 2025 and 2035
  • Figure 13: Global Turbidity Meters Market Y-o-Y Growth Comparison by Application, 2025-2035
  • Figure 14: Global Turbidity Meters Market Attractiveness Analysis by Application
  • Figure 15: Global Turbidity Meters Market Value (USD Mn) Share and BPS Analysis by Region, 2025 and 2035
  • Figure 16: Global Turbidity Meters Market Y-o-Y Growth Comparison by Region, 2025-2035
  • Figure 17: Global Turbidity Meters Market Attractiveness Analysis by Region
  • Figure 18: North America Turbidity Meters Market Incremental Dollar Opportunity, 2025-2035
  • Figure 19: Latin America Turbidity Meters Market Incremental Dollar Opportunity, 2025-2035
  • Figure 20: Western Europe Turbidity Meters Market Incremental Dollar Opportunity, 2025-2035
  • Figure 21: Eastern Europe Turbidity Meters Market Incremental Dollar Opportunity, 2025-2035
  • Figure 22: East Asia Turbidity Meters Market Incremental Dollar Opportunity, 2025-2035
  • Figure 23: South Asia and Pacific Turbidity Meters Market Incremental Dollar Opportunity, 2025-2035
  • Figure 24: Middle East & Africa Turbidity Meters Market Incremental Dollar Opportunity, 2025-2035
  • Figure 25: North America Turbidity Meters Market Value Share and BPS Analysis by Country, 2025 and 2035
  • Figure 26: North America Turbidity Meters Market Value Share and BPS Analysis by Type, 2025 and 2035
  • Figure 27: North America Turbidity Meters Market Y-o-Y Growth Comparison by Type, 2025-2035
  • Figure 28: North America Turbidity Meters Market Attractiveness Analysis by Type
  • Figure 29: North America Turbidity Meters Market Value Share and BPS Analysis by End Use, 2025 and 2035
  • Figure 30: North America Turbidity Meters Market Y-o-Y Growth Comparison by End Use, 2025-2035
  • Figure 31: North America Turbidity Meters Market Attractiveness Analysis by End Use
  • Figure 32: North America Turbidity Meters Market Value Share and BPS Analysis by Distribution Channel, 2025 and 2035
  • Figure 33: North America Turbidity Meters Market Y-o-Y Growth Comparison by Distribution Channel, 2025-2035
  • Figure 34: North America Turbidity Meters Market Attractiveness Analysis by Distribution Channel
  • Figure 35: North America Turbidity Meters Market Value Share and BPS Analysis by Application, 2025 and 2035
  • Figure 36: North America Turbidity Meters Market Y-o-Y Growth Comparison by Application, 2025-2035
  • Figure 37: North America Turbidity Meters Market Attractiveness Analysis by Application
  • Figure 38: Latin America Turbidity Meters Market Value Share and BPS Analysis by Country, 2025 and 2035
  • Figure 39: Latin America Turbidity Meters Market Value Share and BPS Analysis by Type, 2025 and 2035
  • Figure 40: Latin America Turbidity Meters Market Y-o-Y Growth Comparison by Type, 2025-2035
  • Figure 41: Latin America Turbidity Meters Market Attractiveness Analysis by Type
  • Figure 42: Latin America Turbidity Meters Market Value Share and BPS Analysis by End Use, 2025 and 2035
  • Figure 43: Latin America Turbidity Meters Market Y-o-Y Growth Comparison by End Use, 2025-2035
  • Figure 44: Latin America Turbidity Meters Market Attractiveness Analysis by End Use
  • Figure 45: Latin America Turbidity Meters Market Value Share and BPS Analysis by Distribution Channel, 2025 and 2035
  • Figure 46: Latin America Turbidity Meters Market Y-o-Y Growth Comparison by Distribution Channel, 2025-2035
  • Figure 47: Latin America Turbidity Meters Market Attractiveness Analysis by Distribution Channel
  • Figure 48: Latin America Turbidity Meters Market Value Share and BPS Analysis by Application, 2025 and 2035
  • Figure 49: Latin America Turbidity Meters Market Y-o-Y Growth Comparison by Application, 2025-2035
  • Figure 50: Latin America Turbidity Meters Market Attractiveness Analysis by Application
  • Figure 51: Western Europe Turbidity Meters Market Value Share and BPS Analysis by Country, 2025 and 2035
  • Figure 52: Western Europe Turbidity Meters Market Value Share and BPS Analysis by Type, 2025 and 2035
  • Figure 53: Western Europe Turbidity Meters Market Y-o-Y Growth Comparison by Type, 2025-2035
  • Figure 54: Western Europe Turbidity Meters Market Attractiveness Analysis by Type
  • Figure 55: Western Europe Turbidity Meters Market Value Share and BPS Analysis by End Use, 2025 and 2035
  • Figure 56: Western Europe Turbidity Meters Market Y-o-Y Growth Comparison by End Use, 2025-2035
  • Figure 57: Western Europe Turbidity Meters Market Attractiveness Analysis by End Use
  • Figure 58: Western Europe Turbidity Meters Market Value Share and BPS Analysis by Distribution Channel, 2025 and 2035
  • Figure 59: Western Europe Turbidity Meters Market Y-o-Y Growth Comparison by Distribution Channel, 2025-2035
  • Figure 60: Western Europe Turbidity Meters Market Attractiveness Analysis by Distribution Channel
  • Figure 61: Western Europe Turbidity Meters Market Value Share and BPS Analysis by Application, 2025 and 2035
  • Figure 62: Western Europe Turbidity Meters Market Y-o-Y Growth Comparison by Application, 2025-2035
  • Figure 63: Western Europe Turbidity Meters Market Attractiveness Analysis by Application
  • Figure 64: Eastern Europe Turbidity Meters Market Value Share and BPS Analysis by Country, 2025 and 2035
  • Figure 65: Eastern Europe Turbidity Meters Market Value Share and BPS Analysis by Type, 2025 and 2035
  • Figure 66: Eastern Europe Turbidity Meters Market Y-o-Y Growth Comparison by Type, 2025-2035
  • Figure 67: Eastern Europe Turbidity Meters Market Attractiveness Analysis by Type
  • Figure 68: Eastern Europe Turbidity Meters Market Value Share and BPS Analysis by End Use, 2025 and 2035
  • Figure 69: Eastern Europe Turbidity Meters Market Y-o-Y Growth Comparison by End Use, 2025-2035
  • Figure 70: Eastern Europe Turbidity Meters Market Attractiveness Analysis by End Use
  • Figure 71: Eastern Europe Turbidity Meters Market Value Share and BPS Analysis by Distribution Channel, 2025 and 2035
  • Figure 72: Eastern Europe Turbidity Meters Market Y-o-Y Growth Comparison by Distribution Channel, 2025-2035
  • Figure 73: Eastern Europe Turbidity Meters Market Attractiveness Analysis by Distribution Channel
  • Figure 74: Eastern Europe Turbidity Meters Market Value Share and BPS Analysis by Application, 2025 and 2035
  • Figure 75: Eastern Europe Turbidity Meters Market Y-o-Y Growth Comparison by Application, 2025-2035
  • Figure 76: Eastern Europe Turbidity Meters Market Attractiveness Analysis by Application
  • Figure 77: East Asia Turbidity Meters Market Value Share and BPS Analysis by Country, 2025 and 2035
  • Figure 78: East Asia Turbidity Meters Market Value Share and BPS Analysis by Type, 2025 and 2035
  • Figure 79: East Asia Turbidity Meters Market Y-o-Y Growth Comparison by Type, 2025-2035
  • Figure 80: East Asia Turbidity Meters Market Attractiveness Analysis by Type
  • Figure 81: East Asia Turbidity Meters Market Value Share and BPS Analysis by End Use, 2025 and 2035
  • Figure 82: East Asia Turbidity Meters Market Y-o-Y Growth Comparison by End Use, 2025-2035
  • Figure 83: East Asia Turbidity Meters Market Attractiveness Analysis by End Use
  • Figure 84: East Asia Turbidity Meters Market Value Share and BPS Analysis by Distribution Channel, 2025 and 2035
  • Figure 85: East Asia Turbidity Meters Market Y-o-Y Growth Comparison by Distribution Channel, 2025-2035
  • Figure 86: East Asia Turbidity Meters Market Attractiveness Analysis by Distribution Channel
  • Figure 87: East Asia Turbidity Meters Market Value Share and BPS Analysis by Application, 2025 and 2035
  • Figure 88: East Asia Turbidity Meters Market Y-o-Y Growth Comparison by Application, 2025-2035
  • Figure 89: East Asia Turbidity Meters Market Attractiveness Analysis by Application
  • Figure 90: South Asia and Pacific Turbidity Meters Market Value Share and BPS Analysis by Country, 2025 and 2035
  • Figure 91: South Asia and Pacific Turbidity Meters Market Value Share and BPS Analysis by Type, 2025 and 2035
  • Figure 92: South Asia and Pacific Turbidity Meters Market Y-o-Y Growth Comparison by Type, 2025-2035
  • Figure 93: South Asia and Pacific Turbidity Meters Market Attractiveness Analysis by Type
  • Figure 94: South Asia and Pacific Turbidity Meters Market Value Share and BPS Analysis by End Use, 2025 and 2035
  • Figure 95: South Asia and Pacific Turbidity Meters Market Y-o-Y Growth Comparison by End Use, 2025-2035
  • Figure 96: South Asia and Pacific Turbidity Meters Market Attractiveness Analysis by End Use
  • Figure 97: South Asia and Pacific Turbidity Meters Market Value Share and BPS Analysis by Distribution Channel, 2025 and 2035
  • Figure 98: South Asia and Pacific Turbidity Meters Market Y-o-Y Growth Comparison by Distribution Channel, 2025-2035
  • Figure 99: South Asia and Pacific Turbidity Meters Market Attractiveness Analysis by Distribution Channel
  • Figure 100: South Asia and Pacific Turbidity Meters Market Value Share and BPS Analysis by Application, 2025 and 2035
  • Figure 101: South Asia and Pacific Turbidity Meters Market Y-o-Y Growth Comparison by Application, 2025-2035
  • Figure 102: South Asia and Pacific Turbidity Meters Market Attractiveness Analysis by Application
  • Figure 103: Middle East & Africa Turbidity Meters Market Value Share and BPS Analysis by Country, 2025 and 2035
  • Figure 104: Middle East & Africa Turbidity Meters Market Value Share and BPS Analysis by Type, 2025 and 2035
  • Figure 105: Middle East & Africa Turbidity Meters Market Y-o-Y Growth Comparison by Type, 2025-2035
  • Figure 106: Middle East & Africa Turbidity Meters Market Attractiveness Analysis by Type
  • Figure 107: Middle East & Africa Turbidity Meters Market Value Share and BPS Analysis by End Use, 2025 and 2035
  • Figure 108: Middle East & Africa Turbidity Meters Market Y-o-Y Growth Comparison by End Use, 2025-2035
  • Figure 109: Middle East & Africa Turbidity Meters Market Attractiveness Analysis by End Use
  • Figure 110: Middle East & Africa Turbidity Meters Market Value Share and BPS Analysis by Distribution Channel, 2025 and 2035
  • Figure 111: Middle East & Africa Turbidity Meters Market Y-o-Y Growth Comparison by Distribution Channel, 2025-2035
  • Figure 112: Middle East & Africa Turbidity Meters Market Attractiveness Analysis by Distribution Channel
  • Figure 113: Middle East & Africa Turbidity Meters Market Value Share and BPS Analysis by Application, 2025 and 2035
  • Figure 114: Middle East & Africa Turbidity Meters Market Y-o-Y Growth Comparison by Application, 2025-2035
  • Figure 115: Middle East & Africa Turbidity Meters Market Attractiveness Analysis by Application
  • Figure 116: Global Turbidity Meters Market - Tier Structure Analysis
  • Figure 117: Global Turbidity Meters Market - Company Share Analysis
Dashboard
Dashboard
Dashboard
Dashboard
Dashboard
Dashboard

Full Research Suite comprises of:

Market outlook & trends analysis

Market outlook & trends analysis

Interviews & case studies

Interviews & case studies

Strategic recommendations

Strategic recommendations

Vendor profiles & capabilities analysis

Vendor profiles & capabilities analysis

5-year forecasts

5-year forecasts

8 regions and 60+ country-level data splits

8 regions and 60+ country-level data splits

Market segment data splits

Market segment data splits

12 months of continuous data updates

12 months of continuous data updates

DELIVERED AS:

PDF EXCEL ONLINE

Full Research Suite


$5000

$7500

$10000

Buy Report Now
Similar Industry Reports

Similar Industry Reports

Ammeters Market
Ammeters Market

Ammeters Market Size and Share Forecast Outlook 2025 to 2035

Ergometers Market
Ergometers Market

Ergometers Market Size and Share Forecast Outlook 2025 to 2035

Rheometers Market
Rheometers Market

Rheometers Market Size and Share Forecast Outlook 2025 to 2035

LCR Meters Market
LCR Meters Market

LCR Meters Market Analysis - Size, Share, and Forecast Outlook 2025 to 2035

Gas Meters Market
Gas Meters Market

Gas Meters Market Growth - Trends & Forecast 2025 to 2035

Manometers Market
Manometers Market

Manometers Market

Micrometers Market
Micrometers Market

Micrometers Market Size and Share Forecast Outlook 2025 to 2035

Viscometers Market
Viscometers Market

Viscometers Market Size and Share Forecast Outlook 2025 to 2035

Flow Meters Market
Flow Meters Market

Flow Meters Market Growth - Trends & Forecast 2025 to 2035

Megohmmeters Market
Megohmmeters Market

Megohmmeters Market Size and Share Forecast Outlook 2025 to 2035

Calorimeters Market
Calorimeters Market

Calorimeters Market Size and Share Forecast Outlook 2025 to 2035

Gloss Meters Market
Gloss Meters Market

Gloss Meters Market

Luminometers Market
Luminometers Market

Luminometers Market

Refractometers Market

Refractometers Market Growth – Trends & Forecast 2018-2027

Inductance Meters Market

Inductance Meters Market Size and Share Forecast Outlook 2025 to 2035

Pocket Pedometers Market

Pocket Pedometers Market

Dial Thermometers Market

Dial Thermometers Market

Spectrophotometers Market

Spectrophotometers Market Size and Share Forecast Outlook 2025 to 2035

Bone Densitometers Market

Bone Densitometers Analysis by Product Type, by Technology and by End User through 2035

Resistivity Meters Market

Resistivity Meters Market

Future Market Insights

Turbidity Meters Market

Chat With MaRIA

Chat With

MaRIA

Hi There, I am MaRIA, Your Market Research Intelligence Assistant. How may I help you?