

- Market Size (2026)
- USD 610.0 Mn
- Forecast (2036)
- USD 1329.2 Mn
- CAGR (2026 to 2036)
- 8.1%
How big is the Pathogen Control Additives Market in 2026?
USD 610.0 million in 2026 and USD 1,329.2 million by 2036 at a 8.1% CAGR.
Sales of pathogen control additives are projected to expand at 8.1% CAGR from 2026 to 2036, expanding the industry valuation from USD 610.0 million in 2026 to USD 1,329.2 million during the forecast period. Demand is tied to the economics of animal production, and producers weigh these additives when use can be linked to safer feed programs and cleaner production outcomes wherever microbial challenge affects performance. FAOSTAT and FAO Livestock Systems frame the production base underlying this demand, while the USDA ERS Feed Grains Database helps explain why feed-cost movement affects additive evaluation.
The operating issue for buyers is validation. A product may perform well in controlled trials, but sourcing teams need evidence covering microbial challenge control, dosage response, and feed-mill handling before an additive enters routine formulation. This requirement keeps supplier selection anchored to proof rather than positioning, pushing manufacturers toward documented trial data, consistent dosage guidance, and formulation support built into the product itself. Facilities differ in how much internal testing capacity they carry, so suppliers able to close that evidence gap directly tend to move faster through evaluation. Investment becomes easier to assess when microbial control efficacy and formulation compatibility are tracked as separate operational outcomes.
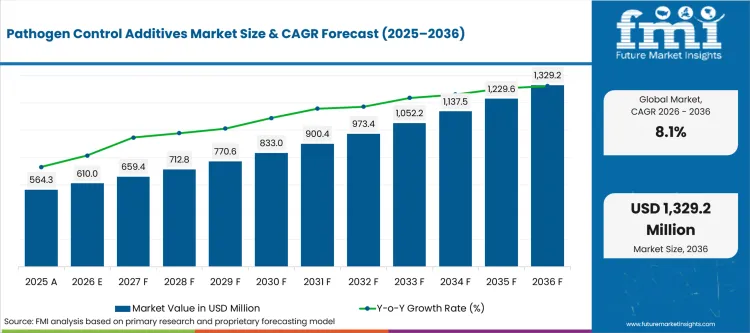
Key Takeaways of Pathogen Control Additives Market
- Demand for pathogen control additives is driven by the need to improve feed safety, control microbial challenges, and maintain animal performance while supporting commercial production efficiency.
- By form, dry formulations are expected to lead with 34.9% share in 2026 (USD 212.9 million), owing to easier storage, handling, blending, and transportation.
- Poultry is the dominant livestock segment, projected to hold 37.2% share in 2026 (USD 226.9 million), supported by continuous monitoring of feed conversion, flock uniformity, and disease management.
- Synthetic sources are estimated to lead the source category with 30.2% share in 2026 (USD 184.2 million), reflecting demand for consistent quality, predictable supply, and tighter specification control.
- Budget constraints, validation costs, dosage economics, and processing stability remain key barriers to broader market adoption, keeping procurement focused on trial validation and cost discipline.
- India and China are expected to form the higher-growth country tier, advancing at 10.34% and 9.34% CAGR respectively through 2036, supported by expanding poultry, dairy, and mixed livestock production alongside large-scale feed manufacturing.
- Competition centers on Kemin Industries, Trouw Nutrition/Selko, Perstorp, EW Nutrition, dsm-firmenich, and Cargill, with vendors differentiating through technical documentation, commercial trial evidence, and application support tailored to regional livestock systems.
Analyst Perspective
"Feed hygiene is becoming a critical performance benchmark, making consistent pathogen-control outcomes a key factor in supplier selection. Manufacturers are looking beyond laboratory data, preferring partners that can demonstrate dependable results in commercial production, provide practical application guidance, and ensure smooth integration into existing feed processes. Suppliers that consistently support customers with technical expertise and operational reliability are likely to establish stronger long-term commercial relationships."
- Nandini Roy Choudhury, Principal Analyst, Food
How is the Pathogen Control Additives Market segmented?
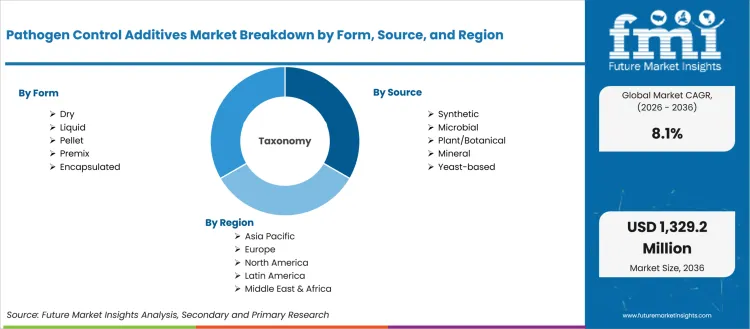
The pathogen control additives industry is segmented by Form, Source, Livestock, Function, and Region.
By form, the market covers Dry, Liquid, Pellet, Premix, and Encapsulated. By source, the market covers Synthetic, Microbial, Plant/Botanical, Mineral, and Yeast-based. By livestock, the market covers Poultry, Swine, Ruminants, Aquaculture, and Equine and pets. By function, the market covers Gut health, Growth performance, Immunity, Nutrient use, and Stress management. By region, the market covers North America, Europe, East Asia, South Asia, and Latin America.
Why does Dry carry weight within Form?
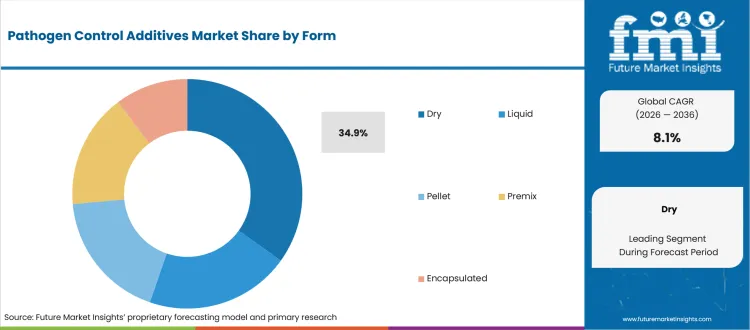
Dry formats hold their position because they fit the way feed mills already operate. Storage, dosing, premix blending, and transport all run more predictably with a dry input than with a liquid or encapsulated one, which matters most at commercial batch volumes where a mill cannot afford handling delays. That same predictability makes dry additives easier to slot into existing production lines without retraining staff or adjusting equipment, which keeps switching costs low for operators already running dry feed programs.
- Dry accounts for 34.9% share within Form in 2026. The segment is valued at USD 196.9 million in 2025, USD 212.9 million in 2026, and USD 463.9 million by 2036, with FAOSTAT providing the livestock and agricultural production baseline used to read demand.
- Shelf stability adds to the appeal. A dry product tolerates a wider range of storage temperatures and humidity levels than liquid alternatives, which matters for mills stocking feed inputs months ahead of use.
What keeps Poultry relevant in the Livestock category?
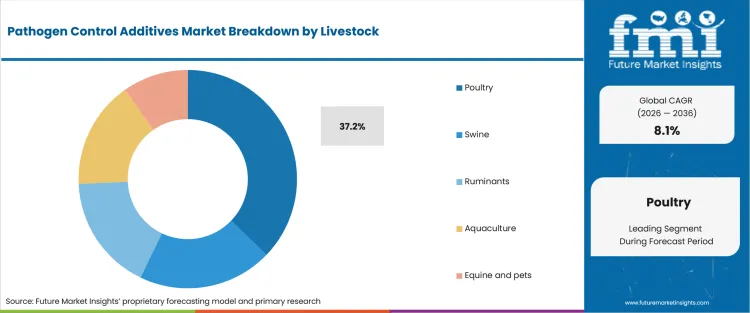
Poultry stays central to demand because production cycles are short and margins are tightly monitored. Integrators track feed conversion, flock uniformity, and gut challenge on a near-continuous basis, which means an additive's effect shows up in the data quickly rather than over a multi-year cycle as in ruminants. That fast feedback loop makes poultry an attractive segment for additive suppliers, since a product that works can prove its value within a single flock cycle instead of waiting several seasons.
- Poultry accounts for 37.2% share within Livestock in 2026. The segment is valued at USD 209.9 million in 2025, USD 226.9 million in 2026, and USD 494.5 million by 2036, with FAO Livestock Systems providing distribution and production context for adoption.
- Flock density raises the stakes. Birds housed at high concentration spread pathogen pressure faster than dispersed livestock, which pushes integrators toward additives with a demonstrated effect on flock-wide uniformity, not just individual bird outcomes.
How do buyers evaluate Synthetic within Source?
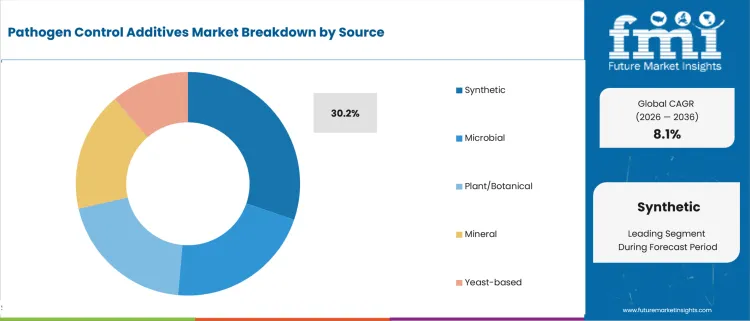
Synthetic sources hold their share because they offer something botanical or microbial inputs often cannot guarantee: consistent concentration batch after batch. Feed formulators working within tight specification tolerances need an input whose potency does not drift with harvest conditions or fermentation variability, and synthetic sources are built to deliver exactly that. This consistency also simplifies regulatory documentation, since a stable specification is easier to defend across audits than an input with natural variability.
- Synthetic accounts for 30.2% share within Source in 2026. The segment is valued at USD 170.4 million in 2025, USD 184.2 million in 2026, and USD 401.4 million by 2036, with the USDA ERS Feed Grains Database supporting the feed-grain supply, use, and price context behind buyer economics.
- Price predictability plays a role too. Synthetic inputs are less exposed to the weather-driven cost swings that affect plant-derived or microbial sources, which helps formulators plan feed costs further in advance.
- w easily the additive holds up in formulation review.
Where does Gut health fit within Function demand?
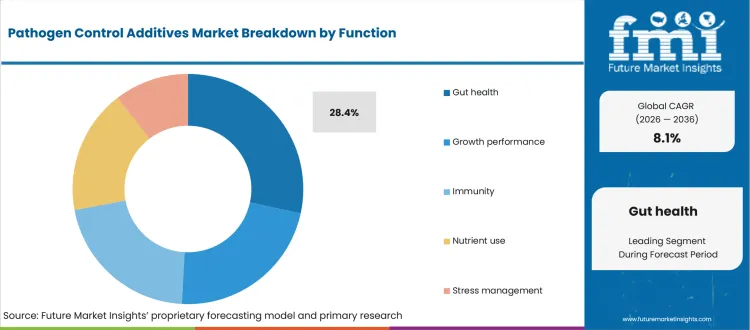
Gut health leads the function category because it addresses a problem visible in daily performance data rather than one confirmed only after slaughter or a full production cycle. Diet changes, weaning stress, and environmental shifts all show up as gut disruption first, so additives targeting this function get evaluated against a steady stream of feed intake and weight gain data. That constant visibility means underperforming products are identified and dropped quickly, while ones that hold up gain repeat use fast.
- Gut health accounts for 28.4% share within Function in 2026. The segment is valued at USD 160.3 million in 2025, USD 173.2 million in 2026, and USD 377.5 million by 2036, with dsm-firmenich Animal Nutrition & Health providing the source context used for this demand view.
- Weaning and transition periods drive most of the demand. Young animals face the highest gut disruption risk during diet changes, which makes this function the first one added to a feed program rather than an optional upgrade later.
What explains the North America position within Region?
North America demand within Region is shaped by how easily the additive can be handled in commercial feeding programs. North America reflects integrated production systems, formal nutrition programs, and established technical-service expectations from suppliers.
- North America accounts for 24.7% share within Region in 2026. The segment is valued at USD 139.4 million in 2025, USD 150.7 million in 2026, and USD 328.3 million by 2036. Cargill feed additives provides the source context used for this demand view.
- For suppliers, the issue is service coverage. Regional demand becomes easier to capture when technical support, distributor reach, and local trial evidence are already in place.
What are the drivers, restraints, and opportunities in the Pathogen Control Additives Market?
Near-term purchases are being shaped by the operating requirement, implementation constraint, and expansion route outlined below.
- The main driver is that feed efficiency, animal performance, protein demand, and input-cost discipline support demand. Buyers need a practical reason to approve spend, so demand improves where evidence can be linked to microbial challenge control, dosage evidence, and feed-mill handling.
- The main restraint is that budget pressure, uncertain farm economics, validation cost, and uneven technical support restrain adoption. Adoption slows when buyer teams cannot see the payback, safety boundary, service owner, or documentation path clearly enough for approval.
- The opportunity lies in precision nutrition, antibiotic-reduction programs, and species-specific additive support. Suppliers can use this route only when they bring practical evidence, local support, and a realistic implementation plan.
Demand is more defensible when the additive addresses a defined feed-program problem. FAOSTAT anchors the livestock and agricultural context, so adoption should be tied to farm economics and measurable response.
These CAGR rows show relative growth rates and do not display country value totals directly. Producer adoption depends on whether additive spend is justified by feed cost and field performance.
Implementation friction comes from trial cost, formulation changes, processing stability, and responsibility for technical service after purchase. Suppliers with clear usage guidance and reliable local support are better positioned than suppliers that offer only product availability.
Which country CAGRs are profiled in the Pathogen Control Additives Market?
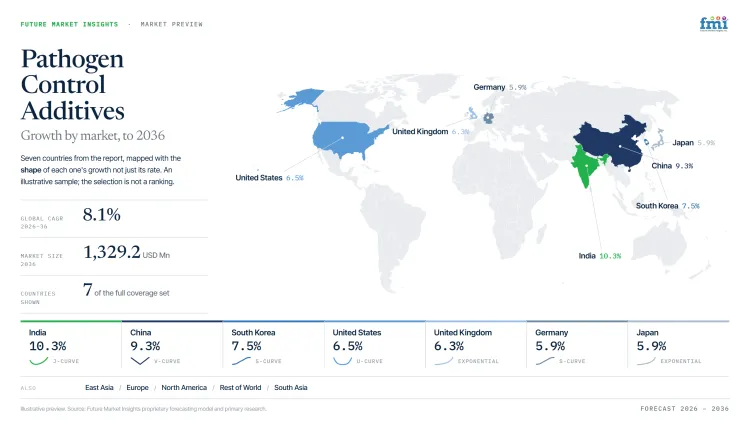
| Country | CAGR |
|---|---|
| United States | 6.54% |
| China | 9.34% |
| India | 10.34% |
| Germany | 5.94% |
| United Kingdom | 6.34% |
| Japan | 5.94% |
| South Korea | 7.54% |
| Rest of World (aggregate) | 8.74% |
How do country-level CAGRs compare in the Pathogen Control Additives Market?
The country comparison spans 4.4 percentage points and highlights four distinct growth groups across the Pathogen Control Additives Market. India, China and the Rest of World form the upper growth tier with 1.6 percentage points separating the three markets. South Korea creates a transition into the middle tier with a 1.2-point difference from the Rest of World. The United States and the United Kingdom remain within a 0.2-point band, while Germany and Japan share the same CAGR, reflecting an identical lower-growth segment. Countries with expanding commercial livestock production, increasing focus on feed biosecurity and greater emphasis on reducing pathogen risks generally demonstrate stronger market growth.
- India leads the comparison as growing adoption of feed hygiene programs and increasing emphasis on disease prevention continue to support demand for pathogen control additives across livestock production.
- China remains 1.0 percentage point below India and reflects a market where commercial feed manufacturers are strengthening feed safety practices and incorporating additives that help control microbial contamination.
- The Rest of World stands 0.6 percentage points below China, reflecting rising adoption across emerging livestock markets as producers place greater emphasis on animal health, feed quality and production efficiency.
- South Korea follows 1.2 percentage points below the Rest of World, highlighting continued investment in feed safety, precision nutrition and livestock health management.
- The United States remains 1.0 percentage point below South Korea as demand continues to grow for feed additives that support pathogen reduction, herd health and consistent production performance.
- The United Kingdom sits 0.2 percentage points below the United States, reflecting steady adoption driven by stringent feed quality standards and increasing focus on livestock health.
- Germany shares the same position as Japan at a CAGR of 5.94%, reflecting mature feed markets where pathogen control additives remain an established component of livestock nutrition programs focused on feed safety and animal performance.
- Japan also records a CAGR of 5.94%, matching Germany and reflecting continued demand supported by advanced feed management practices, disease prevention strategies and high standards for livestock production.
Comparable CAGRs can still produce different market entry conditions. Differences in livestock production systems, feed safety regulations, disease management priorities and adoption of biosecurity practices influence growth patterns and long-term market development. The full report provides country-level CAGR analysis across North America, Latin America, Europe, East Asia, South Asia, Oceania and the Middle East and Africa.
Country-wise Analysis
- United States starts 2026 at USD 122.0 million and is projected to reach USD 229.9 million by 2036, growing at a 6.54% CAGR. Integrator economics and tight feed-cost margins keep buyers focused on measurable farm response rather than promotional claims. Formal nutrition programs at the integrator level mean sourcing teams expect trial data, clear dosage economics, and support structured around integrator decision cycles.
- China's market, valued at USD 109.8 million in 2026, is set to climb to USD 268.1 million by 2036, a 9.34% CAGR. Large feed compounders and high-throughput production push demand toward additives that can survive processing and deliver repeatable results. Suppliers need documented processing-stability evidence and technical support built to scale across large feed operations.
- India records USD 61.00 million in 2026, reaching USD 163.1 million by 2036 at a 10.34% CAGR, the fastest pace in this set. Poultry, dairy, and mixed livestock systems all contribute to demand, but adoption speed hinges on price sensitivity and how much field support suppliers provide. Affordability paired with simple inclusion guidance determines how quickly products move beyond trials into routine use.
- Germany's market stands at USD 48.80 million in 2026 and is expected to reach USD 86.94 million by 2036, expanding at a 5.94% CAGR. Feed buyers here weigh documentation, additive performance, and regulatory discipline carefully before switching formulation programs. Supplier review is likely to focus on documentation quality, regulatory fit, and evidence that feed response stays repeatable.
- The United Kingdom begins 2026 at USD 30.50 million and is on track to hit USD 56.42 million by 2036, a 6.34% CAGR. Demand here is tied to farm economics, retail pressure around animal production practices, and the need for supplier-backed technical guidance. Buyers need guidance that clearly connects additive use with both farm economics and retail-chain expectations.
- Japan's market size of USD 36.60 million in 2026 is forecast to grow to USD 65.20 million by 2036, reflecting a 5.94% CAGR. Compact and quality-conscious production systems require consistent feed response and dependable supplier documentation. Supplier confidence depends on stable product quality, detailed usage guidance, and reliable distributor support.
- South Korea, valued at USD 24.40 million in 2026, is projected to double to USD 50.49 million by 2036 at a 7.54% CAGR. Dense livestock systems combined with feed-cost sensitivity push buyers to look for quick evidence of response under local diet conditions. When performance gaps appear, buyers expect fast technical response backed by local, not generic, results.
- Rest of World enters 2026 at USD 176.9 million and is expected to more than double to USD 408.9 million by 2036, growing at a 8.74% CAGR. Adoption across this group leans heavily on distributor networks, and mixed livestock systems make local technical service just as important as simple product availability. Because livestock systems and feed practices vary so widely across these markets, distributor reach and hands-on local support remain critical to gaining traction.
Who are the notable companies in the Pathogen Control Additives Market?
Kemin Industries, Trouw Nutrition / Selko, EW Nutrition, dsm-firmenich, Cargill, ADM, Lallemand Animal Nutrition, Phileo by Lesaffre, Novonesis, and IFF / Danisco Animal Nutrition & Health are the notable companies shaping this market.
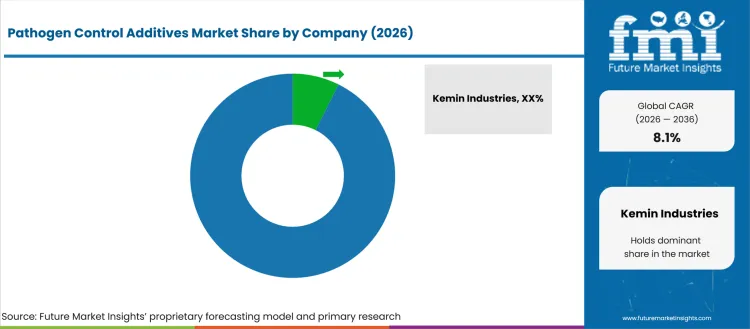
Competition is tied to feed hygiene, acidification, gut-health support, microbial products, and farm-level technical service. Buyers need products that fit feed-mill handling, Salmonella or Enterobacteriaceae control programs, antibiotic-reduction targets, and local compliance rules.
- Kemin Industries, Trouw Nutrition / Selko, EW Nutrition and Perstorp a PETRONAS Chemicals Group company are relevant where pathogen-control discussions begin with feed safety, acidifiers, bacterial toxin control, and hygiene programs. Buyers compare these suppliers on application guidance, feed-mill fit, and the ability to support documented control programs.
- dsm-firmenich, Novonesis, Lallemand Animal Nutrition, Phileo by Lesaffre, and IFF / Danisco Animal Nutrition & Health matter where pathogen pressure is managed through gut-health, enzyme, probiotic, yeast, or microbial solutions. These companies are not interchangeable, so buyers need species-specific evidence and local technical guidance.
- Cargill and ADM are relevant because pathogen-control additives are often purchased as part of wider feed, premix, and nutrition-service programs. Their value increases when large buyers want supply reliability and field support across multiple production sites.
Competitive Benchmarking: Pathogen Control Additives Market
| Company | Pathogen Control Portfolio Fit | Feed Hygiene Support | Field Service Capability | Geographic Footprint |
|---|---|---|---|---|
| Kemin Industries | High | High | Strong | Global |
| Trouw Nutrition / Selko | High | High | Strong | Global |
| Perstorp, a PETRONAS Chemicals Group company | High | Strong | Strong | Global |
| EW Nutrition | High | Strong | Strong | Global |
| dsm-firmenich | Strong | Medium | High | Global |
| Cargill | Strong | Medium | High | Global |
| ADM | Medium | Medium | High | Global |
| Lallemand Animal Nutrition | Strong | Medium | Strong | Global |
| Phileo by Lesaffre | Strong | Medium | Strong | Global |
| Novonesis | Strong | Medium | Strong | Global |
| IFF / Danisco Animal Nutrition & Health | Strong | Medium | Strong | Global |
Source: Future Market Insights competitive analysis, 2026. Ratings reflect relative portfolio relevance, workflow or project fit, service capability, and geographic reach.
Key Players in the Pathogen Control Additives Market
Feed Hygiene and Acidifier Suppliers
- Kemin Industries
- Trouw Nutrition / Selko
- Perstorp
- EW Nutrition
Microbial, Yeast, and Gut-Health Suppliers
- dsm-firmenich
- Novonesis
- Lallemand Animal Nutrition
- Phileo by Lesaffre
- IFF / Danisco Animal Nutrition & Health
Integrated Feed Nutrition Suppliers
- Cargill
- ADM
Pathogen Control Additives Market - Report Scope
| Coverage field | Report scope |
|---|---|
| Market breakdown | Pathogen Control Additives Market Breakdown Form, Source, Livestock, Function, Region |
| Market Definition | The market covers feed additives used to manage microbial hazards in animal diets while supporting feed hygiene and animal performance. |
| Regions Covered | East Asia, Europe, North America, Rest of World, South Asia |
| Countries Covered | United States, China, India, Germany, United Kingdom, Japan, South Korea, Rest of World |
| Key Companies Profiled | Kemin Industries, Trouw Nutrition / Selko, Perstorp, EW Nutrition, dsm-firmenich, Cargill, ADM, Lallemand Animal Nutrition, Phileo by Lesaffre, Novonesis, and IFF / Danisco Animal Nutrition & Health |
| Forecast Period | 2026 to 2036 |
| Approach | Global, country, and segment assessment using public source evidence and market context |
Pathogen Control Additives Market - Research Methodology
| Method | Approach |
|---|---|
| Primary Research | FMI analysts gathered input from manufacturers, service providers, technology developers, distributors, end users, sourcing teams, and subject-matter experts. Interviews examined purchasing decisions, product or service evaluation, adoption barriers, approval requirements, pricing considerations, and expectations for technical or commercial support. Respondents were also asked what evidence is required before a trial, pilot, or initial order develops into regular purchasing. |
| Desk Research | Desk research covered government statistics, regulatory publications, trade data, industry associations, technical literature, standards, company filings, product information, and official corporate announcements. Sources were reviewed for relevance, publication date, geographic coverage, and consistency with the defined market scope. Claims relating to performance, applications, approvals, capacity, investment, and commercial activity were retained only when supported by credible public evidence. |
| Market Sizing and Forecasting | The market model combined the baseline value with historical performance, segment structure, pricing and volume indicators, adoption levels, company participation, and country-level demand conditions. Forecast assumptions considered economic activity, investment trends, regulatory developments, technology adoption, purchasing cycles, supply availability, and barriers to wider market use. Segment and regional estimates were reconciled before the final market total was calculated. |
| Data Validation | Estimates were checked against multiple independent indicators, including public data, company activity, trade patterns, industry developments, and findings from primary interviews. Validation also tested whether products, services, applications, and company revenues fell within the defined market boundaries. Adjacent categories, unsupported claims, overlapping revenues, and activities without direct market relevance were excluded to reduce double counting and maintain consistency across segments and countries. |
Pathogen Control Additives Market by Segments
Pathogen Control Additives Market segmented by Form:
- Dry
- Liquid
- Pellet
- Premix
- Encapsulated
Pathogen Control Additives Market segmented by Source:
- Synthetic
- Microbial
- Plant/Botanical
- Mineral
- Yeast-based
Pathogen Control Additives Market segmented by Livestock:
- Poultry
- Swine
- Ruminants
- Aquaculture
- Equine and pets
Pathogen Control Additives Market segmented by Function:
- Gut health
- Growth performance
- Immunity
- Nutrient use
- Stress management
Pathogen Control Additives Market segmented by Region:
- North America
- Europe
- East Asia
- South Asia
- Latin America
Research Sources and Bibliography
- 1. FAOSTAT. Livestock, crop, food-balance, and agricultural production baseline.
- 2. FAO Livestock Systems. Livestock distribution and animal-production demand context.
- 3. USDA ERS Feed Grains Database. Feed grain supply, use, and price context for feed inputs.
- 4. dsm-firmenich Animal Nutrition & Health.
- 5. Cargill feed additives.
- 6 Novus International.
- 7. Trouw Nutrition Selko feed additives.
- 8. Perstorp animal nutrition.
- 9. EW Nutrition products.
- 10. Novonesis animal biosolutions.
- 11. Lallemand Animal Nutrition.
- 12. Phileo by Lesaffre.
This Report Answers
- What is the expected global value of the Pathogen Control Additives Market in 2026 and 2036?
- What CAGR is forecast for the Pathogen Control Additives Market during the 2026 to 2036 period?
- Which country value and CAGR rows are included for Pathogen Control Additives Market?
- Which segment groups and subsegments carry the higher 2026 shares?
- How do country values reconcile with the global 2026 and 2036 totals?
- Which public sources support the market, country, and segment context?
- Which named companies shape competition in the Pathogen Control Additives Market?
- What adoption risk, procurement risk, or supplier-selection issue should executives watch?
- How does FMI size and forecast Pathogen Control Additives Market across countries and segments?
- Which supplier or development signals affect executive decisions?
Frequently Asked Questions
Why should executives track the Pathogen Control Additives Market?
Executives should track this market because additive use affects feed cost, animal performance, supplier dependence, and formulation risk. The value case is easier to defend when procurement can connect product use to field response and avoid broad nutrition claims.
What business problem does the Pathogen Control Additives Market address?
The market addresses the need to improve safer feed programs and cleaner production outcomes where microbial challenge affects performance while keeping additive spend under control. Buyers need proof that the product works in commercial diets, as well as in controlled demonstrations.
What should procurement leaders evaluate before selecting suppliers?
Procurement leaders should compare formulation fit, dosage economics, processing stability, species-specific evidence, distributor service, and documentation quality. Supplier selection should also check who supports trial work after the first purchase.
What can limit return on investment for buyers?
Return on investment can be limited by weak field evidence, high validation cost, inconsistent raw materials, and poor local technical support. Buyers can reduce this risk by using phased trials and measuring outcomes against feed-cost and performance targets.
How can suppliers build executive confidence?
Suppliers build confidence through field data, clear inclusion guidance, stable supply, and practical nutrition support. The buyer needs to see how the product performs in routine feeding programs before it becomes part of repeat procurement.
Preview the report firsthand - request a free sample
Get SampleGet the brochure for pricing and purchase details.
Get PDFTable of Content
- Key Takeaways
- Market Size and CAGR
- Top Growth Driver
- Fastest Growing Segment
- Leading Region
- Key Companies
- Emerging Opportunities
- Executive Summary
- Global Market Outlook
- Demand-side Trends
- Supply-side Trends
- Technology Roadmap Analysis
- Analysis and Recommendations
- Analyst Perspective (What is happening? Why now? What should investors know?)
- Key Questions Answered
- How large is the market?
- What is the CAGR?
- What are key trends?
- Which region dominates?
- Who are the leaders?
- Market Overview
- Market Coverage / Taxonomy
- Market Definition / Scope / Limitations
- Research Methodology
- Chapter Orientation
- Analytical Lens and Working Hypotheses
- Market Structure, Signals, and Trend Drivers
- Benchmarking and Cross-market Comparability
- Market Sizing, Forecasting, and Opportunity Mapping
- Research Design and Evidence Framework
- Desk Research Programme (Secondary Evidence)
- Expert Input and Fieldwork (Primary Evidence)
- Tooling, Models, and Reference Databases
- Data Engineering and Model Build
- Quality Assurance and Audit Trail
- Market Background
- Market Dynamics (Drivers, Restraints, Opportunity, Trends)
- Scenario Forecast (Optimistic, Likely, Conservative)
- Impact Analysis
- AI Impact
- Sustainability Impact
- Regulatory Impact
- Technology Impact
- Consumer / Buyer Analysis
- Purchase Drivers
- Adoption Barriers
- Buyer Journey
- Opportunity Map Analysis
- Product Life Cycle Analysis
- Supply Chain Analysis
- Investment Feasibility Matrix
- Value Chain Analysis
- PESTLE and Porter's Analysis
- Regulatory Landscape
- Regional Parent Market Outlook
- Production and Consumption Statistics
- Import and Export Statistics
- Global Market Analysis and Forecast, 2021 to 2036
- Historical Market Size Value (USD Million) Analysis, 2021 to 2025
- Current and Future Market Size Value (USD Million) Projections, 2026 to 2036
- Y-o-Y Growth Trend Analysis
- Absolute $ Opportunity Analysis
- Global Market Pricing Analysis, 2021 to 2036
- Global Market Analysis and Forecast, By Form, 2021 to 2036
- Introduction / Key Findings
- Historical Market Size Value (USD Million) Analysis By Form, 2021 to 2025
- Current and Future Market Size Value (USD Million) Analysis and Forecast By Form, 2026 to 2036
- Dry
- Liquid
- Pellet
- Premix
- Encapsulated
- Dry
- Y-o-Y Growth Trend Analysis By Form, 2021 to 2025
- Absolute $ Opportunity Analysis By Form, 2026 to 2036
- Global Market Analysis and Forecast, By Source, 2021 to 2036
- Introduction / Key Findings
- Historical Market Size Value (USD Million) Analysis By Source, 2021 to 2025
- Current and Future Market Size Value (USD Million) Analysis and Forecast By Source, 2026 to 2036
- Synthetic
- Microbial
- Plant/Botanical
- Mineral
- Yeast-based
- Synthetic
- Y-o-Y Growth Trend Analysis By Source, 2021 to 2025
- Absolute $ Opportunity Analysis By Source, 2026 to 2036
- Global Market Analysis and Forecast, By Livestock, 2021 to 2036
- Introduction / Key Findings
- Historical Market Size Value (USD Million) Analysis By Livestock, 2021 to 2025
- Current and Future Market Size Value (USD Million) Analysis and Forecast By Livestock, 2026 to 2036
- Poultry
- Swine
- Ruminants
- Aquaculture
- Equine and pets
- Poultry
- Y-o-Y Growth Trend Analysis By Livestock, 2021 to 2025
- Absolute $ Opportunity Analysis By Livestock, 2026 to 2036
- Global Market Analysis and Forecast, By Function, 2021 to 2036
- Introduction / Key Findings
- Historical Market Size Value (USD Million) Analysis By Function, 2021 to 2025
- Current and Future Market Size Value (USD Million) Analysis and Forecast By Function, 2026 to 2036
- Gut health
- Growth performance
- Immunity
- Nutrient use
- Stress management
- Gut health
- Y-o-Y Growth Trend Analysis By Function, 2021 to 2025
- Absolute $ Opportunity Analysis By Function, 2026 to 2036
- Global Market Analysis and Forecast, By Region, 2021 to 2036
- Introduction
- Historical Market Size Value (USD Million) Analysis By Region, 2021 to 2025
- Current Market Size Value (USD Million) Analysis and Forecast By Region, 2026 to 2036
- North America
- Latin America
- Western Europe
- Eastern Europe
- East Asia
- South Asia and Pacific
- Middle East & Africa
- Market Attractiveness Analysis By Region
- North America Market Analysis and Forecast, By Country, 2021 to 2036
- Historical Market Size Value (USD Million) Trend Analysis By Market Taxonomy, 2021 to 2025
- Market Size Value (USD Million) Forecast By Market Taxonomy, 2026 to 2036
- By Country
- USA
- Canada
- By Form
- By Source
- By Livestock
- By Function
- By Country
- Market Attractiveness Analysis
- By Country
- By Form
- By Source
- By Livestock
- By Function
- Key Takeaways
- Latin America Market Analysis and Forecast, By Country
- Historical Market Size Value (USD Million) Trend Analysis By Market Taxonomy, 2021 to 2025
- Market Size Value (USD Million) Forecast By Market Taxonomy, 2026 to 2036
- By Country
- Brazil
- Mexico
- Chile
- Rest of Latin America
- By Form
- By Source
- By Livestock
- By Function
- By Country
- Market Attractiveness Analysis
- By Country
- By Form
- By Source
- By Livestock
- By Function
- Key Takeaways
- Western Europe Market Analysis and Forecast, By Country
- Historical Market Size Value (USD Million) Trend Analysis By Market Taxonomy, 2021 to 2025
- Market Size Value (USD Million) Forecast By Market Taxonomy, 2026 to 2036
- By Country
- Germany
- UK
- Italy
- Spain
- France
- Nordic
- BENELUX
- Rest of Western Europe
- By Form
- By Source
- By Livestock
- By Function
- By Country
- Market Attractiveness Analysis
- By Country
- By Form
- By Source
- By Livestock
- By Function
- Key Takeaways
- Eastern Europe Market Analysis and Forecast, By Country
- Historical Market Size Value (USD Million) Trend Analysis By Market Taxonomy, 2021 to 2025
- Market Size Value (USD Million) Forecast By Market Taxonomy, 2026 to 2036
- By Country
- Russia
- Poland
- Hungary
- Balkan & Baltic
- Rest of Eastern Europe
- By Form
- By Source
- By Livestock
- By Function
- By Country
- Market Attractiveness Analysis
- By Country
- By Form
- By Source
- By Livestock
- By Function
- Key Takeaways
- East Asia Market Analysis and Forecast, By Country
- Historical Market Size Value (USD Million) Trend Analysis By Market Taxonomy, 2021 to 2025
- Market Size Value (USD Million) Forecast By Market Taxonomy, 2026 to 2036
- By Country
- China
- Japan
- South Korea
- By Form
- By Source
- By Livestock
- By Function
- By Country
- Market Attractiveness Analysis
- By Country
- By Form
- By Source
- By Livestock
- By Function
- Key Takeaways
- South Asia and Pacific Market Analysis and Forecast, By Country
- Historical Market Size Value (USD Million) Trend Analysis By Market Taxonomy, 2021 to 2025
- Market Size Value (USD Million) Forecast By Market Taxonomy, 2026 to 2036
- By Country
- India
- ASEAN
- Australia & New Zealand
- Rest of South Asia and Pacific
- By Form
- By Source
- By Livestock
- By Function
- By Country
- Market Attractiveness Analysis
- By Country
- By Form
- By Source
- By Livestock
- By Function
- Key Takeaways
- Middle East & Africa Market Analysis and Forecast, By Country
- Historical Market Size Value (USD Million) Trend Analysis By Market Taxonomy, 2021 to 2025
- Market Size Value (USD Million) Forecast By Market Taxonomy, 2026 to 2036
- By Country
- Kingdom of Saudi Arabia
- Other GCC Countries
- Türkiye
- South Africa
- Other African Union
- Rest of Middle East & Africa
- By Form
- By Source
- By Livestock
- By Function
- By Country
- Market Attractiveness Analysis
- By Country
- By Form
- By Source
- By Livestock
- By Function
- Key Takeaways
- Key Countries Market Analysis
- USA
- Pricing Analysis
- Market Share Analysis, 2025
- By Form
- By Source
- By Livestock
- By Function
- Canada
- Pricing Analysis
- Market Share Analysis, 2025
- By Form
- By Source
- By Livestock
- By Function
- Mexico
- Pricing Analysis
- Market Share Analysis, 2025
- By Form
- By Source
- By Livestock
- By Function
- Brazil
- Pricing Analysis
- Market Share Analysis, 2025
- By Form
- By Source
- By Livestock
- By Function
- Chile
- Pricing Analysis
- Market Share Analysis, 2025
- By Form
- By Source
- By Livestock
- By Function
- Germany
- Pricing Analysis
- Market Share Analysis, 2025
- By Form
- By Source
- By Livestock
- By Function
- UK
- Pricing Analysis
- Market Share Analysis, 2025
- By Form
- By Source
- By Livestock
- By Function
- Italy
- Pricing Analysis
- Market Share Analysis, 2025
- By Form
- By Source
- By Livestock
- By Function
- Spain
- Pricing Analysis
- Market Share Analysis, 2025
- By Form
- By Source
- By Livestock
- By Function
- France
- Pricing Analysis
- Market Share Analysis, 2025
- By Form
- By Source
- By Livestock
- By Function
- India
- Pricing Analysis
- Market Share Analysis, 2025
- By Form
- By Source
- By Livestock
- By Function
- ASEAN
- Pricing Analysis
- Market Share Analysis, 2025
- By Form
- By Source
- By Livestock
- By Function
- Australia & New Zealand
- Pricing Analysis
- Market Share Analysis, 2025
- By Form
- By Source
- By Livestock
- By Function
- China
- Pricing Analysis
- Market Share Analysis, 2025
- By Form
- By Source
- By Livestock
- By Function
- Japan
- Pricing Analysis
- Market Share Analysis, 2025
- By Form
- By Source
- By Livestock
- By Function
- South Korea
- Pricing Analysis
- Market Share Analysis, 2025
- By Form
- By Source
- By Livestock
- By Function
- Russia
- Pricing Analysis
- Market Share Analysis, 2025
- By Form
- By Source
- By Livestock
- By Function
- Poland
- Pricing Analysis
- Market Share Analysis, 2025
- By Form
- By Source
- By Livestock
- By Function
- Hungary
- Pricing Analysis
- Market Share Analysis, 2025
- By Form
- By Source
- By Livestock
- By Function
- Kingdom of Saudi Arabia
- Pricing Analysis
- Market Share Analysis, 2025
- By Form
- By Source
- By Livestock
- By Function
- Türkiye
- Pricing Analysis
- Market Share Analysis, 2025
- By Form
- By Source
- By Livestock
- By Function
- South Africa
- Pricing Analysis
- Market Share Analysis, 2025
- By Form
- By Source
- By Livestock
- By Function
- USA
- Market Structure Analysis
- Competition Dashboard
- Competition Benchmarking
- Market Share Analysis of Top Players
- By Regional
- By Form
- By Source
- By Livestock
- By Function
- Emerging Startups
- Innovation Benchmarking
- Competition Analysis
- Competition Deep Dive
- Kemin Industries
- Overview
- Product Portfolio
- Profitability by Market Segments
- Sales Footprint
- Strategy Overview
- Marketing Strategy
- Product Strategy
- Channel Strategy
- Trouw Nutrition / Selko
- Perstorp
- EW Nutrition
- dsm-firmenich
- Cargill
- ADM
- Lallemand Animal Nutrition
- Phileo by Lesaffre
- Novonesis
- IFF / Danisco Animal Nutrition & Health
- Kemin Industries
- Case Studies
- Success Stories
- Recent Developments
- Competition Deep Dive
- Assumptions & Acronyms Used


