The global plain bearing market is likely to grow from USD 13.5 billion in 2025 to USD 23.9 billion by 2035, advancing at a CAGR of 5.9%. The plain bearing industry stands at the threshold of a decade-long expansion trajectory that promises to reshape precision engineering and friction management technology.
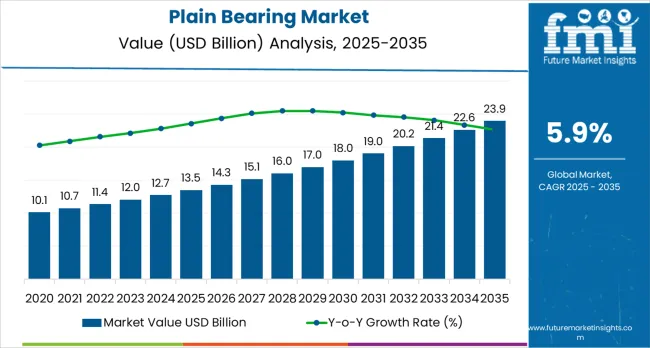
The market's journey represents substantial growth, demonstrating the accelerating adoption of advanced bearing solutions, material innovations, and maintenance-free technologies across automotive manufacturers, industrial machinery producers, and construction equipment operators worldwide.
The first half of the decade (2025-2030) will witness the market climbing from USD 13.5 billion to approximately USD 17.8 billion, adding USD 4.3 billion in value, which constitutes 41.3% of the total forecast growth period. This phase will be characterized by the rapid adoption of self-lubricating bearing technologies, driven by increasing industrial automation and maintenance cost reduction programs worldwide. Advanced materials, including polymer composites, sintered bronze alloys, and PTFE-lined bearings, will become standard expectations rather than premium options.
The latter half (2030-2035) will witness steady growth from USD 17.8 billion to USD 23.9 billion, representing an addition of USD 6.1 billion or 58.7% of the decade's expansion. This period will be defined by mass market penetration of maintenance-free bearing solutions, integration with Industry 4.0 monitoring systems, and seamless compatibility with electric vehicle powertrains and renewable energy equipment. The market trajectory signals fundamental shifts in how engineers and maintenance professionals approach bearing selection and lifecycle management, with participants positioned to benefit from steady demand across multiple industrial segments.
The market demonstrates distinct growth phases with varying market characteristics and competitive dynamics. Between 2025 and 2030, the market progresses through its material innovation adoption phase, expanding from USD 13.5 billion to USD 17.8 billion with steady annual increments averaging 5.7% growth. This period showcases the transition from traditional oil-lubricated bronze bearings to advanced self-lubricating composite materials with enhanced wear resistance and reduced maintenance requirements becoming mainstream features.
The 2025-2030 phase adds USD 4.3 billion to market value, representing 41.3% of total decade expansion. Market maturation factors include standardization of polymer bearing materials, declining manufacturing costs for composite bearings through volume production, and increasing engineering awareness of maintenance-free bearing benefits, reaching 95-98% reliability in industrial applications.
Competitive landscape evolution during this period features established bearing manufacturers like SKF and Schaeffler expanding their plain bearing portfolios while specialized companies focus on application-specific solutions and advanced material formulations.
As per Future Market Insights, one of the most reliable market intelligence firms in the US, from 2030 to 2035, market dynamics shift toward smart bearing integration and green manufacturing, with growth accelerating from USD 17.8 billion to USD 23.9 billion, adding USD 6.1 billion or 58.7% of total expansion. This phase transition logic centers on comprehensive predictive maintenance ecosystems, integration with IoT sensor networks monitoring bearing performance, and deployment across electric vehicle applications requiring low-friction, maintenance-free solutions becoming standard rather than specialized applications.
The competitive environment matures with focus shifting from basic bearing functionality to comprehensive asset management platforms and integration with digital twin technologies for predictive failure analysis.
The market demonstrates strong fundamentals with Journal Bearings capturing dominant share through proven radial load handling capabilities and cost-effective implementation across rotating machinery applications.
Automotive applications drive primary demand, supported by increasing vehicle production volumes and transition toward electric powertrains requiring specialized bearing solutions. Geographic expansion remains concentrated in developed markets with established manufacturing industries, while emerging economies show accelerating adoption rates driven by industrialization and infrastructure development programs.
| Metric | Value |
|---|---|
| Market Value (2025) | USD 13.5 billion |
| Market Forecast (2035) | USD 23.9 billion |
| Growth Rate | 5.9% CAGR |
| Leading Bearing Type | Journal Bearings |
| Primary Application | Automotive |
Market expansion rests on three fundamental shifts driving adoption across industrial and automotive sectors.
Industrial automation advancement creates compelling demand for maintenance-free bearing solutions that provide consistent performance without lubrication service requirements, enabling manufacturers to reduce downtime risks and achieve operational superiority while minimizing lifecycle costs through extended bearing service intervals exceeding 10,000 operating hours.
Electric vehicle proliferation accelerates as automotive manufacturers worldwide transition toward electrified powertrains requiring specialized bearing solutions that minimize friction losses, operate silently without traditional lubrication systems, and withstand the unique operating conditions of electric motors including higher rotational speeds and compact packaging constraints that favor self-lubricating plain bearing designs over traditional rolling element bearings.
Renewable energy expansion drives adoption from wind turbine manufacturers and solar tracking system producers requiring durable bearing solutions that minimize maintenance interventions while maintaining performance in harsh environmental conditions including extreme temperatures, contamination exposure, and infrequent maintenance access scenarios favoring robust plain bearing designs with inherent wear resistance.
Growth faces headwinds from competition with rolling element bearings that offer advantages in certain applications regarding load capacity, speed capabilities, and established engineering familiarity, which may limit plain bearing adoption where traditional ball and roller bearings demonstrate superior performance characteristics.
Material cost pressures also persist regarding advanced polymer composites and specialty bronze alloys that command premium pricing compared to basic steel bearings, potentially limiting adoption in cost-sensitive applications and emerging market segments prioritizing initial purchase price over lifecycle cost considerations.
The plain bearing market represents a transformative growth opportunity, expanding from USD 13.5 billion in 2025 to USD 23.9 billion by 2035 at a 5.9% CAGR. As industries worldwide prioritize maintenance reduction, energy efficiency enhancement, and operational reliability, advanced plain bearing solutions have evolved from commodity components to precision-engineered products, enabling superior friction management, extended service life, and supporting industrial excellence across automotive, heavy machinery, renewable energy, and aerospace applications.
The convergence of maintenance cost pressures, industrial automation maturity, electric vehicle adoption acceleration, and material science innovations creates unprecedented adoption momentum. Advanced bearing designs offering superior wear resistance, self-lubricating capabilities, and contamination tolerance will capture premium market positioning, while geographic expansion into emerging industrial markets and scalable manufacturing will drive volume leadership.
Primary Classification: The market segments by bearing type into Journal Bearings, Linear Bearings, Thrust Bearings, and Spherical Bearings categories, representing the evolution from basic radial load support to comprehensive multi-directional load management solutions for complex mechanical systems.
Material Segmentation: Material type classification divides the market into Bronze Bearings, Polymer Composite Bearings, Steel-backed Bearings, and Aluminum Alloy variants, reflecting distinct requirements for load capacity, friction characteristics, temperature resistance, and environmental compatibility across different applications.
End-Use Breakdown: Application segmentation covers Automotive, Construction &Mining Equipment, Industrial Machinery, Aerospace &Defense, Renewable Energy, and Marine sectors, demonstrating diverse requirements for passenger vehicles, heavy-duty equipment, precision manufacturing equipment, and specialized industrial applications.
Lubrication Classification: Lubrication type segments include Oil-Lubricated, Grease-Lubricated, and Self-Lubricating (maintenance-free) categories, addressing operational preferences for traditional fluid lubrication versus modern maintenance-free designs incorporating solid lubricants.
Load Direction: Load type classification encompasses Radial Load (journal), Axial Load (thrust), and Combined Load (spherical) bearings, reflecting mechanical engineering requirements for specific force direction handling in shaft support applications.
Regional Classification: Geographic distribution covers North America, Europe, Asia Pacific, Latin America, and Middle East &Africa, with developed markets maintaining leadership through advanced manufacturing while emerging economies show accelerating growth patterns driven by industrialization and infrastructure development programs.
The segmentation structure reveals technology progression from traditional lubricated metallic bearings toward advanced maintenance-free composite designs with enhanced performance characteristics, while application diversity spans from high-volume automotive components to specialized aerospace bearings requiring stringent certification and testing protocols.
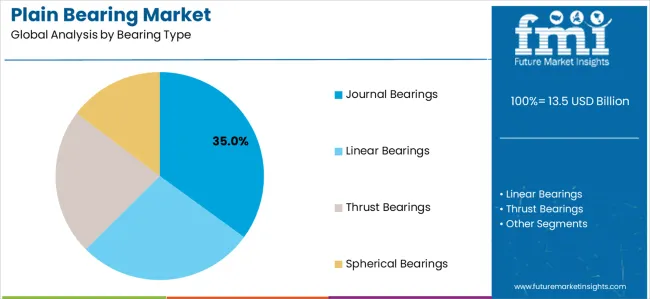
Market Position: Journal Bearings command the leading position in the market with approximately 35.0% market share through versatile radial load support capabilities, proven performance in rotating shaft applications, and comprehensive product range spanning simple bushings to complex multi-layer engineered bearings that enable mechanical designers to specify appropriate solutions across diverse speed, load, and environmental operating conditions without significant design modifications or specialized mounting requirements.
Value Drivers: The segment benefits from universal applicability across automotive engines, industrial electric motors, pumps, compressors, gearboxes, and general machinery where rotating shafts require radial support. Journal bearing designs accommodate various configurations including solid bushings for simple installations, flanged bearings for axial constraint, wrapped bushings for split housing assemblies, and thrust washers for combined radial-axial load scenarios. Manufacturing economies of scale from high-volume production enable competitive pricing across bronze bushings ($2-15), polymer composite bearings ($5-35), and precision-engineered bearings ($20-200+) depending on size, material specification, and performance requirements.
Competitive Advantages: Journal bearings differentiate through established design guidelines, extensive application database spanning decades of successful implementations, and compatibility with existing shaft and housing dimensions standardized under ISO 3547, DIN 1494, and SAE standards simplifying bearing selection and replacement procedures. Material innovations including PTFE-lined steel-backed bearings, graphite-impregnated bronze, and advanced polymer composites (PEEK, PAI, POM) extend performance capabilities while maintaining dimensional interchangeability with traditional bearing designs.
Key market characteristics:
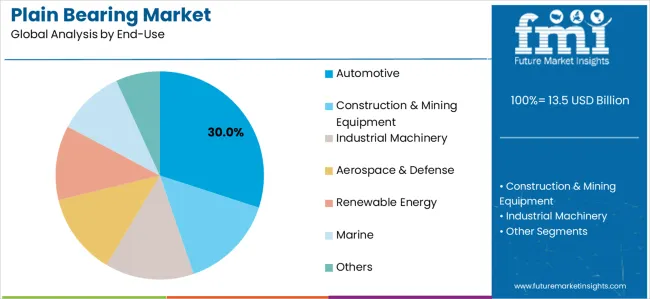
Market Context: Automotive applications dominate the Plain Bearing market with approximately 30.0% market share due to widespread utilization across passenger vehicles, commercial trucks, and electric vehicles requiring cost-effective, reliable bearing solutions for engine components, transmission systems, suspension assemblies, and chassis applications that optimize vehicle performance while maintaining affordable manufacturing costs and predictable service life aligned with warranty requirements and consumer durability expectations.
Appeal Factors: Automotive engineers prioritize bearing solutions offering proven reliability across multi-million unit production volumes, cost-effectiveness supporting target vehicle pricing, and performance consistency across global climate conditions from Arctic cold starts to desert heat exposure. The segment benefits from substantial automotive production volumes exceeding 80 million vehicles annually worldwide, creating massive demand for plain bearings with each vehicle containing 50-150 plain bearing applications including engine connecting rod bearings, camshaft bushings, piston pin bearings, transmission shift rail bushings, suspension control arm bushings, and steering linkage components.
Growth Drivers: Electric vehicle proliferation creates specialized plain bearing demand for motor shaft support requiring low-friction designs minimizing energy losses, reduction gear systems operating at high speeds with compact packaging, and chassis components maintaining performance without traditional lubrication access common in ICE vehicle designs. Lightweighting initiatives drive adoption of aluminum and polymer composite bearings reducing unsprung mass in suspension systems while maintaining durability requirements. Emission regulations push adoption of low-friction bearing technologies including diamond-like carbon coatings and advanced polymer liners reducing parasitic losses and improving fuel economy compliance with increasingly stringent CAFE and EU emission standards.
Market Challenges: Electric vehicle transition eliminates certain bearing applications including ICE engine bearings while creating new opportunities in motor support and reduction gear systems. Price pressure from automotive OEMs pursuing cost reduction targets may compress margins on commodity bearing applications requiring manufacturers to differentiate through technical service, quality consistency, and just-in-time delivery capabilities.
Application dynamics include:
Growth Accelerators: Industrial automation advancement drives primary adoption as manufacturers implement predictive maintenance strategies and minimize unplanned downtime through reliable bearing solutions, with self-lubricating plain bearings reducing maintenance labor costs by 60-80% compared to traditional lubricated bearings requiring periodic service intervals. Research indicates maintenance-free bearings extend service intervals from typical 2,000-5,000 hours for greased rolling element bearings to 20,000-50,000 hours for polymer composite and PTFE-lined plain bearings, creating compelling total cost of ownership advantages despite 20-40% higher initial purchase prices.
Growth Inhibitors: Competition from rolling element bearings limits plain bearing adoption in applications prioritizing higher load capacity per unit volume, with ball and roller bearings offering 3-5x load density advantages in radial applications and 10-15x advantages in thrust applications where space constraints favor compact rolling element designs. Speed limitations persist regarding plain bearing applications, with polymer composite bearings typically limited to 5 m/s sliding velocities while metallic bearings requiring hydrodynamic lubrication face challenges above 15-20 m/s where rolling element bearings demonstrate superior performance without fluid film lubrication requirements and associated oil circulation system complexity.
Market Evolution Patterns: Adoption accelerates in maintenance-intensive industries including paper mills, steel production, cement manufacturing, and power generation where bearing service costs justify premium pricing for maintenance-free solutions, with geographic concentration in Western Europe and North America transitioning toward mainstream adoption in China, India, and Southeast Asian markets as labor costs increase and maintenance workforce availability constraints drive automation investment. Technology development focuses on smart bearing systems incorporating embedded sensors monitoring temperature, vibration, and wear indicators enabling predictive maintenance and digital twin integration, with prototype developments from SKF, Schaeffler, and NTN demonstrating IoT-connected plain bearings providing continuous condition monitoring supporting Industry 4.0 manufacturing initiatives.
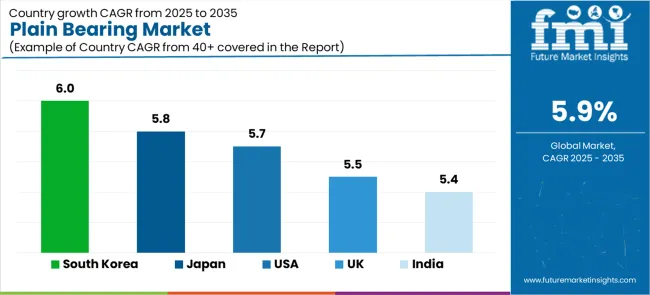
The market demonstrates varied regional dynamics with Growth Leaders including the European Union (6.2% CAGR) and South Korea (6.0% CAGR), where advanced manufacturing capabilities and a strong automotive base drive expansion.
Steady Performers include Japan (5.8% CAGR), the United States (5.7% CAGR), and India (5.4% CAGR), supported by robust industrial machinery sectors, aerospace manufacturing, and in India’s case, rapid automotive production growth and infrastructure development fueling rising demand for cost-effective bearing solutions. Mature Markets feature the United Kingdom (5.5% CAGR), where automotive and industrial equipment output underpins consistent expansion, further supported by engineering services and aftermarket demand.
| Country/Region | CAGR (2025-2035) |
|---|---|
| South Korea | 6.0% |
| Japan | 5.8% |
| United States | 5.7% |
| United Kingdom | 5.5% |
| India | 5.4% |
Regional synthesis reveals European markets leading growth through automotive industry strength (particularly Germany) and industrial machinery excellence, while Asian markets including China and India show strong expansion driven by manufacturing sector growth and infrastructure development programs. North American markets maintain steady advancement supported by aerospace manufacturing, heavy equipment production, and industrial automation adoption.
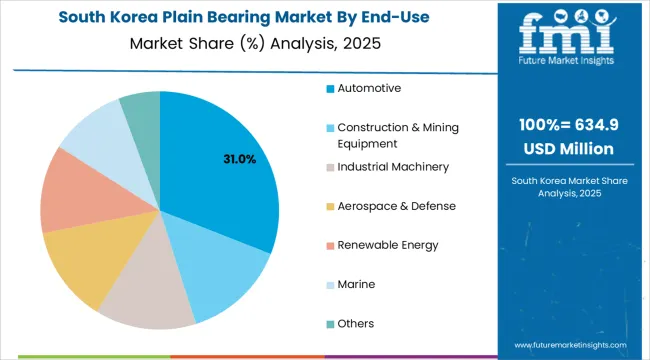
South Korea demonstrates robust market development with 6.0% CAGR through 2035, driven by automotive manufacturing strength from Hyundai Motor Group (Hyundai, Kia, Genesis brands) producing 7+ million vehicles annually and incorporating advanced plain bearing solutions across powertrain and chassis applications. Shipbuilding industry leadership through Korean shipyards (Hyundai Heavy Industries, Samsung Heavy Industries, Daewoo Shipbuilding) creates specialized bearing demand for marine propulsion systems, deck machinery, and cargo handling equipment requiring corrosion-resistant designs and reliable performance in saltwater environments. Industrial robot manufacturing excellence positions South Korea as global leader in factory automation equipment utilizing precision linear bearings and maintenance-free plain bearings in robotic joints, enabling 24/7 operation supporting manufacturing productivity objectives.
Korean bearing manufacturers and suppliers demonstrate rapid technology adoption implementing advanced materials including self-lubricating polymers, developing smart bearing solutions with embedded sensors, and investing in Industry 4.0 manufacturing capabilities supporting domestic automotive and electronics sectors. Government support for advanced manufacturing through technology development programs, research grants, and export promotion initiatives accelerates bearing technology innovation aligned with national industrial policy objectives promoting high-value manufacturing capabilities and reducing import dependency for critical components.
Market Intelligence Brief:
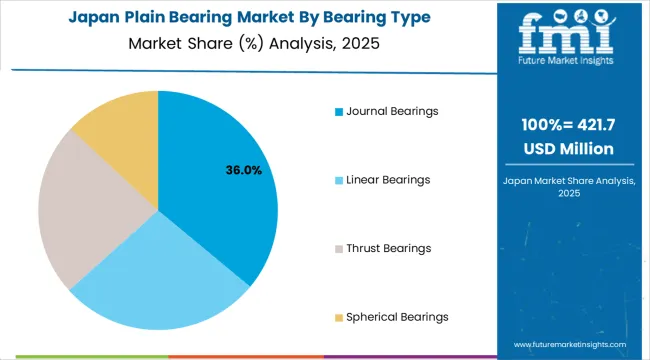
Japan's advanced bearing market demonstrates sophisticated plain bearing deployment with 5.8% CAGR through 2035, distinguished by engineering excellence from leading bearing manufacturers including NTN Corporation, JTEKT Corporation (Koyo brand), and NSK Ltd. maintaining global technology leadership through continuous innovation in materials, manufacturing processes, and application engineering.
Automotive industry concentration including Toyota, Honda, Nissan, Mazda, and Subaru creates massive bearing demand spanning passenger vehicles, commercial trucks, and motorcycles, with Japanese precision manufacturing standards driving plain bearing quality requirements and performance specifications adopted globally.
Industrial machinery strength in machine tools, robotics, construction equipment (Komatsu, Hitachi Construction), and factory automation systems sustains commercial bearing demand across diverse applications requiring reliable components supporting lean manufacturing philosophies focusing minimal downtime and predictable maintenance scheduling.
Japanese bearing companies prioritize research and development investment averaging 3-5% of revenues supporting material innovations including advanced bronze alloys, polymer composite formulations, and surface treatment technologies enhancing bearing performance while extending service life. Manufacturing excellence through implementation of total quality management, statistical process control, and continuous improvement (kaizen) philosophies ensures bearing dimensional accuracy, surface finish quality, and material consistency meeting stringent automotive and industrial equipment specifications. Export strength positions Japanese bearing manufacturers as preferred suppliers to global automotive OEMs and machinery manufacturers valuing quality reputation, technical support capabilities, and supply chain reliability essential for just-in-time manufacturing operations.
Performance Metrics:
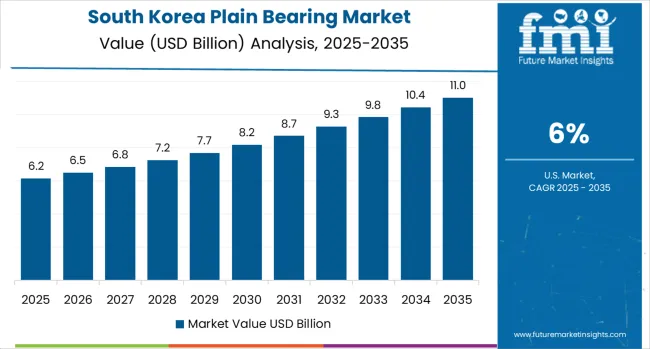
The USA market prioritizes diversified plain bearing applications spanning automotive manufacturing from Detroit Big Three (GM, Ford, Stellantis), aerospace industry concentration in Seattle, Wichita, and Southern California supporting Boeing and defense contractors, and agricultural equipment production centered in Midwest supporting John Deere, CNH Industrial, and AGCO Corporation machinery platforms.
The country demonstrates 5.7% CAGR through 2035, driven by industrial machinery modernization investments, construction equipment demand supporting infrastructure development, and specialized bearing applications in oil &gas production equipment, mining machinery, and power generation systems requiring durable components operating in harsh environments.
Market dynamics reflect mature industrial economy characteristics with replacement bearing demand representing 60-70% of market volume compared to OEM new equipment installation, creating sustained aftermarket opportunities through distributors, industrial supply houses, and maintenance service providers.
American bearing manufacturers and distributors prioritize technical service capabilities including application engineering support, failure analysis expertise, and inventory management programs supporting industrial customers'maintenance operations and minimizing production disruptions through rapid component availability. Distribution channels feature comprehensive industrial distributor networks including Motion Industries (Genuine Parts Company), Applied Industrial Technologies, and regional distributors maintaining extensive bearing inventories and providing value-added services including machining, installation, and predictive maintenance programs incorporating vibration analysis and thermographic monitoring identifying bearing degradation before catastrophic failure.
Performance Metrics:
The United Kingdom demonstrates steady market development with 5.5% CAGR through 2035, driven by automotive manufacturing presence including Jaguar Land Rover (Tata Motors subsidiary), Nissan Sunderland plant, Toyota Burnaston facility, and premium brands (Bentley, Rolls-Royce Motor Cars, Aston Martin, McLaren) requiring advanced bearing solutions supporting luxury vehicle performance standards and reliability expectations.
Aerospace industry concentration around Bristol, Derby, and Scottish facilities supporting Rolls-Royce aero engines, BAE Systems defense aircraft, and Airbus wing production creates specialized bearing demand requiring high-temperature capability, lightweight designs, and stringent qualification testing demonstrating reliability across extreme operating conditions.
Industrial equipment heritage spanning textile machinery, food processing equipment, and offshore oil platforms maintains commercial bearing demand despite manufacturing sector contraction, while engineering service sector growth creates opportunities for bearing remanufacturing, application engineering consultancy, and condition monitoring services supporting British and European industrial customers'maintenance operations.
UK bearing distributors and suppliers prioritize technical expertise, rapid delivery capabilities, and comprehensive product range sourcing bearings from global manufacturers including FAG (Schaeffler), SKF, Timken, and Asian suppliers supporting diverse customer requirements across automotive aftermarket, industrial maintenance, and specialized equipment applications. Brexit implications create supply chain adjustments affecting component sourcing patterns, customs procedures, and regulatory alignment with European standards, requiring bearing suppliers to adapt business practices ensuring continued product availability and competitive pricing supporting British manufacturers and maintenance operations.
Strategic Market Indicators:
China establishes dominant market position through world's largest automotive production exceeding 30 million vehicles annually, comprehensive industrial machinery manufacturing supporting domestic infrastructure development and global exports, and construction equipment production serving domestic urbanization programs and Belt &Road Initiative infrastructure projects across Asia, Africa, and Latin America.
Market expansion reflects continued industrialization despite mature coastal provinces, with interior region development driving machinery demand and manufacturing capacity expansion into Sichuan, Chongqing, Henan, and other provinces seeking economic development through industrial investment and infrastructure enhancement.
Chinese bearing manufacturers including local producers (Wanxiang Group, C&U Group, ZWZ Bearing) and international joint ventures capture significant market share through cost-competitive pricing, domestic distribution advantages, and increasing quality capabilities approaching international standards for commercial applications while premium segments maintain preference for imports from Japan, Europe, and United States.
Government industrial policies focusing manufacturing quality improvement, technology development, and import substitution support domestic bearing industry advancement through research subsidies, manufacturing equipment modernization programs, and export promotion initiatives positioning Chinese bearing manufacturers for increased international market penetration.
Market Intelligence Brief:
India is projected to grow at a CAGR of 5.4% in the plain bearing market, emerging as one of the most dynamic regions worldwide. The country demonstrates significant potential through its expanding automotive sector, producing more than 5 million vehicles annually, alongside massive infrastructure development programs such as highways, metros, and industrial corridors that require construction equipment and material handling systems.
India’s industrial machinery production base supports textile, pharmaceutical, and food processing industries that cater to both the large domestic market and growing export opportunities. Market expansion is further driven by government-led Make in India initiatives, the National Infrastructure Pipeline, and favorable demographics, including a growing middle class fueling consumer demand for automobiles, appliances, and industrial products incorporating plain bearing components.
Indian bearing manufacturers including leading domestic producers such as NBC Bearings, Timken India, and SKF India, as well as numerous small-scale units—are building greater technical capabilities. At the same time, international suppliers are investing in local production facilities and distribution networks to address rising demand.
The market remains price-sensitive, with buyers prioritizing cost-effectiveness, local availability, and reliable performance over premium specifications. This dynamic is creating opportunities for standardized bearing designs and efficient manufacturing processes that can support competitive pricing objectives while serving India’s high-growth demand environment.
Strategic Market Considerations:
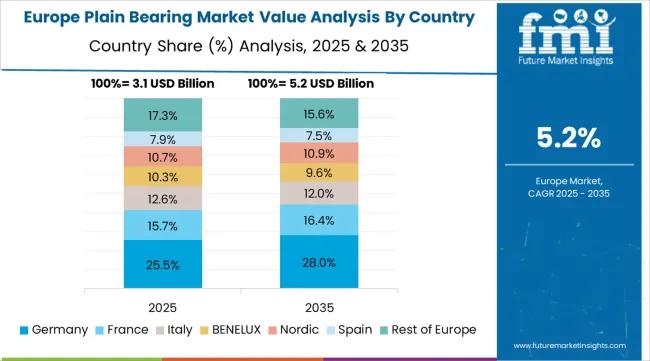
The plain bearing market in Europe is forecast to expand from USD 4.2 billion in 2025 to USD 7.8 billion by 2035, reflecting a steady CAGR of 6.4% over the period, supported by strong automotive and industrial demand. Germany will remain the undisputed leader, with its share rising from 42.5% in 2025 to 43.8% by 2035, fueled by its world-class automotive industry producing over four million vehicles annually, alongside advanced industrial machinery sectors such as machine tools, packaging, and printing equipment.
France follows, growing from 16.8% to 17.2%, supported by automotive output from Stellantis and Renault, aerospace hubs in Toulouse powering Airbus and Safran, and equipment manufacturing spanning agriculture and railways. The United Kingdom, while seeing a modest decline from 13.5% to 12.9%, continues to rely on aerospace strength (Rolls-Royce, BAE Systems), automotive production (Jaguar Land Rover, Nissan), and industrial maintenance markets. Italy grows from 11.2% to 11.6%, underpinned by Ferrari, Maserati, Fiat, and strong exports of industrial machinery and agricultural equipment.
Spain improves from 7.8% to 8.1% with SEAT, Ford, and Renault facilities alongside construction and machinery demand. Sweden, anchored by SKF’s global leadership and Volvo’s commercial vehicles, expands from 5.4% to 5.6%. The Rest of Europe declines from 2.8% to 0.8%, reflecting uneven growth between Eastern Europe’s rising automotive base and mature Benelux markets.
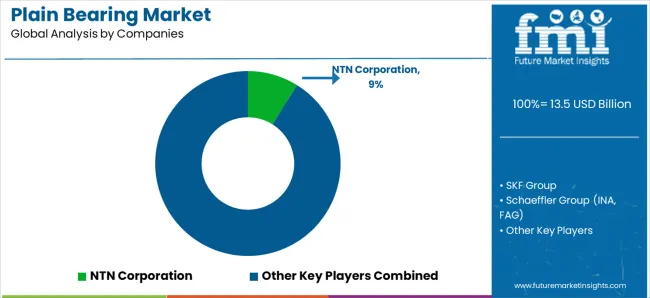
The market operates with moderate concentration, featuring approximately 25-35 meaningful participants globally, where leading companies control roughly 40-50% of the market share through comprehensive product portfolios, global distribution networks, and established relationships with automotive OEMs and industrial equipment manufacturers. Competition prioritizes engineering support, quality consistency, and delivery reliability rather than pure price competition, with premium segments demonstrating strong customer loyalty based on technical performance, application expertise, and supply chain integration capabilities.
Market Leaders encompass NTN Corporation, SKF Group, Schaeffler Group, Timken Company, and THK CO., Ltd., which maintain competitive advantages through extensive bearing engineering expertise, global manufacturing footprint enabling regional customer support, and comprehensive product ranges addressing automotive, industrial machinery, aerospace, and specialized applications. These Tier-1 companies leverage decades of tribology research, advanced material development capabilities, and ongoing innovation investments developing next-generation bearing solutions incorporating self-lubricating materials, embedded sensor technologies, and performance characteristics optimized for emerging applications including electric vehicles and renewable energy equipment.
NTN Corporation demonstrates leadership through comprehensive plain bearing portfolio spanning automotive engine bearings, industrial bushings, and specialized linear motion systems, complementing rolling element bearing leadership and creating full-service capabilities for OEM customers. SKF Group maintains strong position through global distribution network, engineering service capabilities, and material technology expertise including proprietary polymer composites and bronze alloy formulations optimized for demanding applications. Schaeffler Group (INA, FAG brands) leverages automotive industry relationships and precision manufacturing capabilities developing specialized plain bearings for engine, transmission, and chassis applications meeting stringent automotive quality requirements.
Technology Challengers include specialized manufacturers like Oiles Corporation (Japan), GGB Bearing Technology, Saint-Gobain (Glacier bearings), and RBC Bearings focusing on self-lubricating bearing technologies, advanced materials development, and specialized applications including aerospace, defense, and industrial automation. These companies differentiate through material innovation including proprietary polymer composite formulations, metal-polymer hybrid designs, and specialized coatings enhancing bearing performance in extreme environments, dry running applications, and maintenance-critical scenarios where conventional lubricated bearings prove unsuitable.
Regional Specialists feature companies like Waukesha Bearings (US), Federal-Mogul (Tenneco subsidiary), and numerous smaller manufacturers serving specific geographic markets, niche applications, and aftermarket distribution channels. Market dynamics favor participants combining materials engineering expertise with application development capabilities and manufacturing quality ensuring bearing dimensional accuracy, surface finish consistency, and material property uniformity critical for reliable performance across demanding automotive and industrial applications.
| Item | Value |
|---|---|
| Quantitative Units | USD 13.5 billion (2025) |
| Bearing Type | Journal Bearings, Linear Bearings, Thrust Bearings, Spherical Bearings |
| Material Type | Bronze Bearings, Polymer Composite, Steel-Backed, Aluminum Alloy |
| End-Use Industry | Automotive, Construction &Mining Equipment, Industrial Machinery, Aerospace &Defense, Renewable Energy, Marine |
| Lubrication Type | Oil-Lubricated, Grease-Lubricated, Self-Lubricating (Maintenance-Free) |
| Load Direction | Radial Load (Journal), Axial Load (Thrust), Combined Load (Spherical) |
| Regions Covered | North America, Europe, Asia Pacific, Latin America, Middle East &Africa |
| Countries Covered | United States, Germany, China, Japan, United Kingdom, France, South Korea, India, Italy, Spain, Sweden, and 20+ additional countries |
| Key Companies Profiled | NTN Corporation, SKF Group, Schaeffler Group, Timken Company, THK CO., Ltd., Oiles Corporation, GGB Bearing Technology, Saint-Gobain, RBC Bearings, Federal-Mogul, JTEKT, NSK Ltd. |
| Additional Attributes | Dollar sales by bearing type, material composition, end-use industry, and regional markets;adoption trends across automotive, industrial machinery, and specialized applications;competitive landscape with global bearing manufacturers and specialty material suppliers;engineering preferences for self-lubricating designs, maintenance-free operation, and lifecycle cost optimization;integration with predictive maintenance systems and Industry 4.0 platforms;innovations in polymer composites, solid lubricant technologies, and smart bearing systems;development of advanced solutions with enhanced wear resistance, temperature capability, and contamination tolerance |
The global plain bearing market is estimated to be valued at USD 13.5 billion in 2025.
The market size for the plain bearing market is projected to reach USD 23.9 billion by 2035.
The plain bearing market is expected to grow at a 5.9% CAGR between 2025 and 2035.
The key product types in plain bearing market are journal bearings, linear bearings, thrust bearings and spherical bearings.
In terms of end-use, automotive segment to command 30.0% share in the plain bearing market in 2025.


Full Research Suite comprises of:
Market outlook & trends analysis
Interviews & case studies
Strategic recommendations
Vendor profiles & capabilities analysis
5-year forecasts
8 regions and 60+ country-level data splits
Market segment data splits
12 months of continuous data updates
DELIVERED AS:
PDF EXCEL ONLINE
Bearing Installation Tool Kit Market Size and Share Forecast Outlook 2025 to 2035
Bearing Steel Market Size and Share Forecast Outlook 2025 to 2035
Bearing Isolators Market
Motor Bearing Market Size and Share Forecast Outlook 2025 to 2035
Sensor Bearings Market Insights - Growth & Forecast 2025 to 2035
Marine Bearings Market Growth - Trends & Forecast 2025 to 2035
Bridge Bearing Market Growth – Trends & Forecast 2025-2035
Thrust Bearings Market
Linear Bearings Market
Polymer Bearings Market Size and Share Forecast Outlook 2025 to 2035
Between Bearing Pumps Market Analysis - Size, Share, and Forecast Outlook 2025 to 2035
Railway Bearing Market Growth - Trends & Forecast 2025 to 2035
Sliding Bearing Market Growth - Trends & Forecast 2025 to 2035
Camshaft Bearings Market
Magnetic Bearing Market
Precision Bearing Market Size and Share Forecast Outlook 2025 to 2035
Automotive Bearing and Clutch Component Aftermarket Size and Share Forecast Outlook 2025 to 2035
Large Scale Bearing Market Size and Share Forecast Outlook 2025 to 2035
Elastomeric Bearings Market Size and Share Forecast Outlook 2025 to 2035
High Carbon Bearing Steel Market Growth 2025 to 2035

Thank you!
You will receive an email from our Business Development Manager. Please be sure to check your SPAM/JUNK folder too.
Chat With
MaRIA