Between Bearing Pumps Market Size, Share, and Forecast Outlook 2025 to 2035

The between bearing pumps market is forecast to expand from USD 2.2 billion in 2025 to USD 3.1 billion by 2035, registering a CAGR of 3.5% over the forecast period. Demand is being supported by long-term investments in energy, petrochemicals, and water infrastructure projects. These pumps are being favored in high-capacity, continuous-duty applications where reliability and efficiency are critical, particularly in refinery, power generation, and desalination plants.

Quick Stats in Between Bearing Pumps Market

  • Market Value (2025): USD 2.2 billion
  • Forecast Value (2035): USD 3.1 billion
  • Forecast CAGR: 3.5%
  • Top Flow Rate Segment: Medium Flow (39% market share in 2025)
  • Leading End Use Industry: Oil & Gas (32% market share in 2025)
  • Key Growth Country: India (4.2% CAGR)
Metric Value
Market Value (2025) USD 2.2 billion
Market Value (2035) USD 3.1 billion
CAGR (2025 to 2035) 3.5%

As of 2025, the between bearing pumps market accounts for a focused yet vital share across several major industrial equipment markets. Within the global centrifugal pumps market, it holds an estimated 6-8%, as these pumps are commonly used for high-capacity operations in oil, gas, and chemical sectors. In the broader industrial pumps market, the share stands at around 4-5%, due to its specialization in high-flow, high-pressure applications.

Within the oil and gas equipment market, between bearing pumps contribute approximately 3-4%, driven by upstream and midstream fluid transport needs. In the power generation equipment market, its share is about 2-3%, especially in cooling and boiler feed systems. In the water and wastewater treatment equipment market, it accounts for roughly 1-2%, primarily in large-scale municipal and industrial plants.

Manufacturers are integrating diagnostic sensors and predictive maintenance tools into pump assemblies, allowing operators to monitor performance metrics in real time and prevent system failures. Design enhancements such as low NPSH (Net Positive Suction Head) configurations and advanced impeller geometry are helping improve hydraulic performance and energy efficiency.

As legacy infrastructure is replaced and capacity expansions proceed across energy-intensive sectors, between bearing pumps are expected to remain a cornerstone of industrial fluid handling operations.

Analyzing Between Bearing Pumps Market by Top Investment Segments for 2025

The between bearing pumps market is segmented by product type into axially split and radially split pumps, with further divisions into single-stage and multi-stage configurations. By orientation, the market includes horizontal and vertical pumps. By pressure rating, it is segmented into pumps rated up to 25 bar, up to 100 bar, and above 100 bar.

By flow rate, categories include low flow, medium flow, high flow, and ultra-high flow systems. By end use, the market includes oil and gas, power, water and wastewater, mining, marine, and others. Geographically, the market is distributed across North America, Latin America, Eastern Europe, Western Europe, South Asia & Pacific, East Asia, and the Middle East & Africa.

Axially Split, Single‑Stage Pumps to Lead Product Type Segment with 25% Market Share

Axially split, single-stage pumps are expected to dominate the product type segment, accounting for 25% of the global market share by 2025. These pumps are widely recognized for their ease of maintenance and robust design, especially in high-volume fluid handling environments.

  • Installations in industrial and utility-scale operations have been driven by the demand for reliable, continuous-duty pumping systems with minimal downtime.
  • Preference for axially split casing stems from their ability to facilitate easier inspection and servicing. As operational efficiency becomes a major performance criterion in chemical and water treatment sectors, these pumps have been increasingly favored for their durability and simplified maintenance.

Horizontal Pumps to Dominate Orientation Segment with 80% Market Share

Horizontal between bearing pumps are projected to dominate the orientation segment, holding 80% of the global market share by 2025. Their alignment supports easier installation and space optimization in plant-level setups.

  • Adoption in large-scale processing and pipeline applications has been rising due to their balance, stability, and ability to handle large flow volumes.
  • Horizontal configurations have been selected for their improved axial thrust balance and ease of coupling with motors. As global energy and infrastructure investments expand, these pumps have remained a preferred choice across oil refineries, chemical plants, and municipal water systems.

Pumps Rated Up to 25 Bar to Lead Pressure Segment with 40% Market Share

Between bearing pumps rated up to 25 bar are expected to lead the pressure segment, securing 40% of the global market share by 2025. These models offer optimal pressure control for medium-duty industrial operations.

  • Demand for moderate-pressure applications has supported the growth of these pumps in water circulation, power generation, and HVAC systems.
  • Units in this category have been preferred for their efficiency and cost-effectiveness, especially where high-pressure capability is not essential. As mid-range processing industries look to balance performance with affordability, these pressure-rated pumps have seen broader adoption.

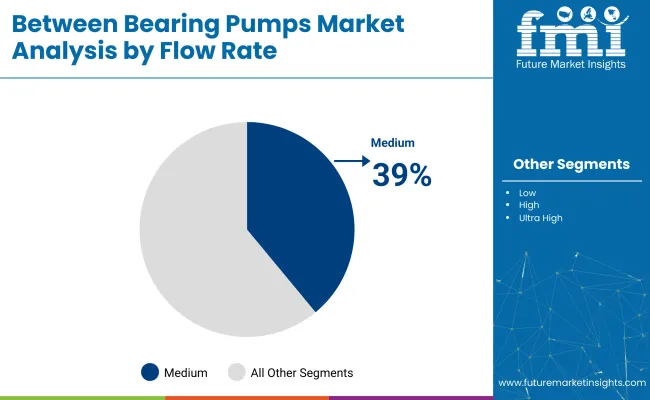
Medium Flow Pumps to Lead Flow Rate Segment with 39% Market Share

Medium flow between bearing pumps are projected to dominate the flow rate segment, accounting for 39% of the market share by 2025. These pumps offer the ideal balance between volume handling and energy efficiency in various operational setups.
  • Medium Flow Pumps have been widely used in applications like petrochemical transfers, cooling systems, and pulp processing, where consistent medium flow is essential.
  • Medium capacity pumps have gained favor for their reliability and moderate capital expenditure. Manufacturers have responded to this demand by optimizing designs for durability, improved hydraulic performance, and compatibility with various process fluids.

Between Bearing Pumps Market Analysis By Flow Rate

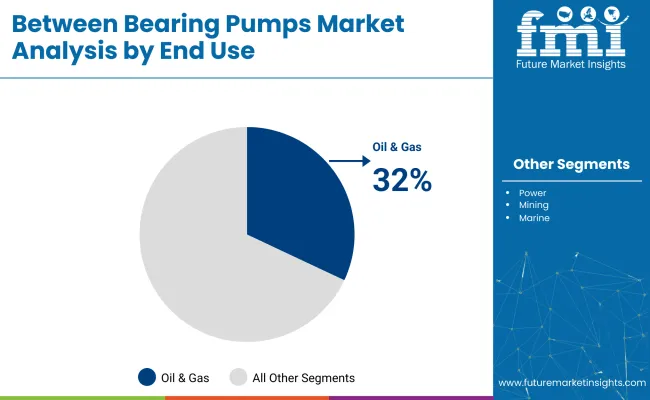
Oil & Gas to Lead End-Use Segment with 32% Market Share

The oil & gas industry is expected to dominate the end-use segment, capturing 32% of the global market share by 2025. Demand from upstream, midstream, and downstream operations has driven the adoption.
  • Pumps in this category have been relied upon for their ability to handle aggressive fluids, operate under harsh conditions, and maintain high reliability.
  • Expanding refinery operations, LNG terminals, and pipeline projects have contributed to increased installations. Between bearing pumps have continued to play a vital role in supporting high-volume fluid transfer and pressure regulation in critical energy supply chains.

Between Bearing Pumps Market Analysis By End Use

Top Between Bearing Pumps Market Dynamics

The market is expanding steadily due to rising demand from industries requiring high-capacity, high-pressure fluid handling. Key sectors such as oil & gas, power generation, water treatment, and chemical processing rely on these pumps for their reliability, stability, and ease of maintenance in continuous operations.

Robust Demand from Oil & Gas and Petrochemical Industries

Between bearing pumps are widely used in upstream and downstream oil & gas applications due to their ability to handle high-flow volumes and aggressive fluids. They are deployed in crude oil transport, refinery circulation, and offshore platforms where reliability and minimal vibration are essential. API 610 compliance is a standard requirement, particularly in petrochemical environments where operational safety is critical.

  • Used in crude transport, refining, and offshore oil production systems.
  • Valued for high-pressure, stable operation in harsh and continuous service.
  • API 610-compliant models are preferred for petrochemical and refinery use.

Increased Use in Power Plants and Industrial Water Handling

Between bearing pumps are extensively used in thermal and nuclear power plants for boiler feed, condensate extraction, and cooling water circulation. Their horizontal split-case design allows for easy maintenance and long service intervals, making them suitable for 24/7 operations. Water treatment facilities also rely on between bearing pumps for large-scale intake and discharge systems, where reliability and energy efficiency are essential.
  • Used in boiler feed and cooling systems in thermal and nuclear plants.
  • Horizontal split-case design allows easier inspection and maintenance.
  • Adopted in water infrastructure for large-volume intake and discharge.

Analysis of Top Countries Manufacturing, Deploying, and Maintaining Between Bearing Pumps Globally

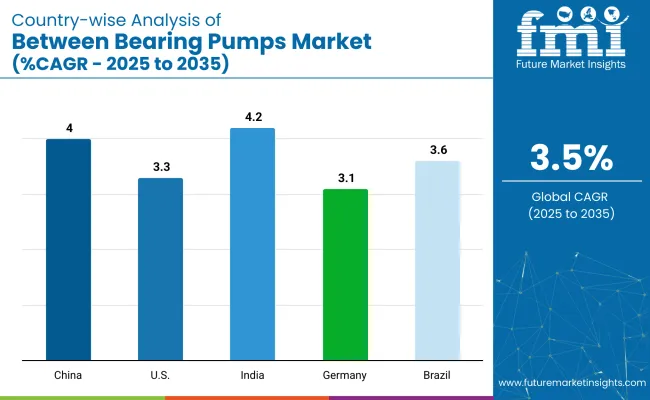
Country Wise Analysis Of Between Bearing Pumps Market Cagr 2025 To 2035

Countries CAGR (2025 to 2035)
India 4.2%
China 4.0%
Brazil 3.6%
United States 3.3%
Germany 3.1%

The global market is expected to grow at a moderate pace between 2025 and 2035, driven by the expansion of petrochemical plants, thermal power stations, and industrial fluid transfer systems. These pumps are favored for their robust construction, high flow capacities, and suitability for heavy-duty applications in refineries and energy facilities.

Among top-performing countries, India leads with a CAGR of 4.2%, followed closely by China at 4.0%. Brazil is growing at 3.6%, supported by downstream investments. Mature industrial economies such as the United States (3.3%) and Germany (3.1%) are witnessing demand from retrofit and energy modernization projects.

BRICS countries like China, India, and Brazil are scaling their process industries and investing in new installations. OECD nations such as the USA and Germany are modernizing legacy systems with more efficient, low-maintenance pump solutions. The report includes data from over 40 countries. The five below are profiled for their strategic impact and market development.

Growth Outlook for Between Bearing Pumps Market in India

Indian market is forecast to grow at a CAGR of 4.2%, driven by expanding oil refining capacity, fertilizer production, and thermal power development. Public and private investments in process industries are boosting demand for pumps that can handle high flow rates and aggressive fluids.

India is also emphasizing indigenization of rotating equipment for critical industries, which is encouraging domestic manufacturing of large multistage pump assemblies. Regional EPC contractors are increasingly sourcing API 610-compliant pumps from local suppliers for infrastructure and energy projects.

  • Refineries and fertilizer plants are key demand centers for horizontal split pumps.
  • Local manufacturers expanding capabilities for API 610-compliant systems.
  • Government projects are supporting domestic pump procurement targets.

Demand Forecast for Between Bearing Pumps Market in China

China’s market is expected to expand at a CAGR of 4.0%, supported by continued growth in petrochemical infrastructure, wastewater treatment, and thermal energy facilities. Large state-owned companies are driving procurement of heavy-duty multistage pumps for applications requiring high reliability and low downtime.

China's push to modernize energy efficiency in existing plants is also fueling replacement demand. Domestic pump producers are investing in CNC-based fabrication and testing capabilities to meet tighter performance standards.

  • Heavy-duty pump use rising in chemical and energy processing sectors.
  • Retrofit programs driving replacement of outdated pumping units.
  • Local firms improving machining and testing for higher efficiency output.

Premium Outlook for Between Bearing Pumps Market in Brazil

Brazil’s market is growing at a CAGR of 3.6%, supported by downstream oil and gas investments and infrastructure upgrades in the energy and water sectors. The country is prioritizing the expansion of pipeline networks and refinery upgrades, where between bearing pumps are favored for their ability to handle high flow rates over long distances.

Domestic energy companies are sourcing pumps designed for tropical operating conditions, with emphasis on corrosion-resistant materials and simplified maintenance protocols.

  • Oil pipeline projects and refinery expansions are driving pump demand.
  • Pumps built for tropical, high-humidity operating environments.
  • Focus on stainless steel and duplex materials for fluid compatibility.

Future Trends in Between Bearing Pumps Market in the United States

The USA between market is projected to grow at a CAGR of 3.3%, driven by maintenance upgrades in mature industrial plants and refinery modernization efforts. Aging infrastructure in the chemical and energy sectors is creating demand for more energy-efficient multistage pump systems.

USA manufacturers are leading in API-compliant pump designs that prioritize low-vibration operation and modularity. The aftermarket service segment is also expanding, with a focus on predictive maintenance technologies and OEM-certified refurbishments.

  • Aging plant infrastructure is driving replacement of legacy pumps.
  • Manufacturers focusing on modular, vibration-minimized pump designs.
  • Aftermarket support expanding with diagnostics and service agreements.

Analysis of Between Bearing Pumps Market in Germany

Germany’s market is forecast to grow at a CAGR of 3.1%, supported by process industry automation and high environmental compliance standards. German industries, especially in chemicals and food processing, require precision-engineered pumps that offer long lifecycle performance and energy savings.

Local pump producers are focusing on magnetic coupling and low-pulsation technologies to align with national efficiency regulations. The country’s energy transition initiatives are also prompting upgrades in district heating and biomass power plants, contributing to moderate but consistent pump demand.

  • Chemical and food sectors require hygienic, precision-engineered pump systems.
  • Pump makers developing energy-saving designs with minimal maintenance.
  • Demand supported by modernization of heating and process utilities.

Leading Between Bearing Pumps Manufacturers

The industry is moderately consolidated, with major players such as Sulzer, Flowserve, KSB, and Ebara dominating through strong global distribution networks and diversified pump technologies. Sulzer stands out for its high-efficiency centrifugal pumps designed for the oil & gas, chemical, and power sectors.

Flowserve provides a broad range of API-compliant between bearing pumps tailored for high-pressure and high-temperature applications. KSB is known for its robust BB1 and BB2 series pumps that deliver reliability in water and industrial processing plants, while Ebara offers precision-engineered models suited for both clean water and aggressive fluids.

Report Coverage and Scope Summary

Report Attributes Details
Market Size (2025) USD 2.2 billion
Projected Market Size (2035) USD 3.1 billion
CAGR (2025 to 2035) 3.5%
Base Year for Estimation 2024
Historical Period 2020 to 2024
Projections Period 2025 to 2035
Quantitative Units USD billion for market value
Product Types Analyzed (Segment 1) Axially Split (Single-Stage, Multi-Stage), Radially Split (Single-Stage, Multi-Stage)
Orientations Analyzed (Segment 2) Horizontal, Vertical
Pressure Ratings Analyzed (Segment 3) Up to 25 Bar, Up to 100 Bar, Above 100 Bar
Flow Rates Analyzed (Segment 4) Low Flow, Medium Flow, High Flow, Ultra High Flow
End Uses Analyzed (Segment 5) Oil & Gas, Power, Water & Wastewater, Mining, Marine, Others
Regions Covered North America, Latin America, Western Europe, Eastern Europe, South Asia & Pacific, East Asia, Central Asia, Russia & Belarus, Balkan & Baltic Countries, Middle East & Africa
Countries Covered United States, Canada, Germany, United Kingdom, France, Japan, China, India, South Korea, Brazil
Key Players Ruhrpumpen, Sulzer, KSB, Ebara, Flowserve, Trillium Flow Technologies, Wilo
Additional Attributes Dollar sales by configuration and end use, stable demand from energy and water infrastructure, increasing upgrades in industrial pumping systems, and regional investments in high-pressure operations.

Leading Players in Between Bearing Pumps Market

  • Ruhrpumpen
  • Sulzer
  • KSB
  • Ebara
  • Flowserve
  • Trillium Flow Technologies
  • Wilo

Between Bearing Pumps Market Analyzed by Key Investment Segments

By Product Type:

The market is segmented by product type into axially split and radially split pumps. Each of these categories is further divided into single-stage and multi-stage configurations.

By Orientation:

Based on orientation, the market includes horizontal and vertical pumps.

By Pressure Rating:

In terms of pressure handling, the market is categorized into pumps rated up to 25 bar, up to 100 bar, and above 100 bar.

By Flow Rate:

The market is segmented by flow rate into low flow, medium flow, high flow, and ultra high flow systems.

By End Use:

Key end-use industries include oil and gas, power, water and wastewater, mining, marine, and others.

By Region:

Geographically, the market is distributed across North America, Latin America, Eastern Europe, Western Europe, South Asia & Pacific, East Asia, and the Middle East & Africa.

Table of Content

  1. Executive Summary
    • Global Market Outlook
    • Demand-side Trends
    • Supply-side Trends
    • Technology Roadmap Analysis
    • Analysis and Recommendations
  2. Market Overview
    • Market Coverage / Taxonomy
    • Market Definition / Scope / Limitations
  3. Market Background
    • Market Dynamics
      • Drivers
      • Restraints
      • Opportunity
      • Trends
    • Scenario Forecast
      • Demand in Optimistic Scenario
      • Demand in Likely Scenario
      • Demand in Conservative Scenario
    • Opportunity Map Analysis
    • Product Life Cycle Analysis
    • Supply Chain Analysis
      • Supply Side Participants and their Roles
        • Producers
        • Mid-Level Participants (Traders/ Agents/ Brokers)
        • Wholesalers and Distributors
      • Value Added and Value Created at Node in the Supply Chain
      • List of Raw Material Suppliers
      • List of Existing and Potential Buyer’s
    • Investment Feasibility Matrix
    • Value Chain Analysis
      • Profit Margin Analysis
      • Wholesalers and Distributors
      • Retailers
    • PESTLE and Porter’s Analysis
    • Regulatory Landscape
      • By Key Regions
      • By Key Countries
    • Regional Parent Market Outlook
    • Production and Consumption Statistics
    • Import and Export Statistics
  4. Global Market Analysis 2020 to 2024 and Forecast, 2025 to 2035
    • Historical Market Size Value (USD Billion) & Volume (Units) Analysis, 2020 to 2024
    • Current and Future Market Size Value (USD Billion) & Volume (Units) Projections, 2025 to 2035
      • Y-o-Y Growth Trend Analysis
      • Absolute $ Opportunity Analysis
  5. Global Market Pricing Analysis 2020 to 2024 and Forecast 2025 to 2035
  6. Global Market Analysis 2020 to 2024 and Forecast 2025 to 2035, By Product Type
    • Introduction / Key Findings
    • Historical Market Size Value (USD Billion) & Volume (Units) Analysis By Product Type, 2020 to 2024
    • Current and Future Market Size Value (USD Billion) & Volume (Units) Analysis and Forecast By Product Type, 2025 to 2035
      • Axially Split
        • Single Stage
        • Multi-stage
      • Radially Split
        • Single Stage
        • Multi-stage
    • Y-o-Y Growth Trend Analysis By Product Type, 2020 to 2024
    • Absolute $ Opportunity Analysis By Product Type, 2025 to 2035
  7. Global Market Analysis 2020 to 2024 and Forecast 2025 to 2035, By Orientation
    • Introduction / Key Findings
    • Historical Market Size Value (USD Billion) & Volume (Units) Analysis By Orientation, 2020 to 2024
    • Current and Future Market Size Value (USD Billion) & Volume (Units) Analysis and Forecast By Orientation, 2025 to 2035
      • Horizontal
      • Vertical
    • Y-o-Y Growth Trend Analysis By Orientation, 2020 to 2024
    • Absolute $ Opportunity Analysis By Orientation, 2025 to 2035
  8. Global Market Analysis 2020 to 2024 and Forecast 2025 to 2035, By Pressure Rating
    • Introduction / Key Findings
    • Historical Market Size Value (USD Billion) & Volume (Units) Analysis By Pressure Rating, 2020 to 2024
    • Current and Future Market Size Value (USD Billion) & Volume (Units) Analysis and Forecast By Pressure Rating, 2025 to 2035
      • Upto 25 bar
      • Upto 100 bar
      • Above 100 bar
    • Y-o-Y Growth Trend Analysis By Pressure Rating, 2020 to 2024
    • Absolute $ Opportunity Analysis By Pressure Rating, 2025 to 2035
  9. Global Market Analysis 2020 to 2024 and Forecast 2025 to 2035, By Flow Rate
    • Introduction / Key Findings
    • Historical Market Size Value (USD Billion) & Volume (Units) Analysis By Flow Rate, 2020 to 2024
    • Current and Future Market Size Value (USD Billion) & Volume (Units) Analysis and Forecast By Flow Rate, 2025 to 2035
      • Low Flow
      • Medium Flow
      • High Flow
      • Ultra High Flow
    • Y-o-Y Growth Trend Analysis By Flow Rate, 2020 to 2024
    • Absolute $ Opportunity Analysis By Flow Rate, 2025 to 2035
  10. Global Market Analysis 2020 to 2024 and Forecast 2025 to 2035, By End Use
    • Introduction / Key Findings
    • Historical Market Size Value (USD Billion) & Volume (Units) Analysis By End Use, 2020 to 2024
    • Current and Future Market Size Value (USD Billion) & Volume (Units) Analysis and Forecast By End Use, 2025 to 2035
      • Oil & Gas
      • Power
      • Water & Wastewater
      • Mining
      • Marine
      • Others
    • Y-o-Y Growth Trend Analysis By End Use, 2020 to 2024
    • Absolute $ Opportunity Analysis By End Use, 2025 to 2035
  11. Global Market Analysis 2020 to 2024 and Forecast 2025 to 2035, By Region
    • Introduction
    • Historical Market Size Value (USD Billion) & Volume (Units) Analysis By Region, 2020 to 2024
    • Current Market Size Value (USD Billion) & Volume (Units) Analysis and Forecast By Region, 2025 to 2035
      • North America
      • Latin America
      • Western Europe
      • Eastern Europe
      • East Asia
      • South Asia & Pacific
      • Middle East and Africa
    • Market Attractiveness Analysis By Region
  12. North America Market Analysis 2020 to 2024 and Forecast 2025 to 2035, By Country
    • Historical Market Size Value (USD Billion) & Volume (Units) Trend Analysis By Market Taxonomy, 2020 to 2024
    • Market Size Value (USD Billion) & Volume (Units) Forecast By Market Taxonomy, 2025 to 2035
      • By Country
        • USA
        • Canada
        • Mexico
      • By Product Type
      • By Orientation
      • By Pressure Rating
      • By Flow Rate
      • By End Use
    • Market Attractiveness Analysis
      • By Country
      • By Product Type
      • By Orientation
      • By Pressure Rating
      • By Flow Rate
      • By End Use
    • Key Takeaways
  13. Latin America Market Analysis 2020 to 2024 and Forecast 2025 to 2035, By Country
    • Historical Market Size Value (USD Billion) & Volume (Units) Trend Analysis By Market Taxonomy, 2020 to 2024
    • Market Size Value (USD Billion) & Volume (Units) Forecast By Market Taxonomy, 2025 to 2035
      • By Country
        • Brazil
        • Argentina
        • Rest of LATAM
      • By Product Type
      • By Orientation
      • By Pressure Rating
      • By Flow Rate
      • By End Use
    • Market Attractiveness Analysis
      • By Country
      • By Product Type
      • By Orientation
      • By Pressure Rating
      • By Flow Rate
      • By End Use
    • Key Takeaways
  14. Western Europe Market Analysis 2020 to 2024 and Forecast 2025 to 2035, By Country
    • Historical Market Size Value (USD Billion) & Volume (Units) Trend Analysis By Market Taxonomy, 2020 to 2024
    • Market Size Value (USD Billion) & Volume (Units) Forecast By Market Taxonomy, 2025 to 2035
      • By Country
        • Germany
        • Italy
        • France
        • UK
        • Spain
        • BENELUX
        • Nordic
        • Rest of W.Europe
      • By Product Type
      • By Orientation
      • By Pressure Rating
      • By Flow Rate
      • By End Use
    • Market Attractiveness Analysis
      • By Country
      • By Product Type
      • By Orientation
      • By Pressure Rating
      • By Flow Rate
      • By End Use
    • Key Takeaways
  15. Eastern Europe Market Analysis 2020 to 2024 and Forecast 2025 to 2035, By Country
    • Historical Market Size Value (USD Billion) & Volume (Units) Trend Analysis By Market Taxonomy, 2020 to 2024
    • Market Size Value (USD Billion) & Volume (Units) Forecast By Market Taxonomy, 2025 to 2035
      • By Country
        • Russia
        • Hungary
        • Poland
        • Balkan & Baltics
        • Rest of E. Europe
      • By Product Type
      • By Orientation
      • By Pressure Rating
      • By Flow Rate
      • By End Use
    • Market Attractiveness Analysis
      • By Country
      • By Product Type
      • By Orientation
      • By Pressure Rating
      • By Flow Rate
      • By End Use
    • Key Takeaways
  16. East Asia Market Analysis 2020 to 2024 and Forecast 2025 to 2035, By Country
    • Historical Market Size Value (USD Billion) & Volume (Units) Trend Analysis By Market Taxonomy, 2020 to 2024
    • Market Size Value (USD Billion) & Volume (Units) Forecast By Market Taxonomy, 2025 to 2035
      • By Country
        • China
        • Japan
        • South Korea
      • By Product Type
      • By Orientation
      • By Pressure Rating
      • By Flow Rate
      • By End Use
    • Market Attractiveness Analysis
      • By Country
      • By Product Type
      • By Orientation
      • By Pressure Rating
      • By Flow Rate
      • By End Use
    • Key Takeaways
  17. South Asia & Pacific Market Analysis 2020 to 2024 and Forecast 2025 to 2035, By Country
    • Historical Market Size Value (USD Billion) & Volume (Units) Trend Analysis By Market Taxonomy, 2020 to 2024
    • Market Size Value (USD Billion) & Volume (Units) Forecast By Market Taxonomy, 2025 to 2035
      • By Country
        • India
        • Australia & New Zealand
        • ASEAN
        • Rest of SAP
      • By Product Type
      • By Orientation
      • By Pressure Rating
      • By Flow Rate
      • By End Use
    • Market Attractiveness Analysis
      • By Country
      • By Product Type
      • By Orientation
      • By Pressure Rating
      • By Flow Rate
      • By End Use
    • Key Takeaways
  18. Middle East and Africa Market Analysis 2020 to 2024 and Forecast 2025 to 2035, By Country
    • Historical Market Size Value (USD Billion) & Volume (Units) Trend Analysis By Market Taxonomy, 2020 to 2024
    • Market Size Value (USD Billion) & Volume (Units) Forecast By Market Taxonomy, 2025 to 2035
      • By Country
        • GCC Countries
        • Northern Africa
        • South Africa
        • Turkiye
        • Rest of MEA
      • By Product Type
      • By Orientation
      • By Pressure Rating
      • By Flow Rate
      • By End Use
    • Market Attractiveness Analysis
      • By Country
      • By Product Type
      • By Orientation
      • By Pressure Rating
      • By Flow Rate
      • By End Use
    • Key Takeaways
  19. Key Countries Market Analysis
    • USA
      • Pricing Analysis
      • Market Share Analysis, 2024
        • By Product Type
        • By Orientation
        • By Pressure Rating
        • By Flow Rate
        • By End Use
    • Canada
      • Pricing Analysis
      • Market Share Analysis, 2024
        • By Product Type
        • By Orientation
        • By Pressure Rating
        • By Flow Rate
        • By End Use
    • Brazil
      • Pricing Analysis
      • Market Share Analysis, 2024
        • By Product Type
        • By Orientation
        • By Pressure Rating
        • By Flow Rate
        • By End Use
    • Mexico
      • Pricing Analysis
      • Market Share Analysis, 2024
        • By Product Type
        • By Orientation
        • By Pressure Rating
        • By Flow Rate
        • By End Use
    • Argentina
      • Pricing Analysis
      • Market Share Analysis, 2024
        • By Product Type
        • By Orientation
        • By Pressure Rating
        • By Flow Rate
        • By End Use
  20. Market Structure Analysis
    • Competition Dashboard
    • Competition Benchmarking
    • Market Share Analysis of Top Players
      • By Regional
      • By Product Type
      • By Orientation
      • By Pressure Rating
      • By Flow Rate
      • By End Use
  21. Competition Analysis
    • Competition Deep Dive
      • Ruhrpumpen
        • Overview
        • Product Portfolio
        • Profitability by Market Segments (Product/Age /Sales Channel/Region)
        • Sales Footprint
        • Strategy Overview
          • Marketing Strategy
          • Product Strategy
          • Channel Strategy
      • Sulzer
        • Overview
        • Product Portfolio
        • Profitability by Market Segments (Product/Age /Sales Channel/Region)
        • Sales Footprint
        • Strategy Overview
          • Marketing Strategy
          • Product Strategy
          • Channel Strategy
      • KSB
        • Overview
        • Product Portfolio
        • Profitability by Market Segments (Product/Age /Sales Channel/Region)
        • Sales Footprint
        • Strategy Overview
          • Marketing Strategy
          • Product Strategy
          • Channel Strategy
      • Ebara
        • Overview
        • Product Portfolio
        • Profitability by Market Segments (Product/Age /Sales Channel/Region)
        • Sales Footprint
        • Strategy Overview
          • Marketing Strategy
          • Product Strategy
          • Channel Strategy
      • Flowserve
        • Overview
        • Product Portfolio
        • Profitability by Market Segments (Product/Age /Sales Channel/Region)
        • Sales Footprint
        • Strategy Overview
          • Marketing Strategy
          • Product Strategy
          • Channel Strategy
      • Trillium Flow Technologies
        • Overview
        • Product Portfolio
        • Profitability by Market Segments (Product/Age /Sales Channel/Region)
        • Sales Footprint
        • Strategy Overview
          • Marketing Strategy
          • Product Strategy
          • Channel Strategy
      • Wilo
        • Overview
        • Product Portfolio
        • Profitability by Market Segments (Product/Age /Sales Channel/Region)
        • Sales Footprint
        • Strategy Overview
          • Marketing Strategy
          • Product Strategy
          • Channel Strategy
  22. Assumptions & Acronyms Used
  23. Research Methodology

List of Tables

  • Table 1: Global Market Value (USD Billion) Forecast by Region, 2020 to 2035
  • Table 2: Global Market Volume (Units) Forecast by Region, 2020 to 2035
  • Table 3: Global Market Value (USD Billion) Forecast by Product Type, 2020 to 2035
  • Table 4: Global Market Volume (Units) Forecast by Product Type, 2020 to 2035
  • Table 5: Global Market Value (USD Billion) Forecast by Orientation, 2020 to 2035
  • Table 6: Global Market Volume (Units) Forecast by Orientation, 2020 to 2035
  • Table 7: Global Market Value (USD Billion) Forecast by Pressure Rating, 2020 to 2035
  • Table 8: Global Market Volume (Units) Forecast by Pressure Rating, 2020 to 2035
  • Table 9: Global Market Value (USD Billion) Forecast by Flow Rate, 2020 to 2035
  • Table 10: Global Market Volume (Units) Forecast by Flow Rate, 2020 to 2035
  • Table 11: Global Market Value (USD Billion) Forecast by End Use, 2020 to 2035
  • Table 12: Global Market Volume (Units) Forecast by End Use, 2020 to 2035
  • Table 13: North America Market Value (USD Billion) Forecast by Country, 2020 to 2035
  • Table 14: North America Market Volume (Units) Forecast by Country, 2020 to 2035
  • Table 15: North America Market Value (USD Billion) Forecast by Product Type, 2020 to 2035
  • Table 16: North America Market Volume (Units) Forecast by Product Type, 2020 to 2035
  • Table 17: North America Market Value (USD Billion) Forecast by Orientation, 2020 to 2035
  • Table 18: North America Market Volume (Units) Forecast by Orientation, 2020 to 2035
  • Table 19: North America Market Value (USD Billion) Forecast by Pressure Rating, 2020 to 2035
  • Table 20: North America Market Volume (Units) Forecast by Pressure Rating, 2020 to 2035
  • Table 21: North America Market Value (USD Billion) Forecast by Flow Rate, 2020 to 2035
  • Table 22: North America Market Volume (Units) Forecast by Flow Rate, 2020 to 2035
  • Table 23: North America Market Value (USD Billion) Forecast by End Use, 2020 to 2035
  • Table 24: North America Market Volume (Units) Forecast by End Use, 2020 to 2035
  • Table 25: Latin America Market Value (USD Billion) Forecast by Country, 2020 to 2035
  • Table 26: Latin America Market Volume (Units) Forecast by Country, 2020 to 2035
  • Table 27: Latin America Market Value (USD Billion) Forecast by Product Type, 2020 to 2035
  • Table 28: Latin America Market Volume (Units) Forecast by Product Type, 2020 to 2035
  • Table 29: Latin America Market Value (USD Billion) Forecast by Orientation, 2020 to 2035
  • Table 30: Latin America Market Volume (Units) Forecast by Orientation, 2020 to 2035
  • Table 31: Latin America Market Value (USD Billion) Forecast by Pressure Rating, 2020 to 2035
  • Table 32: Latin America Market Volume (Units) Forecast by Pressure Rating, 2020 to 2035
  • Table 33: Latin America Market Value (USD Billion) Forecast by Flow Rate, 2020 to 2035
  • Table 34: Latin America Market Volume (Units) Forecast by Flow Rate, 2020 to 2035
  • Table 35: Latin America Market Value (USD Billion) Forecast by End Use, 2020 to 2035
  • Table 36: Latin America Market Volume (Units) Forecast by End Use, 2020 to 2035
  • Table 37: Western Europe Market Value (USD Billion) Forecast by Country, 2020 to 2035
  • Table 38: Western Europe Market Volume (Units) Forecast by Country, 2020 to 2035
  • Table 39: Western Europe Market Value (USD Billion) Forecast by Product Type, 2020 to 2035
  • Table 40: Western Europe Market Volume (Units) Forecast by Product Type, 2020 to 2035
  • Table 41: Western Europe Market Value (USD Billion) Forecast by Orientation, 2020 to 2035
  • Table 42: Western Europe Market Volume (Units) Forecast by Orientation, 2020 to 2035
  • Table 43: Western Europe Market Value (USD Billion) Forecast by Pressure Rating, 2020 to 2035
  • Table 44: Western Europe Market Volume (Units) Forecast by Pressure Rating, 2020 to 2035
  • Table 45: Western Europe Market Value (USD Billion) Forecast by Flow Rate, 2020 to 2035
  • Table 46: Western Europe Market Volume (Units) Forecast by Flow Rate, 2020 to 2035
  • Table 47: Western Europe Market Value (USD Billion) Forecast by End Use, 2020 to 2035
  • Table 48: Western Europe Market Volume (Units) Forecast by End Use, 2020 to 2035
  • Table 49: Eastern Europe Market Value (USD Billion) Forecast by Country, 2020 to 2035
  • Table 50: Eastern Europe Market Volume (Units) Forecast by Country, 2020 to 2035
  • Table 51: Eastern Europe Market Value (USD Billion) Forecast by Product Type, 2020 to 2035
  • Table 52: Eastern Europe Market Volume (Units) Forecast by Product Type, 2020 to 2035
  • Table 53: Eastern Europe Market Value (USD Billion) Forecast by Orientation, 2020 to 2035
  • Table 54: Eastern Europe Market Volume (Units) Forecast by Orientation, 2020 to 2035
  • Table 55: Eastern Europe Market Value (USD Billion) Forecast by Pressure Rating, 2020 to 2035
  • Table 56: Eastern Europe Market Volume (Units) Forecast by Pressure Rating, 2020 to 2035
  • Table 57: Eastern Europe Market Value (USD Billion) Forecast by Flow Rate, 2020 to 2035
  • Table 58: Eastern Europe Market Volume (Units) Forecast by Flow Rate, 2020 to 2035
  • Table 59: Eastern Europe Market Value (USD Billion) Forecast by End Use, 2020 to 2035
  • Table 60: Eastern Europe Market Volume (Units) Forecast by End Use, 2020 to 2035
  • Table 61: East Asia Market Value (USD Billion) Forecast by Country, 2020 to 2035
  • Table 62: East Asia Market Volume (Units) Forecast by Country, 2020 to 2035
  • Table 63: East Asia Market Value (USD Billion) Forecast by Product Type, 2020 to 2035
  • Table 64: East Asia Market Volume (Units) Forecast by Product Type, 2020 to 2035
  • Table 65: East Asia Market Value (USD Billion) Forecast by Orientation, 2020 to 2035
  • Table 66: East Asia Market Volume (Units) Forecast by Orientation, 2020 to 2035
  • Table 67: East Asia Market Value (USD Billion) Forecast by Pressure Rating, 2020 to 2035
  • Table 68: East Asia Market Volume (Units) Forecast by Pressure Rating, 2020 to 2035
  • Table 69: East Asia Market Value (USD Billion) Forecast by Flow Rate, 2020 to 2035
  • Table 70: East Asia Market Volume (Units) Forecast by Flow Rate, 2020 to 2035
  • Table 71: East Asia Market Value (USD Billion) Forecast by End Use, 2020 to 2035
  • Table 72: East Asia Market Volume (Units) Forecast by End Use, 2020 to 2035
  • Table 73: South Asia & Pacific Market Value (USD Billion) Forecast by Country, 2020 to 2035
  • Table 74: South Asia & Pacific Market Volume (Units) Forecast by Country, 2020 to 2035
  • Table 75: South Asia & Pacific Market Value (USD Billion) Forecast by Product Type, 2020 to 2035
  • Table 76: South Asia & Pacific Market Volume (Units) Forecast by Product Type, 2020 to 2035
  • Table 77: South Asia & Pacific Market Value (USD Billion) Forecast by Orientation, 2020 to 2035
  • Table 78: South Asia & Pacific Market Volume (Units) Forecast by Orientation, 2020 to 2035
  • Table 79: South Asia & Pacific Market Value (USD Billion) Forecast by Pressure Rating, 2020 to 2035
  • Table 80: South Asia & Pacific Market Volume (Units) Forecast by Pressure Rating, 2020 to 2035
  • Table 81: South Asia & Pacific Market Value (USD Billion) Forecast by Flow Rate, 2020 to 2035
  • Table 82: South Asia & Pacific Market Volume (Units) Forecast by Flow Rate, 2020 to 2035
  • Table 83: South Asia & Pacific Market Value (USD Billion) Forecast by End Use, 2020 to 2035
  • Table 84: South Asia & Pacific Market Volume (Units) Forecast by End Use, 2020 to 2035
  • Table 85: Middle East and Africa Market Value (USD Billion) Forecast by Country, 2020 to 2035
  • Table 86: Middle East and Africa Market Volume (Units) Forecast by Country, 2020 to 2035
  • Table 87: Middle East and Africa Market Value (USD Billion) Forecast by Product Type, 2020 to 2035
  • Table 88: Middle East and Africa Market Volume (Units) Forecast by Product Type, 2020 to 2035
  • Table 89: Middle East and Africa Market Value (USD Billion) Forecast by Orientation, 2020 to 2035
  • Table 90: Middle East and Africa Market Volume (Units) Forecast by Orientation, 2020 to 2035
  • Table 91: Middle East and Africa Market Value (USD Billion) Forecast by Pressure Rating, 2020 to 2035
  • Table 92: Middle East and Africa Market Volume (Units) Forecast by Pressure Rating, 2020 to 2035
  • Table 93: Middle East and Africa Market Value (USD Billion) Forecast by Flow Rate, 2020 to 2035
  • Table 94: Middle East and Africa Market Volume (Units) Forecast by Flow Rate, 2020 to 2035
  • Table 95: Middle East and Africa Market Value (USD Billion) Forecast by End Use, 2020 to 2035
  • Table 96: Middle East and Africa Market Volume (Units) Forecast by End Use, 2020 to 2035

List of Figures

  • Figure 1: Global Market Volume (Units) Forecast 2020 to 2035
  • Figure 2: Global Market Pricing Analysis
  • Figure 3: Global Market Value (USD Billion) Forecast 2020 to 2035
  • Figure 4: Global Market Value Share and BPS Analysis by Product Type, 2025 and 2035
  • Figure 5: Global Market Y-o-Y Growth Comparison by Product Type, 2025 to 2035
  • Figure 6: Global Market Attractiveness Analysis by Product Type
  • Figure 7: Global Market Value Share and BPS Analysis by Orientation, 2025 and 2035
  • Figure 8: Global Market Y-o-Y Growth Comparison by Orientation, 2025 to 2035
  • Figure 9: Global Market Attractiveness Analysis by Orientation
  • Figure 10: Global Market Value Share and BPS Analysis by Pressure Rating, 2025 and 2035
  • Figure 11: Global Market Y-o-Y Growth Comparison by Pressure Rating, 2025 to 2035
  • Figure 12: Global Market Attractiveness Analysis by Pressure Rating
  • Figure 13: Global Market Value Share and BPS Analysis by Flow Rate, 2025 and 2035
  • Figure 14: Global Market Y-o-Y Growth Comparison by Flow Rate, 2025 to 2035
  • Figure 15: Global Market Attractiveness Analysis by Flow Rate
  • Figure 16: Global Market Value Share and BPS Analysis by End Use, 2025 and 2035
  • Figure 17: Global Market Y-o-Y Growth Comparison by End Use, 2025 to 2035
  • Figure 18: Global Market Attractiveness Analysis by End Use
  • Figure 19: Global Market Value (USD Billion) Share and BPS Analysis by Region, 2025 and 2035
  • Figure 20: Global Market Y-o-Y Growth Comparison by Region, 2025 to 2035
  • Figure 21: Global Market Attractiveness Analysis by Region
  • Figure 22: North America Market Incremental $ Opportunity, 2025 to 2035
  • Figure 23: Latin America Market Incremental $ Opportunity, 2025 to 2035
  • Figure 24: Western Europe Market Incremental $ Opportunity, 2025 to 2035
  • Figure 25: Eastern Europe Market Incremental $ Opportunity, 2025 to 2035
  • Figure 26: East Asia Market Incremental $ Opportunity, 2025 to 2035
  • Figure 27: South Asia & Pacific Market Incremental $ Opportunity, 2025 to 2035
  • Figure 28: Middle East and Africa Market Incremental $ Opportunity, 2025 to 2035
  • Figure 29: North America Market Value Share and BPS Analysis by Country, 2025 and 2035
  • Figure 30: North America Market Value Share and BPS Analysis by Product Type, 2025 and 2035
  • Figure 31: North America Market Y-o-Y Growth Comparison by Product Type, 2025 to 2035
  • Figure 32: North America Market Attractiveness Analysis by Product Type
  • Figure 33: North America Market Value Share and BPS Analysis by Orientation, 2025 and 2035
  • Figure 34: North America Market Y-o-Y Growth Comparison by Orientation, 2025 to 2035
  • Figure 35: North America Market Attractiveness Analysis by Orientation
  • Figure 36: North America Market Value Share and BPS Analysis by Pressure Rating, 2025 and 2035
  • Figure 37: North America Market Y-o-Y Growth Comparison by Pressure Rating, 2025 to 2035
  • Figure 38: North America Market Attractiveness Analysis by Pressure Rating
  • Figure 39: North America Market Value Share and BPS Analysis by Flow Rate, 2025 and 2035
  • Figure 40: North America Market Y-o-Y Growth Comparison by Flow Rate, 2025 to 2035
  • Figure 41: North America Market Attractiveness Analysis by Flow Rate
  • Figure 42: North America Market Value Share and BPS Analysis by End Use, 2025 and 2035
  • Figure 43: North America Market Y-o-Y Growth Comparison by End Use, 2025 to 2035
  • Figure 44: North America Market Attractiveness Analysis by End Use
  • Figure 45: Latin America Market Value Share and BPS Analysis by Country, 2025 and 2035
  • Figure 46: Latin America Market Value Share and BPS Analysis by Product Type, 2025 and 2035
  • Figure 47: Latin America Market Y-o-Y Growth Comparison by Product Type, 2025 to 2035
  • Figure 48: Latin America Market Attractiveness Analysis by Product Type
  • Figure 49: Latin America Market Value Share and BPS Analysis by Orientation, 2025 and 2035
  • Figure 50: Latin America Market Y-o-Y Growth Comparison by Orientation, 2025 to 2035
  • Figure 51: Latin America Market Attractiveness Analysis by Orientation
  • Figure 52: Latin America Market Value Share and BPS Analysis by Pressure Rating, 2025 and 2035
  • Figure 53: Latin America Market Y-o-Y Growth Comparison by Pressure Rating, 2025 to 2035
  • Figure 54: Latin America Market Attractiveness Analysis by Pressure Rating
  • Figure 55: Latin America Market Value Share and BPS Analysis by Flow Rate, 2025 and 2035
  • Figure 56: Latin America Market Y-o-Y Growth Comparison by Flow Rate, 2025 to 2035
  • Figure 57: Latin America Market Attractiveness Analysis by Flow Rate
  • Figure 58: Latin America Market Value Share and BPS Analysis by End Use, 2025 and 2035
  • Figure 59: Latin America Market Y-o-Y Growth Comparison by End Use, 2025 to 2035
  • Figure 60: Latin America Market Attractiveness Analysis by End Use
  • Figure 61: Western Europe Market Value Share and BPS Analysis by Country, 2025 and 2035
  • Figure 62: Western Europe Market Value Share and BPS Analysis by Product Type, 2025 and 2035
  • Figure 63: Western Europe Market Y-o-Y Growth Comparison by Product Type, 2025 to 2035
  • Figure 64: Western Europe Market Attractiveness Analysis by Product Type
  • Figure 65: Western Europe Market Value Share and BPS Analysis by Orientation, 2025 and 2035
  • Figure 66: Western Europe Market Y-o-Y Growth Comparison by Orientation, 2025 to 2035
  • Figure 67: Western Europe Market Attractiveness Analysis by Orientation
  • Figure 68: Western Europe Market Value Share and BPS Analysis by Pressure Rating, 2025 and 2035
  • Figure 69: Western Europe Market Y-o-Y Growth Comparison by Pressure Rating, 2025 to 2035
  • Figure 70: Western Europe Market Attractiveness Analysis by Pressure Rating
  • Figure 71: Western Europe Market Value Share and BPS Analysis by Flow Rate, 2025 and 2035
  • Figure 72: Western Europe Market Y-o-Y Growth Comparison by Flow Rate, 2025 to 2035
  • Figure 73: Western Europe Market Attractiveness Analysis by Flow Rate
  • Figure 74: Western Europe Market Value Share and BPS Analysis by End Use, 2025 and 2035
  • Figure 75: Western Europe Market Y-o-Y Growth Comparison by End Use, 2025 to 2035
  • Figure 76: Western Europe Market Attractiveness Analysis by End Use
  • Figure 77: Eastern Europe Market Value Share and BPS Analysis by Country, 2025 and 2035
  • Figure 78: Eastern Europe Market Value Share and BPS Analysis by Product Type, 2025 and 2035
  • Figure 79: Eastern Europe Market Y-o-Y Growth Comparison by Product Type, 2025 to 2035
  • Figure 80: Eastern Europe Market Attractiveness Analysis by Product Type
  • Figure 81: Eastern Europe Market Value Share and BPS Analysis by Orientation, 2025 and 2035
  • Figure 82: Eastern Europe Market Y-o-Y Growth Comparison by Orientation, 2025 to 2035
  • Figure 83: Eastern Europe Market Attractiveness Analysis by Orientation
  • Figure 84: Eastern Europe Market Value Share and BPS Analysis by Pressure Rating, 2025 and 2035
  • Figure 85: Eastern Europe Market Y-o-Y Growth Comparison by Pressure Rating, 2025 to 2035
  • Figure 86: Eastern Europe Market Attractiveness Analysis by Pressure Rating
  • Figure 87: Eastern Europe Market Value Share and BPS Analysis by Flow Rate, 2025 and 2035
  • Figure 88: Eastern Europe Market Y-o-Y Growth Comparison by Flow Rate, 2025 to 2035
  • Figure 89: Eastern Europe Market Attractiveness Analysis by Flow Rate
  • Figure 90: Eastern Europe Market Value Share and BPS Analysis by End Use, 2025 and 2035
  • Figure 91: Eastern Europe Market Y-o-Y Growth Comparison by End Use, 2025 to 2035
  • Figure 92: Eastern Europe Market Attractiveness Analysis by End Use
  • Figure 93: East Asia Market Value Share and BPS Analysis by Country, 2025 and 2035
  • Figure 94: East Asia Market Value Share and BPS Analysis by Product Type, 2025 and 2035
  • Figure 95: East Asia Market Y-o-Y Growth Comparison by Product Type, 2025 to 2035
  • Figure 96: East Asia Market Attractiveness Analysis by Product Type
  • Figure 97: East Asia Market Value Share and BPS Analysis by Orientation, 2025 and 2035
  • Figure 98: East Asia Market Y-o-Y Growth Comparison by Orientation, 2025 to 2035
  • Figure 99: East Asia Market Attractiveness Analysis by Orientation
  • Figure 100: East Asia Market Value Share and BPS Analysis by Pressure Rating, 2025 and 2035
  • Figure 101: East Asia Market Y-o-Y Growth Comparison by Pressure Rating, 2025 to 2035
  • Figure 102: East Asia Market Attractiveness Analysis by Pressure Rating
  • Figure 103: East Asia Market Value Share and BPS Analysis by Flow Rate, 2025 and 2035
  • Figure 104: East Asia Market Y-o-Y Growth Comparison by Flow Rate, 2025 to 2035
  • Figure 105: East Asia Market Attractiveness Analysis by Flow Rate
  • Figure 106: East Asia Market Value Share and BPS Analysis by End Use, 2025 and 2035
  • Figure 107: East Asia Market Y-o-Y Growth Comparison by End Use, 2025 to 2035
  • Figure 108: East Asia Market Attractiveness Analysis by End Use
  • Figure 109: South Asia & Pacific Market Value Share and BPS Analysis by Country, 2025 and 2035
  • Figure 110: South Asia & Pacific Market Value Share and BPS Analysis by Product Type, 2025 and 2035
  • Figure 111: South Asia & Pacific Market Y-o-Y Growth Comparison by Product Type, 2025 to 2035
  • Figure 112: South Asia & Pacific Market Attractiveness Analysis by Product Type
  • Figure 113: South Asia & Pacific Market Value Share and BPS Analysis by Orientation, 2025 and 2035
  • Figure 114: South Asia & Pacific Market Y-o-Y Growth Comparison by Orientation, 2025 to 2035
  • Figure 115: South Asia & Pacific Market Attractiveness Analysis by Orientation
  • Figure 116: South Asia & Pacific Market Value Share and BPS Analysis by Pressure Rating, 2025 and 2035
  • Figure 117: South Asia & Pacific Market Y-o-Y Growth Comparison by Pressure Rating, 2025 to 2035
  • Figure 118: South Asia & Pacific Market Attractiveness Analysis by Pressure Rating
  • Figure 119: South Asia & Pacific Market Value Share and BPS Analysis by Flow Rate, 2025 and 2035
  • Figure 120: South Asia & Pacific Market Y-o-Y Growth Comparison by Flow Rate, 2025 to 2035
  • Figure 121: South Asia & Pacific Market Attractiveness Analysis by Flow Rate
  • Figure 122: South Asia & Pacific Market Value Share and BPS Analysis by End Use, 2025 and 2035
  • Figure 123: South Asia & Pacific Market Y-o-Y Growth Comparison by End Use, 2025 to 2035
  • Figure 124: South Asia & Pacific Market Attractiveness Analysis by End Use
  • Figure 125: Middle East and Africa Market Value Share and BPS Analysis by Country, 2025 and 2035
  • Figure 126: Middle East and Africa Market Value Share and BPS Analysis by Product Type, 2025 and 2035
  • Figure 127: Middle East and Africa Market Y-o-Y Growth Comparison by Product Type, 2025 to 2035
  • Figure 128: Middle East and Africa Market Attractiveness Analysis by Product Type
  • Figure 129: Middle East and Africa Market Value Share and BPS Analysis by Orientation, 2025 and 2035
  • Figure 130: Middle East and Africa Market Y-o-Y Growth Comparison by Orientation, 2025 to 2035
  • Figure 131: Middle East and Africa Market Attractiveness Analysis by Orientation
  • Figure 132: Middle East and Africa Market Value Share and BPS Analysis by Pressure Rating, 2025 and 2035
  • Figure 133: Middle East and Africa Market Y-o-Y Growth Comparison by Pressure Rating, 2025 to 2035
  • Figure 134: Middle East and Africa Market Attractiveness Analysis by Pressure Rating
  • Figure 135: Middle East and Africa Market Value Share and BPS Analysis by Flow Rate, 2025 and 2035
  • Figure 136: Middle East and Africa Market Y-o-Y Growth Comparison by Flow Rate, 2025 to 2035
  • Figure 137: Middle East and Africa Market Attractiveness Analysis by Flow Rate
  • Figure 138: Middle East and Africa Market Value Share and BPS Analysis by End Use, 2025 and 2035
  • Figure 139: Middle East and Africa Market Y-o-Y Growth Comparison by End Use, 2025 to 2035
  • Figure 140: Middle East and Africa Market Attractiveness Analysis by End Use
  • Figure 141: Global Market - Tier Structure Analysis
  • Figure 142: Global Market - Company Share Analysis

Frequently Asked Questions

What is the estimated market size of the between bearing pumps market in 2025?

The market size is projected to be USD 2.2 billion in 2025.

What is the projected size of the between bearing pumps market by 2035?

The global market is projected to reach USD 3.1 billion by 2035.

What is the expected CAGR for the between bearing pumps market from 2025 to 2035?

The market is expected to grow at a CAGR of 3.5% during the forecast period.

Which flow rate segment dominates the between bearing pumps market?

Medium flow pumps are the leading flow rate segment, accounting for 39% of the market share in 2025.

Which country is expected to see the fastest growth in the between bearing pumps market?

India is forecast to grow at the highest CAGR of 4.2% from 2025 to 2035.

Explore Similar Insights

Future Market Insights

Between Bearing Pumps Market