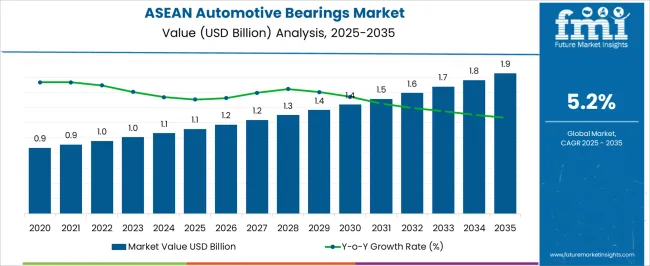
The ASEAN Automotive Bearings Market is estimated to be valued at USD 1.1 billion in 2025 and is projected to reach USD 1.9 billion by 2035, registering a compound annual growth rate (CAGR) of 5.2% over the forecast period.
| Metric | Value |
|---|---|
| ASEAN Automotive Bearings Market Estimated Value in (2025 E) | USD 1.1 billion |
| ASEAN Automotive Bearings Market Forecast Value in (2035 F) | USD 1.9 billion |
| Forecast CAGR (2025 to 2035) | 5.2% |
The ASEAN automotive bearings market is expanding steadily due to rising vehicle production, increasing demand for fuel efficiency, and growing emphasis on reducing maintenance costs. Rapid urbanization and improving road infrastructure are driving higher adoption of both passenger and commercial vehicles, which directly supports bearing demand.
Advancements in lightweight materials and precision engineering are enabling longer service life and improved vehicle performance. Regulatory pushes toward energy efficiency and emission reduction are further compelling automakers to integrate advanced bearing technologies.
Additionally, the growth of two wheeler ownership across emerging economies in the region has amplified demand for affordable and durable bearing solutions. The market outlook remains positive as evolving mobility patterns, aftermarket expansion, and rising consumer expectations for vehicle performance continue to create long term opportunities for bearing manufacturers in the ASEAN region.
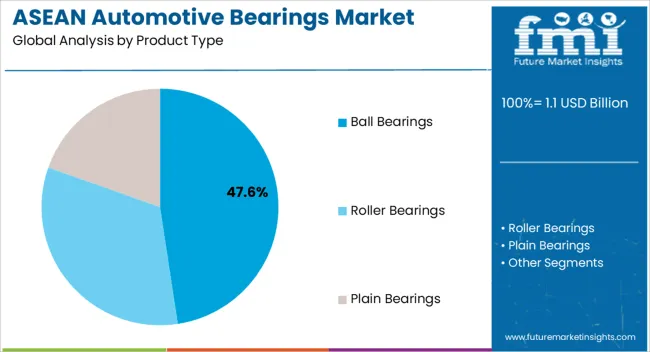
Ball bearings are projected to account for 47.60% of total revenue by 2025 within the product type category, positioning them as the leading segment. Their widespread use across multiple vehicle systems including wheels, transmissions, and engines is driving this dominance.
The segment has benefited from its ability to reduce friction, improve rotational efficiency, and enhance overall vehicle durability. The growing adoption of lightweight and high performance vehicles has further strengthened the demand for ball bearings.
Their cost effectiveness and adaptability across two wheelers, passenger cars, and commercial vehicles continue to support their prominence within the product type segment.
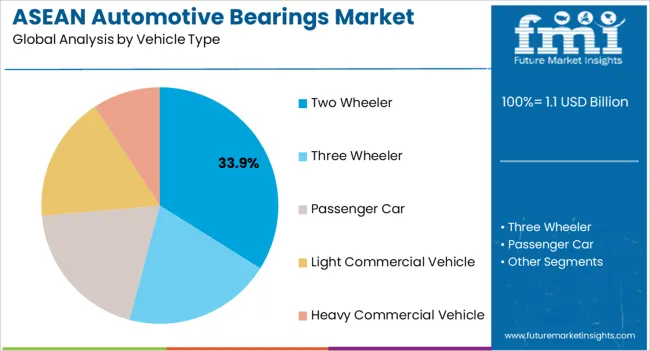
The two wheeler category is expected to represent 33.90% of total revenue by 2025 within the vehicle type segment, making it the leading category. This is attributed to the widespread ownership of motorcycles and scooters in ASEAN countries, driven by affordability, ease of use, and suitability for congested urban areas.
Bearings in two wheelers are critical for smooth engine functioning, wheel stability, and fuel efficiency. With rising disposable incomes and increased preference for personal mobility solutions, demand for durable and low maintenance bearings has intensified.
As manufacturers focus on enhancing engine performance and reducing frictional losses, two wheeler applications are set to maintain strong market leadership.
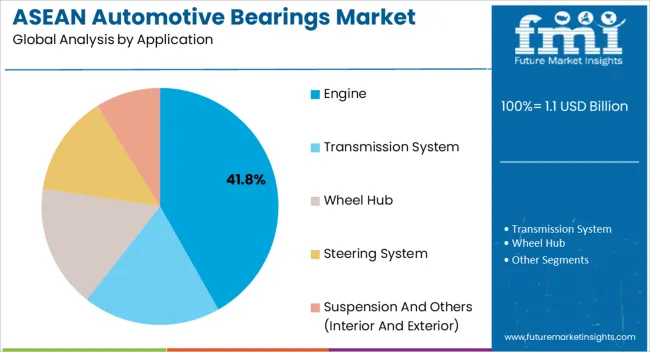
The engine segment is anticipated to contribute 41.80% of overall revenue by 2025 within the application category, establishing it as the most significant segment. Bearings are essential in engines to reduce wear, manage high loads, and ensure efficient rotation of critical components such as crankshafts and camshafts.
Growth in the segment is driven by rising vehicle production, stricter fuel efficiency standards, and the need for long lasting performance in both two wheelers and four wheelers. Increasing demand for high performance and low emission engines has encouraged the adoption of advanced bearing designs that minimize friction while improving energy transfer.
These factors collectively support the dominance of the engine segment in the ASEAN automotive bearings market.
The automotive sector has seen tremendous expansion in the ASEAN region during the past few years, due to favorable government policies, a growing population, and rising per capita income.
Auto production expansion has increased automotive bearings demand in ASEAN as well.
There is a growing demand for bearings from OEM sectors as well as the growth in the vehicles on the road.
Public awareness about the importance of routine vehicle maintenance is also there in ASEAN. The automotive bearings demand in ASEAN has been rising quickly in recent years.
The ASEAN region is home to many emerging countries, where the population and industrialization are rising. One of the swiftly expanding industries in the area is the automotive industry. The top 5 nations with heavy two-wheeler traffic are in ASEAN.
It has become simple for international businesses to expand their production capacity to the ASEAN region owing to several government programs and low tax rates in developing countries like Indonesia, Thailand, and Vietnam. Consequently, it has boosted the automotive bearings demand in ASEAN.
Over the assessment period from 2025 to 2035, the growth of automotive bearings is anticipated to increase at a growth rate of 4.7% by volume.
| Attributes | Details |
|---|---|
| ASEAN Automotive Bearings Market HCAGR (From 2020 to 2025) | 3% |
| ASEAN Automotive Bearings Market Size (2020) | USD 858.81 million |
| ASEAN Automotive Bearings Market Size (2025) | USD 964.8 million |
In ASEAN nations, the retail and eCommerce industries have been thriving. The need for transportation services is probably going to rise as digital customers become prevalent in ASEAN nations. In the eCommerce industry, two and three-wheeled vehicles have become important modes of transportation.
One of the notable technical advancements that are influencing the region's two- and three-wheeler sales and production is e-commerce. Sales of vehicle parts, particularly automotive bearings, have surged as a result of the rise in demand for two- and three-wheelers.
The demand for car parking spaces is growing in the area due to rising automotive bearings sales in ASEAN. Young owners and the development of automotive aftermarket maintenance activities have both increased the automotive bearings demand in ASEAN.
The manufacture of commercial vehicles that can carry heavy loads is growing, which has significantly increased the aftermarket sales of automotive bearings. The automotive bearings market in ASEAN is driven by the need for frequent bearing replacements in heavy commercial vehicles.
The increasing adoption of electric vehicles across the region has little impact on the market for automotive bearings because the number of bearings per vehicle in electric vehicles is low than in conventional vehicles.
The improved accessories and components in electric vehicles have increased per vehicle bearing count. With the expanding production of electric vehicles, the automotive bearing demand in ASEAN is likely to grow.
The price is one of the main obstacles faced by the automotive bearings market in ASEAN. Up to 62% of the manufacturer's sales are in raw materials. The cost of raw materials fluctuates often in response to shifting market economic conditions. Due to the fact that alloy steel and high-grade steel are predominantly utilized in bearings, changes in the global steel price have an impact on their pricing. These elements make it difficult for manufacturers of bearings to produce high-quality goods at competitive prices.
Bearings require routine maintenance for a long lifespan to prevent failures, which raises maintenance expenses. As a result, fluctuating raw material costs and continuing maintenance costs limit the ASEAN automotive bearings market expansion.
| Attributes | Details |
|---|---|
| Ball Bearing Segment Share | 44.2% |
The majority of sales are for ball bearings. By 2035, the ball-bearing segment may hold a 44.2% market share. The ball-bearing segment is expected to dominate due to technical advancements.
SKF has created a hybrid ball bearing (DGBB) that combines ceramic rolling components and steel rings. The bearings have strong electrical insulation and improved high-speed performance.
| Attributes | Details |
|---|---|
| Passenger Car Segment - Absolute Dollar Opportunity | USD 1.9 million |
| Passenger Car Segment Share | 44.7% |
The passenger car segment provides for the majority of automotive bearing demand in the ASEAN area. Between the years 2025 and 2035, the passenger car segment is estimated to generate an absolute dollar potential of more than USD 1.9 million. By 2035, the passenger automobile segment to have a 44.7% market share. The reason for such demand is that passenger automobiles are popular among all end users and have a high manufacturing rate than commercial vehicles.
Many bearings are needed per vehicle for passenger cars than for two- and three-wheelers. As a result of this reason, the passenger car category is the most in-demand in the ASEAN automotive bearings market.
| Attributes | Details |
|---|---|
| Market Y-o-Y | 4% |
| Market Size - 2035 | USD 1.9.0 million |
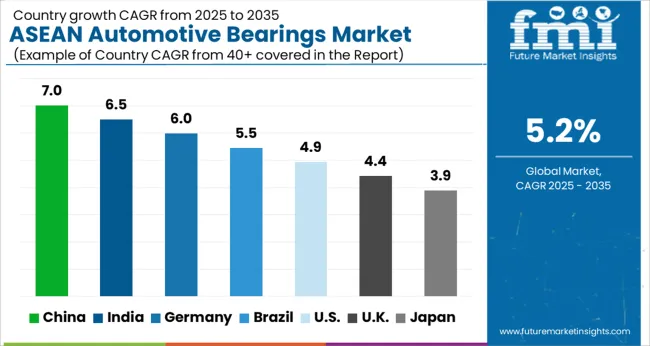
The Thailand automotive bearings market is anticipated to expand by 4.0% year on year in 2025. The Thailand market is to increase steadily over the forecast period, owing to the rising production capacity of leading vehicle manufacturers.
The factor is supported by favorable government policies and the high demand for passenger vehicles in the country. Thailand's automotive bearings market is predicted to reach USD 1.9.0 million by 2035, according to a study.
| Attributes | Details |
|---|---|
| Indonesia Market CAGR | 6.2% |
Indonesia is expected to develop at a 6.2% CAGR between 2025 and 2035. Demand for automobile bearings has increased as a result of local manufacturers inventing such products at competitive prices. Aside from that, a surge in passenger car production is assisting the industry in Indonesia.
The increase is attributable to a growing preference for personal mobility, which is driving the rise of automobiles and warehouses. Government initiatives to increase EV adoption are expected to support market growth throughout the forecast period.
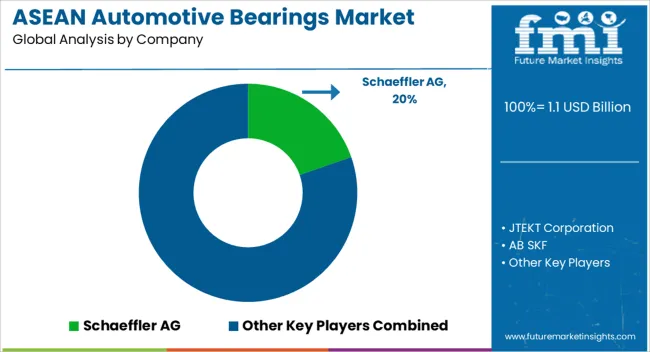
Due to their extensive product portfolios, increased manufacturing capacity, and aggressive pricing strategies, a few groups of key competitors dominate the automotive bearings market in ASEAN.
To increase production and reduce costs, manufacturers are concentrating on introducing technical advancements into the automobile bearings manufacturing process. In recent years, there has been an increase in partnerships and collaboration with automakers aimed at boosting automotive bearings sales. The introduction of energy-efficient products is a main emphasis for several significant automobile bearings manufacturers.
The automotive bearings market in ASEAN is to grow due to expansion in the automotive industry. Automotive bearings are essential to increasing a vehicle's efficiency. Market future expansion is predicted to be aided by research and development in bearing materials and coatings. Due to their low noise properties, carbon steel bearings are becoming widely popular in the ASEAN automotive bearings industry.
The increased use of sensor bearings may probably present profitable growth prospects for ASEAN automotive bearings manufacturers. Bearings with sensors built-in help cut down on the overall amount of vehicle components. To enhance their market share, ASEAN automotive bearings manufacturers are hugely spending on research and development of novel products.
2025
| Company | Schaeffler AG |
|---|---|
| Strategy | Schaeffler AG has introduced two new bearings for electric vehicles. |
| Details | Schaeffler AG introduced two new electric car bearings in February 2025. The new TriFinity bearing variant is expected to improve the energy efficiency of chassis systems. |
| Company | NTN Corporation |
|---|---|
| Strategy | NTN Corporation created high-speed deep groove ball bearings. |
| Details | In February 2025, NTN Corporation designed high-speed deep groove ball bearings for electric and hybrid electric vehicles in order to improve vehicle performance. |
2024
| Company | NSK Ltd. |
|---|---|
| Strategy | NSK Ltd. (NSK) announced the development of a 100% bioplastic heat-resistant cage in October 2024. |
| Details | NSK Ltd. (NSK) announced the development of the first rolling bearing cage made entirely of bioplastic. The new cage can resist temperatures as high as 120°C. |
| Company | JTEKT |
|---|---|
| Strategy | JTEKT created new sealable ball bearings. |
| Details | JTEKT produced new ball bearings with highly resistant muddy water seals in June 2024. These bearings can be used in agricultural machinery that operates in tough settings. |
2024
| Company | NSK |
|---|---|
| Strategy | NSK created an ultra-high-speed ball bearing for EV motors in March 2024. |
| Details | This item contributed to increased vehicle range, reduced power consumption per unit of distance, great operating speeds for electric motors, and improved user comfort. |
2020
| Company | SKF |
|---|---|
| Strategy | Form Automation Solution (FAS) was bought by SKF. |
| Details | SKF bought Form Automation Solution (FAS), a software development business, in November 2020. This acquisition increased customers' inspection skills and task management while also converting the manual knowledge collection technique into ready-to-use information for the operator. |
The global asean automotive bearings market is estimated to be valued at USD 1.1 billion in 2025.
The market size for the asean automotive bearings market is projected to reach USD 1.9 billion by 2035.
The asean automotive bearings market is expected to grow at a 5.2% CAGR between 2025 and 2035.
The key product types in asean automotive bearings market are ball bearings, _deep groove ball bearings, _angular contact ball bearings, _thrust ball bearings, _self-alignment ball bearings, roller bearings, _tapered roller bearings, _cylindrical roller bearings, _spherical roller bearings, _needle roller bearings, _thrust roller bearings and plain bearings.
In terms of vehicle type, two wheeler segment to command 33.9% share in the asean automotive bearings market in 2025.


Our Research Products

The "Full Research Suite" delivers actionable market intel, deep dives on markets or technologies, so clients act faster, cut risk, and unlock growth.

The Leaderboard benchmarks and ranks top vendors, classifying them as Established Leaders, Leading Challengers, or Disruptors & Challengers.

Locates where complements amplify value and substitutes erode it, forecasting net impact by horizon

We deliver granular, decision-grade intel: market sizing, 5-year forecasts, pricing, adoption, usage, revenue, and operational KPIs—plus competitor tracking, regulation, and value chains—across 60 countries broadly.

Spot the shifts before they hit your P&L. We track inflection points, adoption curves, pricing moves, and ecosystem plays to show where demand is heading, why it is changing, and what to do next across high-growth markets and disruptive tech

Real-time reads of user behavior. We track shifting priorities, perceptions of today’s and next-gen services, and provider experience, then pace how fast tech moves from trial to adoption, blending buyer, consumer, and channel inputs with social signals (#WhySwitch, #UX).

Partner with our analyst team to build a custom report designed around your business priorities. From analysing market trends to assessing competitors or crafting bespoke datasets, we tailor insights to your needs.
Supplier Intelligence
Discovery & Profiling
Capacity & Footprint
Performance & Risk
Compliance & Governance
Commercial Readiness
Who Supplies Whom
Scorecards & Shortlists
Playbooks & Docs
Category Intelligence
Definition & Scope
Demand & Use Cases
Cost Drivers
Market Structure
Supply Chain Map
Trade & Policy
Operating Norms
Deliverables
Buyer Intelligence
Account Basics
Spend & Scope
Procurement Model
Vendor Requirements
Terms & Policies
Entry Strategy
Pain Points & Triggers
Outputs
Pricing Analysis
Benchmarks
Trends
Should-Cost
Indexation
Landed Cost
Commercial Terms
Deliverables
Brand Analysis
Positioning & Value Prop
Share & Presence
Customer Evidence
Go-to-Market
Digital & Reputation
Compliance & Trust
KPIs & Gaps
Outputs
Full Research Suite comprises of:
Market outlook & trends analysis
Interviews & case studies
Strategic recommendations
Vendor profiles & capabilities analysis
5-year forecasts
8 regions and 60+ country-level data splits
Market segment data splits
12 months of continuous data updates
DELIVERED AS:
PDF EXCEL ONLINE
ASEAN and Gulf Countries MAP & VSP Packaging Market Size and Share Forecast Outlook 2025 to 2035
ASEAN Flexible Plastic Packaging Market Analysis - Size, Share, and Forecast Outlook 2025 to 2035
ASEAN Human Milk Oligosaccharides Market Report – Size, Demand & Growth 2025–2035
ASEAN Probiotic Ingredients Market Outlook – Growth, Size & Forecast 2025–2035
ASEAN Food Additives Market Insights – Growth, Demand & Forecast 2025–2035
ASEAN Chitin Market Analysis – Trends, Demand & Forecast 2025–2035
ASEAN Bakery Mixes Market Outlook – Size, Share & Forecast 2025–2035
ASEAN Non-Alcoholic Malt Beverages Market Trends – Demand & Forecast 2025–2035
ASEAN Animal Feed Alternative Protein Market Insights – Demand, Size & Industry Trends 2025–2035
ASEAN Chickpea Protein Market Trends – Growth, Demand & Forecast 2025–2035
ASEAN Food Testing Services Market Analysis – Size, Share & Forecast 2025–2035
ASEAN Food Emulsifier Market Report – Trends, Demand & Industry Forecast 2025–2035
ASEAN Yeast Market Report – Trends, Demand & Industry Forecast 2025–2035
ASEAN Green and Bio-based Polyol Market Growth – Trends, Demand & Innovations 2025–2035
ASEAN Natural Food Color Market Outlook – Share, Growth & Forecast 2025–2035
ASEAN Coated Fabrics Market Insights – Demand, Size & Industry Trends 2025–2035
ASEAN Barite Market Analysis – Size, Share & Forecast 2025–2035
ASEAN Shrimp Market Trends – Growth, Demand & Forecast 2025–2035
ASEAN Pulses Market Analysis – Size, Share & Forecast 2025–2035
ASEAN Probiotic Strains Market Analysis – Size, Share & Forecast 2025–2035

Thank you!
You will receive an email from our Business Development Manager. Please be sure to check your SPAM/JUNK folder too.
Chat With
MaRIA