Reports

- Global Locations -

Headquarters

Future Market Insights, Inc.

Christiana Corporate, 200
Continental Drive, Suite 401,
Newark, Delaware - 19713,
United States

T: +1-845-579-5705

Americas

Future Market Insights, Inc.

616 Corporate Way, Suite 2-9018,
Valley Cottage, NY 10989, United States

T: +1-347-918-3531

MEA

Future Market Insights

1602-6 Jumeirah Bay X2 Tower, Plot No: JLT-PH2-X2A,
Jumeirah Lakes Towers, Dubai,
United Arab Emirates

Europe

Future Market Insights

3rd Floor, 207 Regent Street,
W1B 3HH London
United Kingdom

T: + 44 (0) 20 8123 9659
D: +44 (0) 20 3287 4268

Asia Pacific

Future Market Insights

IndiaLand Global Tech Park, Unit UG-1, Behind Grand HighStreet, Phase 1, Hinjawadi, MH, Pune – 411057, India

Automotive Bearing and Clutch Component Aftermarket Outlook from 2023 to 2033

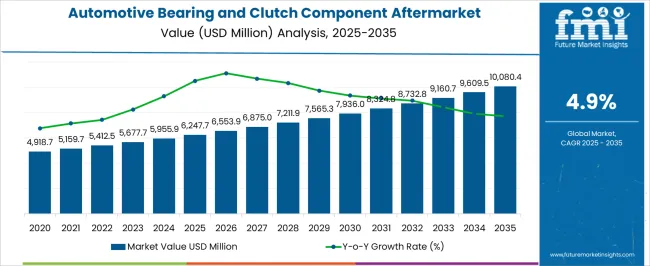
The global automotive bearing and clutch component aftermarket size reached US$ 5,677.7 million in 2023. Over the assessment period, global demand for aftermarket automotive bearings and clutch components is projected to rise at 4.9% CAGR. The total market value at the end of 2033 is predicted to reach US$ 9,145.2 million.

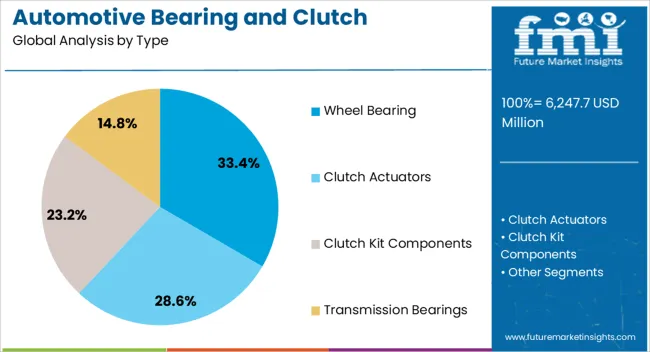
As per the latest analysis, the clutch kit components segment is expected to dominate the global market, totaling a valuation of US$ 4,156.0 million in 2033. On the other hand, the clutch actuators category is set to rise at a higher CAGR of 5.7% during the forecast period.

Attributes Key Insights
Base Aftermarket Value (2023) US$ 5,677.7 million
Projected Automotive Bearing and Clutch Component Aftermarket Revenue (2033) US$ 9,145.2 million
Value-based CAGR (2023 to 2033) 4.9%
Collective Value Share: Top 5 Countries (2023E) 52.2%

Don't pay for what you don't need

Customize your report by selecting specific countries or regions and save 30%!

Key Automotive Bearing and Clutch Component Aftermarket Highlights

  • Market to Expand Over 1.6X through 2033

The global automotive bearing and clutch component aftermarket is anticipated to expand over 1.6X through 2033, amid a 4.7% surge in projected CAGR compared to the historical one. This is due to the growing demand for affordable and reliable aftermarket solutions driven by the increasing global vehicle parc, the rising average age of vehicles, and the emphasis on cost-effective maintenance and repair options.

As the automotive industry experiences continuous growth, the need for replacement bearings and clutch components is escalating. This is expected to create lucrative growth prospects for aftermarket automotive bearing and clutch component suppliers.

Other Factors Driving Automotive Bearing and Clutch Component Aftermarket

  • Robust expansion of the automotive sector globally and surging demand for vehicle accessories
  • Growing need to reduce worn or damaged parts like bearings in vehicles
  • Cost-effectiveness of aftermarket automotive parts
  • Malfunctioning of automotive bearings and clutch components due to various factors
  • Growing focus on improving the efficiency, safety, and reliability of vehicles
  • Commercial vehicle boom, especially across developing regions
  • Increasing awareness of vehicle maintenance and repair
  • Easy access to aftermarket components due to the robust growth of e-commerce platforms and online marketplaces
  • Rising demand for aftermarket services
  • Reduction in clutch release bearings in India and other nations

Automotive Bearing and Clutch Component Aftermarket Trends

  • Growing preference for vehicle customization
  • Integration of 3D printing and additive manufacturing
  • Rising demand for electric and hybrid vehicle components
  • The trend toward direct-to-consumer (DTC) sales and the proliferation of online marketplaces
  • Continuous advancements in bearing and clutch technologies
  • Surging popularity of smart bearings
  • Rising interest in preventive maintenance

North America to Remain at the Epicenter of Growth

As per the latest analysis, North America is expected to dominate the global aftermarket during the forecast period. It will likely account for around 48.5% of the global automotive bearing and clutch component aftermarket share in 2033. This is attributed to the following factors:

  • Vehicle Aging Population: The North American automotive fleet is aging, leading to an increased demand for replacement parts and aftermarket components. As vehicles age, there is a higher likelihood of wear and tear in essential systems like bearings and clutches, driving the need for aftermarket solutions.
  • Consumer Preference for Affordable Maintenance: The cost-conscious approach of consumers in North America contributes to the preference for aftermarket solutions over original equipment manufacturer (OEM) replacements. The aftermarket sector provides cost-effective alternatives without compromising quality, making it an attractive choice for consumers looking to maintain their vehicles economically.
  • Rising Vehicle Parc: The growing number of vehicles on the road in North America amplifies the demand for aftermarket components. A larger vehicle parc results in increased opportunities for aftermarket suppliers to cater to maintenance and repair needs, fostering the growth of the aftermarket in the region.
  • Advanced Distribution Channels: North America has well-established and efficient aftermarket distribution networks. The accessibility of aftermarket products through various channels, including online platforms and retail outlets, enhances the availability and convenience of obtaining automotive bearing and clutch components, further fueling market growth.

Clutch Kit Components Set to Maintain their Market Dominance through 2033

Clutch kit components are poised to dominate the global automotive bearing and clutch component aftermarket through 2033. This is primarily due to their comprehensive nature, encompassing various essential elements like the clutch disc, pressure plate, and release bearing. They provide a convenient one-stop solution for replacement needs and simplify the maintenance process for vehicle owners and mechanics alike.

The high wear and tear experienced by clutch components, coupled with a preference for preventive maintenance practices, further drive the significant demand for clutch kits. They are becoming a cost-effective, easy-to-install, and popular choice within the aftermarket. Currently, the target segment holds a dominant value share of 43.8%.

Nikhil Kaitwade
Nikhil Kaitwade

Principal Consultant

Talk to Analyst

Find your sweet spots for generating winning opportunities in this market.

Automotive Bearing and Clutch Component Aftermarket Overview

The automotive bearing and clutch component aftermarket is poised to register steady growth during the assessment period. This market serves as the post-purchase ecosystem for a wide range of automotive parts, such as wheel bearings, transmission bearings, and clutch actuators, which are utilized for vehicle maintenance, repair, and enhancement purposes.

The aftermarket sector provides consumers and businesses with a cost-effective alternative to original equipment manufacturer (OEM) parts, catering to a wide variety of automotive needs. As a result, it is becoming a highly lucrative business globally.

Aftermarket automotive components allow car owners to extend the lifespan of their vehicles and enhance their performance without spending a lot. Growing preference for these aftermarket parts is expected to boost market revenue through 2033.

A notable trend within the automotive bearing and clutch component aftermarket is the increasing demand for specialized parts and accessories catering to off-road and adventure vehicle enthusiasts. This segment seeks unique solutions, such as heavy-duty wheel bearings, rugged clutch kits, and specialized transmission bearing replacements designed to withstand the rigors of off-road terrain.

The trend reflects a growing passion for recreational off-roading, overlanding, and outdoor adventures. As a result, aftermarket manufacturers are investing in robust, off-road-ready components, often incorporating advanced materials and innovative designs.

The digital transformation of the automotive bearing and clutch components aftermarket presents a significant opportunity for growth. E-commerce platforms have become essential in the industry, allowing consumers and businesses to browse and purchase parts online, expanding the market reach.

Digital platforms also allow aftermarket companies to showcase their products, offer detailed information, and provide customer support. Investing in user-friendly e-commerce websites and leveraging digital marketing strategies can help aftermarket businesses tap into a broader customer base, increase brand visibility, and improve the overall customer experience.

The continued expansion of online sales and the integration of digital tools for parts identification and purchase create ample room for growth and convenience in the market. Similarly, customization and catering to niche markets represent a growing opportunity in the automotive bearing and clutch components aftermarket.

Consumers often seek personalized and specialized solutions for their vehicles, whether for aesthetic enhancements, performance upgrades, or unique applications. Aftermarket manufacturers can capitalize on this by offering a wide range of customization options, from personalized accessories to performance-enhancing kits.

Catering to niche markets, such as classic car enthusiasts, off-road adventurers, or electric vehicle owners, can be highly profitable. Specialized components and kits that meet the distinct needs of these market segments can be developed, providing a competitive edge and appealing to a dedicated customer base.

Embracing customization and catering to niche markets can lead to increased sales and brand loyalty in the aftermarket industry. This will bode well for the target market during the assessment period.

Historical Automotive Bearing and Clutch Component Aftermarket Vs. 2023 to 2033

Global sales of aftermarket automotive bearings and clutch components grew at a CAGR of 0.2% between 2018 and 2022. Total market revenue reached about US$ 5,422.9 million in 2022. In the forecast period, the automotive bearing and clutch component aftermarket is anticipated to expand at a CAGR of 4.9%.

Historical CAGR (2018 to 2022) 0.2%
Forecast CAGR (2023 to 2033) 4.9%

The global aftermarket for automotive bearings and clutch components witnessed sluggish growth between 2018 and 2022. This was mainly due to reduced demand for aftermarket automotive components because of the impact of the COVID-19 pandemic.

Governments across the world imposed strict restrictions on the movement of people and vehicles during the pandemic to curb the spread of the virus. This, in turn, decreased demand for vehicle repair and automotive spare parts, including bearing replacement and clutch system parts.

Future Scope of the Automotive Bearing and Clutch Component Aftermarket

In the assessment period, the global aftermarket is set to rise steadily, reaching a valuation of US$ 9,145.2 million by 2033. This is attributable to several factors, including the sustained growth of the global automotive industry, an expanding vehicle parc, and increasing emphasis on cost-effective maintenance solutions.

Consumers and businesses are becoming aware of the economic benefits of aftermarket components, such as clutch release bearings. This is anticipated to propel their demand during the assessment period.

Technological advancements in aftermarket products and a rising trend toward vehicle customization and upgrades will further boost the market. The aftermarket's ability to offer a diverse range of high-quality products, often at competitive prices, coupled with favorable regulatory environments supporting fair competition and product safety, contributes to the positive trajectory.

Get the data you need at a Fraction of the cost

Personalize your report by choosing insights you need
and save 40%!

Key Market Dynamics

  • Increasing Vehicle Ownership and Aging Vehicle Fleet

One of the primary factors driving the growth of the automotive bearing and clutch component aftermarket is the continuously increasing vehicle ownership. Similarly, the aging vehicle fleet will likely elevate aftermarket bearing and clutch component demand.

As more consumers purchase and keep their vehicles for longer periods, the demand for replacement parts such as wheel bearings, clutch actuators, and transmission bearings naturally rises. Older vehicles tend to require more frequent repairs and maintenance, creating a steady and growing market for aftermarket parts.

The trend is further accentuated by consumers' desire to extend the lifespan of their vehicles. Aftermarket parts are becoming crucial solutions for maintaining roadworthy cars and reducing the overall cost of vehicle ownership.

  • Technological Advancements and Performance Enhancement

Another key driver in the automotive bearing and clutch component aftermarket is the continuous technological advancements and the quest for improved vehicle performance. Modern vehicles are equipped with increasingly sophisticated components, including advanced bearing technologies, clutch actuation systems, and enhanced clutch kits.

As consumers seek better performance, fuel efficiency, and reliability from their vehicles, there is a growing demand for aftermarket parts that offer upgraded features and durability. This driver not only fuels replacement part sales but also opens opportunities for companies to provide innovative and high-performance aftermarket solutions.

  • Maintenance and Repair Awareness

The increasing awareness of vehicle maintenance and repair is a vital driver in the automotive bearing and clutch component aftermarket. Consumers are becoming more conscious of the need to maintain their vehicles regularly to ensure safety and extend their lifespan, thereby fostering sales growth.

Today, car owners are more inclined to replace worn-out or faulty parts with high-quality aftermarket alternatives. This is not limited to individual vehicle owners but also extends to fleet operators and commercial vehicle owners who prioritize regular maintenance to minimize downtime and ensure the longevity of their vehicles.

  • Economic Factors and Cost-effective Repair

Economic factors play a significant role in fostering automotive bearing and clutch components aftermarket growth. When economic conditions are challenging, consumers and businesses often opt for cost-effective repairs and maintenance over purchasing new vehicles. This drives the demand for affordable aftermarket parts as they offer a more budget-friendly alternative to original equipment manufacturer (OEM) parts.

The availability of high-quality automotive parts at competitive prices becomes a compelling option for those looking to keep their vehicles operational while minimizing expenses. In times of economic uncertainty, the aftermarket parts industry can experience increased growth as consumers and businesses prioritize cost-effective repair solutions.

Factors Restraining Automotive Bearing and Clutch Component Aftermarket Growth

  • Counterfeit and Low-quality Parts

One significant restraint in the automotive bearing and clutch component aftermarket is the proliferation of counterfeit and low-quality parts. Counterfeit parts, often sold at lower prices, pose a significant risk to consumers and the market as a whole. These parts may lack the necessary quality standards, leading to subpar performance and potential safety hazards.

The presence of counterfeit parts can erode trust in the aftermarket sector, making consumers wary of purchasing non-OEM parts. To overcome this challenge, regulatory bodies, and industry stakeholders must work together to enforce quality standards and establish mechanisms to detect and prevent the distribution of counterfeit components. This restraint underscores the importance of maintaining the integrity and reputation of the aftermarket industry.

  • Technological Complexity and Diagnostic Challenges

The increasing complexity of modern vehicles presents a significant restraint for the automotive bearing and clutch components aftermarket. Many new vehicles are equipped with advanced technology and electronics, making it more challenging for aftermarket mechanics to diagnose and repair issues accurately. This complexity results in a growing reliance on specialized diagnostic tools and expertise, which can be costly and time-consuming.

Several vehicle manufacturers limit access to their diagnostic software and tools, making it difficult for aftermarket service providers to compete effectively. Overcoming this restraint requires investment in training and technology, as well as cooperation between vehicle manufacturers and aftermarket businesses to ensure access to necessary diagnostic resources.

Comparative View of Adjacent Markets

The global automotive bearing and clutch component aftermarket is likely to be impacted by the peer or tangential markets in the automotive division. These include the plain-bearing market and the railway-bearing industry.

Among the mentioned markets, the railway-bearing market is poised to rise more rapidly during the forecast period. This is attributable to rising investments in developing and expanding railway infrastructure and a growing number of metro trains globally.

Automotive Bearing and Clutch Components Aftermarket Analysis:

Attributes Automotive Bearing and Clutch Components Aftermarket Outlook
CAGR (2023 to 2033) 4.9%
Market Value (2023) US$ 5,677.7 million
Growth Factor Increasing vehicle ownership globally, along with the aging vehicle fleet, is expected to boost the growth of the automotive bearing and clutch component aftermarket.
Key Trend Rising demand for electric and hybrid vehicle components and integration of 3D printing and additive manufacturing are notable trends in the automotive bearing and clutch component aftermarket.

Plain Bearing Market Analysis:

Attributes Plain Bearing Industry Outlook
CAGR (2023 to 2033) 5.7%
Market Value (2023) US$ 12,019.3 million
Growth Factor Increasing industrial applications and the automotive sector's focus on lightweight, energy-efficient components are expected to drive the growth of the plain bearing market.
Key Trend A key market-shaping trend is the growing demand for self-lubricating and maintenance-free solutions that enhance operational efficiency and reduce the need for frequent maintenance.

Railway Bearing Demand Outlook:

Attributes Railway Bearing Market Analysis
CAGR (2023 to 2033) 9.0%
Market Value (2023) US$ 1.3 billion
Growth Factor The expansion and modernization of railway infrastructure, coupled with the growing demand for efficient and reliable rolling stock components, will boost the market.
Key Trend The adoption of advanced materials and technologies, such as ceramic bearings, to enhance durability, reduce friction, and improve overall performance in rail applications is anticipated to facilitate market expansion.

Country-wise Insights

The table below highlights the top nations' automotive bearing and clutch component aftermarket revenue. The United States, China, and India are anticipated to remain top consumers of aftermarket automotive products like automotive bearings and clutch components, with expected valuations of US$ 3,647.8 million, US$ 1,341.9 million, and US$ 503.6 million, respectively, in 2033.

Countries Automotive Bearing and Clutch Component Aftermarket Revenue (2033)
United States US$ 3,647.8 million
China US$ 1,341.9 million
India US$ 503.6 million
Canada US$ 442.3 million
ASEAN US$ 410.8 million

The table below shows the estimated growth rates of the top three countries. South Africa, Nordics, and Poland are set to record higher CAGRs of 8.0%, 7.9%, and 7.3%, respectively, through 2033.

Countries Projected Automotive Bearing and Clutch Components Aftermarket CAGR (2023 to 2033)
South Africa 8.0%
NORDICS 7.9%
Poland 7.3%
Turkiye 7.0%
Kingdom of Saudi Arabia 6.9%

Innovation in Bearing and Clutch Technologies Boosting United States Aftermarket

The United States automotive bearing and clutch component aftermarket size is expected to reach US$ 3,647.8 million by 2033. Over the forecast period, demand for aftermarket automotive bearing and clutch components in the United States is poised to rise at 4.0% CAGR, driven by factors like:

  • Rise in older vehicle fleet
  • Ongoing innovations in bearing and clutch technologies
  • Growing trend of DIY repairs
  • Changing environmental regulations and emission standards

A key factor driving the growth of the automotive bearing and clutch component aftermarket in the United States is the relentless pursuit of innovation within the automotive industry. The integration of cutting-edge technologies, such as advanced materials, precision engineering, and smart systems, is revolutionizing the design and functionality of automotive bearings and clutch components.

Manufacturers are increasingly focused on developing products that not only enhance vehicle performance but also address evolving consumer preferences for sustainability, efficiency, and durability. This will likely improve the United States' automotive bearing and clutch component aftermarket share.

The demand for innovative solutions is particularly evident in the shift towards electric and hybrid vehicles, where specialized bearing and clutch components play a pivotal role in ensuring optimal functionality and performance. This intersection of innovation and sustainability is reshaping the aftermarket sector.

Top manufacturers will continue to introduce novel aftermarket products like clutch release bearings. This will help them fulfill the needs of consumers seeking products that meet traditional performance standards and align with modern environmental and technological expectations.

Increasing Vehicle Ownership Propelling Demand in China

China stands prominently at the forefront of automotive bearing and clutch component aftermarket growth. This is attributable to a combination of factors, including:

  • The country's sustained economic development
  • Burgeoning automotive industry and rising vehicle ownership
  • Ongoing technological advancements in bearings and clutch components
  • Strong presence of leading automotive aftermarket companies

One crucial factor contributing to China's leadership is its robust manufacturing capabilities. Similarly, increasing vehicle ownership implies a higher potential for component failures and replacements, driving demand for aftermarket parts like bearings.

China has emerged as a manufacturing powerhouse, producing a vast array of automotive components with a focus on quality and efficiency. This manufacturing prowess supports domestic demand and positions China as a significant exporter of aftermarket products to international markets.

As per the latest analysis, sales of aftermarket automotive bearing and clutch components in China are projected to soar at a CAGR of around 5.0% during the assessment period. Total valuation in the country is anticipated to reach US$ 1,341.9 million by 2033.

Rising Sales of Commercial Vehicles Making India a Lucrative Pocket

India's automotive bearing and clutch component aftermarket value is anticipated to total US$ 503.6 million by 2033. It will likely exhibit a CAGR of 4.7% during the assessment period, driven by factors like:

  • Commercial vehicle boom
  • Rising focus on vehicle maintenance
  • Cost-effectiveness of aftermarket automotive parts
  • Favorable government support

The automotive bearing and clutch component aftermarket in India is poised to exhibit steady growth. This is primarily due to the surge in sales of commercial vehicles and the robust expansion of the logistics and transportation sector.

As the nation witnesses increased economic activities and trade, the need for reliable and efficient commercial vehicles becomes paramount. This, in turn, drives the demand for quality automotive bearing and clutch components, as these are essential for ensuring the optimal performance and durability of commercial vehicle fleets.

India's thriving logistics industry, fueled by e-commerce and the growing need for efficient supply chain management, further amplifies the demand for aftermarket solutions. The constant movement of goods across vast geographical areas puts a premium on the reliability and longevity of automotive components.

Manufacturers in India are keenly attuned to these market dynamics, producing aftermarket products that cater to the specific needs of the commercial vehicle and logistics sectors. This will bode well for the market over the forecast period.

Category-wise Insights

The section below shows that the clutch kit components segment dominates the automotive bearing and clutch component aftermarket. It is predicted to expand at a 5.3% CAGR between 2023 and 2033. Based on vehicle type, the vans segment is projected to record a CAGR of 4.5% during the forecast period.

Clutch Kit Components Remain Highly Sought-after Products

Top Segment (Product Type) Clutch Kit Components
Predicted CAGR (2023 to 2033) 5.3%

As per the latest analysis, the clutch kit components segment is expected to dominate the global market during the forecast period. It will likely exhibit a CAGR of 5.3%, totaling a valuation of US$ 4,156.0 million by 2033.

The dominance of clutch kit components is symbolic of their pivotal role in shaping the industry landscape. As a vital element within the automotive transmission system, clutch kits play a central role in ensuring smooth engagement and disengagement of the vehicle's power transmission.

The dominance of clutch kit components can be attributed to their indispensability in maintaining the functionality and performance of a vehicle's clutch system. Comprising components such as the clutch disc, pressure plate, release bearing, and alignment tool, clutch kits are comprehensive solutions that address wear and tear issues commonly associated with clutch assembly.

One key factor contributing to the prominence of clutch kit components is the widespread use of manual transmissions in various vehicles across the globe. As manual transmissions continue to be prevalent, particularly in certain regions and vehicle types, the demand for reliable and efficient clutch systems remains high.

Consequently, the aftermarket for clutch kit components experiences sustained growth as vehicle owners seek replacements and upgrades for optimal clutch performance. Currently, the target segment holds a significant volume share of 43.8%.

Vans Category to Generate High Revenue Through 2033

Top Segment (Vehicle Type) Vans
Predicted CAGR (2023 to 2033) 4.5%

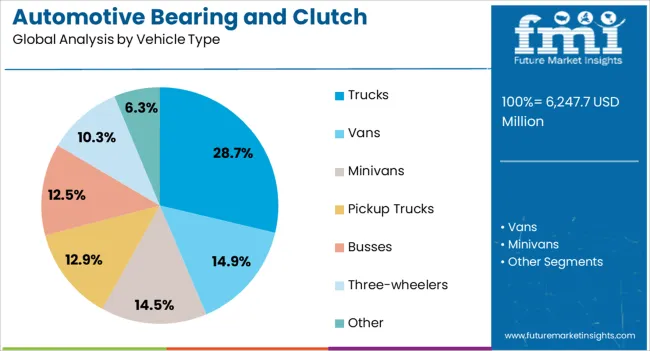
Based on vehicle type, vans are expected to create lucrative revenue-generative prospects for the automotive bearing and clutch component aftermarket. This is attributable to the widespread usage of vans in several applications.

The significant sales volume in the vans category is a key factor influencing its prominence. Vans, ranging from compact urban delivery vans to larger cargo vans, enjoy substantial popularity in both commercial and personal use.

In the commercial sector, the efficiency and flexibility offered by vans make them indispensable for businesses involved in delivery services, trades, and logistics. The aftermarket for automotive bearing and clutch components becomes crucial for van owners and fleet operators seeking reliable replacements and upgrades to ensure the continuous and optimal performance of their vehicles, given the substantial market presence.

The vans category includes a range of models, from compact urban delivery vans to larger cargo vans, each tailored to specific needs. This diversity contributes to the broad market appeal of van-related aftermarket products, as they cater to a wide array of applications and industries.

The latest automotive bearing and clutch components aftermarket analysis predicts the vans segment will grow at 4.5% CAGR during the forecast period. It is set to attain a valuation of US$ 2,447.9 million by 2033.

Competitive Landscape

The global automotive bearing and clutch component aftermarket is slightly fragmented, with leading players accounting for about 25% to 30% share. Bosch, ZF Friedrichshafen AG, AISIN, Valeo, Eaton Corporation Plc & Aptiv are the leading manufacturers and suppliers of automotive bearing and clutch components listed in the report.

Key companies are concentrating on developing novel solutions to meet the evolving needs of the automotive sector. For instance, they are developing new light, durable, high-performance automotive bearings for electric vehicles. Many players also employ strategies like mergers, partnerships, distribution agreements, acquisitions, and facility expansions to strengthen their footprint.

Recent Developments in Automotive Bearing and Clutch Component Aftermarket-

  • In October 2023, Bosch made a significant development by unveiling advanced electric mobility solutions, reinforcing its commitment to the electric and hybrid vehicle market.
  • In March 2022, ZF Friedrichshafen AG achieved a key milestone in autonomous driving technology, introducing an upgraded suite of advanced driver assistance systems (ADAS) that enhances vehicle autonomy and safety.
  • In March 2021, SKF India introduced three new automotive aftermarket items to meet customers’ evolving needs for performance and value. These include chain and sprockets, steering and suspension systems, and timing belts.

Automotive Bearing and Clutch Component Aftermarket Research Scope

Attribute Details
Base Market Value (2023) US$ 5,677.7 million
Projected Market Size (2033) US$ 9,145.2 million
Anticipated Growth Rate (2023 to 2033) 4.9% CAGR
Historical Data 2018 to 2022
Forecast Period 2023 to 2033
Quantitative Units Value (US$ Million) and Volume (Units)
Report Coverage Revenue Forecast, Volume Forecast, Company Ranking, Competitive Landscape, Growth Factors, Trends, and Pricing Analysis
Market Segments Covered
  • Product Type
  • Vehicle Type
  • Sales Channel
  • Region
Regions Covered
  • North America
  • Latin America
  • Western Europe
  • Eastern Europe
  • East Asia
  • South Asia & Pacific
  • Middle East & Africa
Key Countries Covered
  • United States
  • Canada
  • Mexico
  • Brazil
  • Chile
  • Germany
  • Italy
  • France
  • United Kingdom
  • Spain
  • BENELUX
  • Nordics
  • Russia
  • Poland
  • Hungary
  • Czech Republic
  • China
  • Japan
  • South Korea
  • India
  • ASEAN
  • Australia and New Zealand
  • Kingdom of Saudi Arabia
  • Other GCC
  • Turkiye
  • Israel
  • South Africa
  • Other African Unions
Key Companies Profiled
  • The Timken Company
  • SKF
  • NSK Ltd.
  • NTN Corporation
  • Schaeffler Group
  • Koyo Bearings
  • BorgWarner Inc.
  • Valeo
  • Bosch
  • Eaton Corporation Plc
  • Nachi-Fujikoshi
  • ZF Friedrichshafen AG
  • Magneti Marelli S.p.A.
  • AISIN
  • EXEDY
  • Aptiv
  • Minebea Mitsumi Inc.

Automotive Bearing and Clutch Component Aftermarket Segmentation

By Product Type:

  • Wheel Bearing
    • Front Wheel Bearings
    • Rear Wheel Bearings
  • Clutch Actuators
    • Hydraulic
    • Electromagnetic
    • Pneumatic
  • Clutch Kit Components
    • Friction Plates
    • Pressure Plates
    • Release Bearings
    • Others
  • Transmission Bearings
    • Input Shaft Bearings
    • Output Shaft Bearings
    • Main Shaft Bearings
    • Counter Shaft Bearings
    • Needle Shaft Bearings
  • Differential Bearings

By Vehicle Type:

  • Vans
  • Minivans
  • Pickup Trucks
  • Trucks
  • Busses
  • Three-wheelers
  • Other

By Sales Channel:

  • Authorized Dealerships
  • Automotive Parts Retailers
  • Online Retail
  • Auto Repair Shops
  • Distributors and Wholesalers

By Region:

  • North America
  • Latin America
  • Western Europe
  • Eastern Europe
  • East Asia
  • South Asia & Pacific
  • Middle East & Africa

Frequently Asked Questions

How big is the automotive bearing and clutch component aftermarket?

The global market value totaled US$ 5,677.7 million in 2023.

What is the demand outlook for automotive bearing and clutch components?

Global demand is projected to rise at 4.9% CAGR through 2033.

What is the expected market size in 2033?

The automotive bearing and clutch component aftermarket is set to reach US$ 9,145.2 million in 2033.

Which product type segment is expected to lead the market?

The clutch kit components segment is expected to lead the market through 2033.

What bearings are used in a clutch?

Clutch release bearings and pilot bearings are used in clutch systems.

Table of Content

1. Executive Summary

    1.1. Global Market Outlook

    1.2. Demand Side Trends

    1.3. Supply Side Trends

    1.4. Technology Roadmap

    1.5. Analysis and Recommendations

2. Market Overview

    2.1. Market Coverage / Taxonomy

    2.2. Market Definition / Scope / Limitations

3. Key Market Trends

    3.1. Key Trends Impacting the Market

    3.2. Product Innovation / Development Trends

4. Key Success Factors

    4.1. Product Adoption / Usage Analysis

    4.2. Product USP’s / Features

    4.3. Strategic Promotional Strategies

5. Global Aftermarket Demand Analysis 2018 to 2022 and Forecast, 2023 to 2033

    5.1. Historical Market Volume ('000 Units) Analysis, 2018 to 2022

    5.2. Current and Future Market Volume ('000 Units) Projections, 2023 to 2033

    5.3. Y-o-Y Growth Trend Analysis

6. Global Aftermarket - Pricing Analysis

    6.1. Regional Pricing Analysis By Product Type

    6.2. Global Average Pricing Analysis Benchmark

7. Global Aftermarket Demand (in Value or Size in US$ Million) Analysis 2018 to 2022 and Forecast, 2023 to 2033

    7.1. Historical Market Value (US$ Million) Analysis, 2018 to 2022

    7.2. Current and Future Market Value (US$ Million) Projections, 2023 to 2033

        7.2.1. Y-o-Y Growth Trend Analysis

        7.2.2. Absolute $ Opportunity Analysis

8. Market Background

    8.1. Macro-Economic Factors

        8.1.1. Global GDP Growth Outlook

        8.1.2. Global Automobile industry Overview

        8.1.3. Manufacturing Value-Added

        8.1.4. Industry Value Added

        8.1.5. Parent Market Outlook

        8.1.6. Other Macro-Economic Factors

    8.2. Forecast Factors - Relevance & Impact

        8.2.1. Top Companies Historical Growth

        8.2.2. GDP Growth forecast

        8.2.3. Manufacturing Industry forecast

        8.2.4. Global Urbanization Growth Outlook

        8.2.5. Business Climate

        8.2.6. Covid-19 Impact Assessment

        8.2.7. End-use Industry Growth Outlook

    8.3. Value Chain

        8.3.1. Product Manufacturers

        8.3.2. End Users

        8.3.3. Avg. Profitability Margins

    8.4. COVID-19 Crisis – Impact Assessment

        8.4.1. Current Statistics

        8.4.2. Short-Mid-Long Term Outlook

        8.4.3. Likely Rebound

    8.5. Market Dynamics

        8.5.1. Drivers

        8.5.2. Restraints

        8.5.3. Opportunity Analysis

9. Global Aftermarket Analysis 2018 to 2022 and Forecast 2023 to 2033, By Product Type

    9.1. Introduction / Key Findings

    9.2. Historical Market Size (US$ Million) and Volume Analysis By Product Type, 2018 to 2022

    9.3. Current and Future Market Size (US$ Million) and Volume Analysis and Forecast By Product Type, 2023 to 2033

        9.3.1. Wheel Bearing

            9.3.1.1. Front Wheel Bearings

            9.3.1.2. Rear Wheel Bearings

        9.3.2. Clutch Actuators

            9.3.2.1. Hydraulic

            9.3.2.2. Electromagnetic

            9.3.2.3. Pneumatic

        9.3.3. Clutch Kit Components

            9.3.3.1. Friction Plates

            9.3.3.2. Pressure Plates

            9.3.3.3. Release Bearings

            9.3.3.4. Others

        9.3.4. Differential Bearings

        9.3.5. Transmission Bearings

            9.3.5.1. Input Shaft Bearings

            9.3.5.2. Output Shaft Bearings

            9.3.5.3. Main Shaft Bearings

            9.3.5.4. Counter Shaft Bearings

            9.3.5.5. Needle Roller Bearings

    9.4. Market Attractiveness Analysis By Product Type

10. Global Aftermarket Analysis 2018 to 2022 and Forecast 2023 to 2033, By Vehicle Type

    10.1. Introduction / Key Findings

    10.2. Historical Market Size (US$ Million) and Volume Analysis By Vehicle Type, 2018 to 2022

    10.3. Current and Future Market Size (US$ Million) and Volume Analysis and Forecast By Vehicle Type, 2023 to 2033

        10.3.1. Vans

        10.3.2. Minivans

        10.3.3. Pickup Trucks

        10.3.4. Trucks

        10.3.5. Busses

        10.3.6. Three-wheelers

        10.3.7. Others

    10.4. Market Attractiveness Analysis By Vehicle Type

11. Global Aftermarket Analysis 2018 to 2022 and Forecast 2023 to 2033, By Sales Channel

    11.1. Introduction / Key Findings

    11.2. Historical Market Size (US$ Million) and Volume Analysis By Sales Channel, 2018 to 2022

    11.3. Current and Future Market Size (US$ Million) and Volume Analysis and Forecast By Sales Channel, 2023 to 2033

        11.3.1. Authorized Dealerships

        11.3.2. Automotive Parts Retailers

        11.3.3. Online Retail

        11.3.4. Auto Repair Shops

        11.3.5. Distributors and Wholesalers

    11.4. Market Attractiveness Analysis By Sales Channel

12. Global Aftermarket Analysis 2018 to 2022 and Forecast 2023 to 2033, by Region

    12.1. Introduction

    12.2. Historical Market Size (US$ Million) and Volume Analysis By Region, 2018 to 2022

    12.3. Current Market Size (US$ Million) and Volume Analysis and Forecast By Region, 2023 to 2033

        12.3.1. North America

        12.3.2. Latin America

        12.3.3. Western Europe

        12.3.4. Eastern Europe

        12.3.5. Middle East and Africa

        12.3.6. East Asia

        12.3.7. South Asia and Pacific

    12.4. Market Attractiveness Analysis By Region

13. North America Aftermarket Analysis 2018 to 2022 and Forecast 2023 to 2033

    13.1. Introduction

    13.2. Pricing Analysis

    13.3. Historical Market Size (US$ Million) and Volume Trend Analysis By Market Taxonomy, 2018 to 2022

    13.4. Market Size (US$ Million) and Volume Forecast By Market Taxonomy, 2023 to 2033

        13.4.1. By Country

            13.4.1.1. United States

            13.4.1.2. Canada

            13.4.1.3. Mexico

        13.4.2. By Product Type

        13.4.3. By Vehicle Type

        13.4.4. By Sales Channel

    13.5. Market Attractiveness Analysis

        13.5.1. By Country

        13.5.2. By Product Type

        13.5.3. By Vehicle Type

        13.5.4. By Sales Channel

14. Latin America Aftermarket Analysis 2018 to 2022 and Forecast 2023 to 2033

    14.1. Introduction

    14.2. Pricing Analysis

    14.3. Historical Market Size (US$ Million) and Volume Trend Analysis By Market Taxonomy, 2018 to 2022

    14.4. Market Size (US$ Million) and Volume Forecast By Market Taxonomy, 2023 to 2033

        14.4.1. By Country

            14.4.1.1. Brazil

            14.4.1.2. Chile

            14.4.1.3. Rest of Latin America

        14.4.2. By Product Type

        14.4.3. By Vehicle Type

        14.4.4. By Sales Channel

    14.5. Market Attractiveness Analysis

        14.5.1. By Country

        14.5.2. By Product Type

        14.5.3. By Vehicle Type

        14.5.4. By Sales Channel

15. Western Europe Aftermarket Analysis 2018 to 2022 and Forecast 2023 to 2033

    15.1. Introduction

    15.2. Pricing Analysis

    15.3. Historical Market Size (US$ Million) and Volume Trend Analysis By Market Taxonomy, 2018 to 2022

    15.4. Market Size (US$ Million) and Volume Forecast By Market Taxonomy, 2023 to 2033

        15.4.1. By Country

            15.4.1.1. Germany

            15.4.1.2. Italy

            15.4.1.3. France

            15.4.1.4. United Kingdom

            15.4.1.5. Spain

            15.4.1.6. BENELUX

            15.4.1.7. NORDICS

            15.4.1.8. Rest of Western Europe

        15.4.2. By Product Type

        15.4.3. By Vehicle Type

        15.4.4. By Sales Channel

    15.5. Market Attractiveness Analysis

        15.5.1. By Country

        15.5.2. By Product Type

        15.5.3. By Vehicle Type

        15.5.4. By Sales Channel

16. Eastern Europe Aftermarket Analysis 2018 to 2022 and Forecast 2023 to 2033

    16.1. Introduction

    16.2. Pricing Analysis

    16.3. Historical Market Size (US$ Million) and Volume Trend Analysis By Market Taxonomy, 2018 to 2022

    16.4. Market Size (US$ Million) and Volume Forecast By Market Taxonomy, 2023 to 2033

        16.4.1. By Country

            16.4.1.1. Russia

            16.4.1.2. Poland

            16.4.1.3. Hungary

            16.4.1.4. Romania

            16.4.1.5. Rest of Eastern Europe

        16.4.2. By Product Type

        16.4.3. By Vehicle Type

        16.4.4. By Sales Channel

    16.5. Market Attractiveness Analysis

        16.5.1. By Country

        16.5.2. By Product Type

        16.5.3. By Vehicle Type

        16.5.4. By Sales Channel

17. South Asia and Pacific Aftermarket Analysis 2018 to 2022 and Forecast 2023 to 2033

    17.1. Introduction

    17.2. Pricing Analysis

    17.3. Historical Market Size (US$ Million) and Volume Trend Analysis By Market Taxonomy, 2018 to 2022

    17.4. Market Size (US$ Million) and Volume Forecast By Market Taxonomy, 2023 to 2033

        17.4.1. By Country

            17.4.1.1. India

            17.4.1.2. ASEAN

            17.4.1.3. ANZ

            17.4.1.4. Rest of South Asia & Pacific

        17.4.2. By Product Type

        17.4.3. By Vehicle Type

        17.4.4. By Sales Channel

    17.5. Market Attractiveness Analysis

        17.5.1. By Country

        17.5.2. By Product Type

        17.5.3. By Vehicle Type

        17.5.4. By Sales Channel

18. East Asia Aftermarket Analysis 2018 to 2022 and Forecast 2023 to 2033

    18.1. Introduction

    18.2. Pricing Analysis

    18.3. Historical Market Size (US$ Million) and Volume Trend Analysis By Market Taxonomy, 2018 to 2022

    18.4. Market Size (US$ Million) and Volume Forecast By Market Taxonomy, 2023 to 2033

        18.4.1. By Country

            18.4.1.1. China

            18.4.1.2. Japan

            18.4.1.3. South Korea

        18.4.2. By Product Type

        18.4.3. By Vehicle Type

        18.4.4. By Sales Channel

    18.5. Market Attractiveness Analysis

        18.5.1. By Country

        18.5.2. By Product Type

        18.5.3. By Vehicle Type

        18.5.4. By Sales Channel

19. Middle East and Africa Aftermarket Analysis 2018 to 2022 and Forecast 2023 to 2033

    19.1. Introduction

    19.2. Pricing Analysis

    19.3. Historical Market Size (US$ Million) and Volume Trend Analysis By Market Taxonomy, 2018 to 2022

    19.4. Market Size (US$ Million) and Volume Forecast By Market Taxonomy, 2023 to 2033

        19.4.1. By Country

            19.4.1.1. GCC Countries

            19.4.1.2. Türkiye

            19.4.1.3. Northern Africa

            19.4.1.4. South Africa

            19.4.1.5. Israel

            19.4.1.6. Rest of Middle East and Africa

        19.4.2. By Product Type

        19.4.3. By Vehicle Type

        19.4.4. By Sales Channel

    19.5. Market Attractiveness Analysis

        19.5.1. By Country

        19.5.2. By Product Type

        19.5.3. By Vehicle Type

        19.5.4. By Sales Channel

20. Country-wise Aftermarket Analysis

    20.1. Introduction

        20.1.1. Market Value Proportion Analysis, By Key Countries

        20.1.2. Global Vs. Country Growth Comparison

    20.2. United States Aftermarket Analysis

        20.2.1. By Product Type

        20.2.2. By Vehicle Type

        20.2.3. By Sales Channel

    20.3. Canada Aftermarket Analysis

        20.3.1. By Product Type

        20.3.2. By Vehicle Type

        20.3.3. By Sales Channel

    20.4. Mexico Aftermarket Analysis

        20.4.1. By Product Type

        20.4.2. By Vehicle Type

        20.4.3. By Sales Channel

    20.5. Brazil Aftermarket Analysis

        20.5.1. By Product Type

        20.5.2. By Vehicle Type

        20.5.3. By Sales Channel

    20.6. Argentina Aftermarket Analysis

        20.6.1. By Product Type

        20.6.2. By Vehicle Type

        20.6.3. By Sales Channel

    20.7. Germany Aftermarket Analysis

        20.7.1. By Product Type

        20.7.2. By Vehicle Type

        20.7.3. By Sales Channel

    20.8. Italy Aftermarket Analysis

        20.8.1. By Product Type

        20.8.2. By Vehicle Type

        20.8.3. By Sales Channel

    20.9. France Aftermarket Analysis

        20.9.1. By Product Type

        20.9.2. By Vehicle Type

        20.9.3. By Sales Channel

    20.10. United Kingdom Aftermarket Analysis

        20.10.1. By Product Type

        20.10.2. By Vehicle Type

        20.10.3. By Sales Channel

    20.11. Spain Aftermarket Analysis

        20.11.1. By Product Type

        20.11.2. By Vehicle Type

        20.11.3. By Sales Channel

    20.12. NORDICS Aftermarket Analysis

        20.12.1. By Product Type

        20.12.2. By Vehicle Type

        20.12.3. By Sales Channel

    20.13. Poland Aftermarket Analysis

        20.13.1. By Product Type

        20.13.2. By Vehicle Type

        20.13.3. By Sales Channel

    20.14. Hungary Aftermarket Analysis

        20.14.1. By Product Type

        20.14.2. By Vehicle Type

        20.14.3. By Sales Channel

    20.15. Romania Aftermarket Analysis

        20.15.1. By Product Type

        20.15.2. By Vehicle Type

        20.15.3. By Sales Channel

    20.16. Czech Republic Aftermarket Analysis

        20.16.1. By Product Type

        20.16.2. By Vehicle Type

        20.16.3. By Sales Channel

    20.17. China Aftermarket Analysis

        20.17.1. By Product Type

        20.17.2. By Vehicle Type

        20.17.3. By Sales Channel

    20.18. Japan Aftermarket Analysis

        20.18.1. By Product Type

        20.18.2. By Vehicle Type

        20.18.3. By Sales Channel

    20.19. South Korea Aftermarket Analysis

        20.19.1. By Product Type

        20.19.2. By Vehicle Type

        20.19.3. By Sales Channel

    20.20. India Aftermarket Analysis

        20.20.1. By Product Type

        20.20.2. By Vehicle Type

        20.20.3. By Sales Channel

    20.21. ASEAN Aftermarket Analysis

        20.21.1. By Product Type

        20.21.2. By Vehicle Type

        20.21.3. By Sales Channel

    20.22. Australia and New Zealand Aftermarket Analysis

        20.22.1. By Product Type

        20.22.2. By Vehicle Type

        20.22.3. By Sales Channel

    20.23. Kingdom of Saudi Arabia Aftermarket Analysis

        20.23.1. By Product Type

        20.23.2. By Vehicle Type

        20.23.3. By Sales Channel

    20.24. United Arab Emirates Aftermarket Analysis

        20.24.1. By Product Type

        20.24.2. By Vehicle Type

        20.24.3. By Sales Channel

    20.25. Northern Africa Aftermarket Analysis

        20.25.1. By Product Type

        20.25.2. By Vehicle Type

        20.25.3. By Sales Channel

    20.26. Türkiye Aftermarket Analysis

        20.26.1. By Product Type

        20.26.2. By Vehicle Type

        20.26.3. By Sales Channel

    20.27. South Africa Aftermarket Analysis

        20.27.1. By Product Type

        20.27.2. By Vehicle Type

        20.27.3. By Sales Channel

    20.28. Israel Aftermarket Analysis

        20.28.1. By Product Type

        20.28.2. By Vehicle Type

        20.28.3. By Sales Channel

21. Market Structure Analysis

    21.1. Market Analysis by Tier of Companies

    21.2. Market Share Analysis of Top Players

    21.3. Market Presence Analysis

22. Competition Analysis

    22.1. Competition Dashboard

    22.2. Competition Benchmarking

    22.3. Competition Deep Dive

        22.3.1. The Timken Company

            22.3.1.1. Overview

            22.3.1.2. Product Portfolio

            22.3.1.3. Profitability by Market Segments (Product Type/Vehicle Type/Sales Channel/Region)

            22.3.1.4. Sales Footprint

            22.3.1.5. Strategy Overview

        22.3.2. SKF

        22.3.3. NSK Ltd.

        22.3.4. NTN Corporation

        22.3.5. Schaeffler Group

        22.3.6. Koyo Bearings

        22.3.7. BorgWarner Inc.

        22.3.8. Valeo

        22.3.9. Bosch

        22.3.10. Eaton Corporation Plc

        22.3.11. Nachi-Fujikoshi

        22.3.12. ZF Friedrichshafen AG

        22.3.13. Magneti Marelli S.p.A.

        22.3.14. AISIN

        22.3.15. EXEDY

        22.3.16. Aptiv

        22.3.17. Minebea Mitsumi Inc.

23. Assumptions and Acronyms Used

24. Research Methodology

List of Tables

Table 01: Global Aftermarket Volume ('000 Units) Historical Data 2018 to 2022 and Forecast 2023 to 2033 by Product Type

Table 02: Global Aftermarket Volume ('000 Units) Historical Data 2018 to 2022 and Forecast 2023 to 2033 by Product Type

Table 03: Global Aftermarket Value (US$ Million) Historical Data 2018 to 2022 and Forecast 2023 to 2033 by Product Type

Table 04: Global Aftermarket Value (US$ Million) Historical Data 2018 to 2022 and Forecast 2023 to 2033 by Product Type

Table 05: Global Aftermarket Volume ('000 Units) Historical Data 2018 to 2022 and Forecast 2023 to 2033 by Vehicle Type

Table 06: Global Aftermarket Value (US$ Million) Historical Data 2018 to 2022 and Forecast 2023 to 2033 by Vehicle Type

Table 07: Global Aftermarket Volume ('000 Units) & Value (US$ Million) Historical Data 2018 to 2022 and Forecast 2023 to 2033 by Sales Channel

Table 08: Global Aftermarket Volume ('000 Units) Historical Data 2018 to 2022 and Forecast 2023 to 2033 by Region

Table 09: Global Aftermarket Value (US$ Million) Historical Data 2018 to 2022 and Forecast 2023 to 2033 by Region

Table 10: North America Aftermarket Size (US$ Million) and Volume ('000 Units) Forecast by Country, 2018 to 2033

Table 11: North America Aftermarket Volume ('000 Units) Historical Data 2018 to 2022 and Forecast 2023 to 2033 by Product Type

Table 12: North America Aftermarket Volume ('000 Units) Historical Data 2018 to 2022 and Forecast 2023 to 2033 by Product Type

Table 13: North America Aftermarket Value (US$ Million) Historical Data 2018 to 2022 and Forecast 2023 to 2033 by Product Type

Table 14: North America Aftermarket Value (US$ Million) Historical Data 2018 to 2022 and Forecast 2023 to 2033 by Product Type

Table 15: North America Aftermarket Volume ('000 Units) Historical Data 2018 to 2022 and Forecast 2023 to 2033 by Vehicle Type

Table 16: North America Aftermarket Value (US$ Million) Historical Data 2018 to 2022 and Forecast 2023 to 2033 by Vehicle Type

Table 17: North America Aftermarket Volume ('000 Units) & Value (US$ Million) Historical Data 2018 to 2022 and Forecast 2023 to 2033 by Sales Channel

Table 18: Latin America Aftermarket Size (US$ Million) and Volume ('000 Units) Forecast by Country, 2018 to 2033

Table 19: Latin America Aftermarket Volume ('000 Units) Historical Data 2018 to 2022 and Forecast 2023 to 2033 by Product Type

Table 20: Latin America Aftermarket Volume ('000 Units) Historical Data 2018 to 2022 and Forecast 2023 to 2033 by Product Type

Table 21: Latin America Aftermarket Value (US$ Million) Historical Data 2018 to 2022 and Forecast 2023 to 2033 by Product Type

Table 22: Latin America Aftermarket Value (US$ Million) Historical Data 2018 to 2022 and Forecast 2023 to 2033 by Product Type

Table 23: Latin America Aftermarket Volume ('000 Units) Historical Data 2018 to 2022 and Forecast 2023 to 2033 by Vehicle Type

Table 24: Latin America Aftermarket Value (US$ Million) Historical Data 2018 to 2022 and Forecast 2023 to 2033 by Vehicle Type

Table 25: Latin America Aftermarket Volume ('000 Units) & Value (US$ Million) Historical Data 2018 to 2022 and Forecast 2023 to 2033 by Sales Channel

Table 26: Western Europe Aftermarket Size (US$ Million) and Volume ('000 Units) Forecast by Country, 2018 to 2033

Table 27: Western Europe Aftermarket Volume ('000 Units) Historical Data 2018 to 2022 and Forecast 2023 to 2033 by Product Type

Table 28: Western Europe Aftermarket Volume ('000 Units) Historical Data 2018 to 2022 and Forecast 2023 to 2033 by Product Type

Table 29: Western Europe Aftermarket Value (US$ Million) Historical Data 2018 to 2022 and Forecast 2023 to 2033 by Product Type

Table 30: Western Europe Aftermarket Value (US$ Million) Historical Data 2018 to 2022 and Forecast 2023 to 2033 by Product Type

Table 31: Western Europe Aftermarket Volume ('000 Units) Historical Data 2018 to 2022 and Forecast 2023 to 2033 by Vehicle Type

Table 32: Western Europe Aftermarket Value (US$ Million) Historical Data 2018 to 2022 and Forecast 2023 to 2033 by Vehicle Type

Table 33: Western Europe Aftermarket Volume ('000 Units) & Value (US$ Million) Historical Data 2018 to 2022 and Forecast 2023 to 2033 by Sales Channel

Table 34: Eastern Europe Aftermarket Size (US$ Million) and Volume ('000 Units) Forecast by Country, 2018 to 2033

Table 35: Eastern Europe Aftermarket Volume ('000 Units) Historical Data 2018 to 2022 and Forecast 2023 to 2033 by Product Type

Table 36: Eastern Europe Aftermarket Volume ('000 Units) Historical Data 2018 to 2022 and Forecast 2023 to 2033 by Product Type

Table 37: Eastern Europe Aftermarket Value (US$ Million) Historical Data 2018 to 2022 and Forecast 2023 to 2033 by Product Type

Table 38: Eastern Europe Aftermarket Value (US$ Million) Historical Data 2018 to 2022 and Forecast 2023 to 2033 by Product Type

Table 39: Eastern Europe Aftermarket Volume ('000 Units) Historical Data 2018 to 2022 and Forecast 2023 to 2033 by Vehicle Type

Table 40: Eastern Europe Aftermarket Value (US$ Million) Historical Data 2018 to 2022 and Forecast 2023 to 2033 by Vehicle Type

Table 41: Eastern Europe Aftermarket Volume ('000 Units) & Value (US$ Million) Historical Data 2018 to 2022 and Forecast 2023 to 2033 by Sales Channel

Table 42: East Asia Aftermarket Size (US$ Million) and Volume ('000 Units) Forecast by Country, 2018 to 2033

Table 43: East Asia Aftermarket Volume ('000 Units) Historical Data 2018 to 2022 and Forecast 2023 to 2033 by Product Type

Table 44: East Asia Aftermarket Volume ('000 Units) Historical Data 2018 to 2022 and Forecast 2023 to 2033 by Product Type

Table 45: East Asia Aftermarket Value (US$ Million) Historical Data 2018 to 2022 and Forecast 2023 to 2033 by Product Type

Table 46: East Asia Aftermarket Value (US$ Million) Historical Data 2018 to 2022 and Forecast 2023 to 2033 by Product Type

Table 47: East Asia Aftermarket Volume ('000 Units) Historical Data 2018 to 2022 and Forecast 2023 to 2033 by Vehicle Type

Table 48: East Asia Aftermarket Value (US$ Million) Historical Data 2018 to 2022 and Forecast 2023 to 2033 by Vehicle Type

Table 49: East Asia Aftermarket Volume ('000 Units) & Value (US$ Million) Historical Data 2018 to 2022 and Forecast 2023 to 2033 by Sales Channel

Table 50: South Asia Pacific Aftermarket Size (US$ Million) and Volume ('000 Units) Forecast by Country, 2018 to 2033

Table 51: South Asia & Pacific Aftermarket Volume ('000 Units) Historical Data 2018 to 2022 and Forecast 2023 to 2033 by Product Type

Table 52: South Asia & Pacific Aftermarket Volume ('000 Units) Historical Data 2018 to 2022 and Forecast 2023 to 2033 by Product Type

Table 53: South Asia & Pacific Aftermarket Value (US$ Million) Historical Data 2018 to 2022 and Forecast 2023 to 2033 by Product Type

Table 54: South Asia & Pacific Aftermarket Value (US$ Million) Historical Data 2018 to 2022 and Forecast 2023 to 2033 by Product Type

Table 55: South Asia & Pacific Aftermarket Volume ('000 Units) Historical Data 2018 to 2022 and Forecast 2023 to 2033 by Vehicle Type

Table 56: South Asia & Pacific Aftermarket Value (US$ Million) Historical Data 2018 to 2022 and Forecast 2023 to 2033 by Vehicle Type

Table 57: South Asia & Pacific Aftermarket Volume ('000 Units) & Value (US$ Million) Historical Data 2018 to 2022 and Forecast 2023 to 2033 by Sales Channel

Table 58: Middle East & Africa Aftermarket Size (US$ Million) and Volume ('000 Units) Forecast by Country, 2018 to 2033

Table 59: Middle East & Africa Aftermarket Volume ('000 Units) Historical Data 2018 to 2022 and Forecast 2023 to 2033 by Product Type

Table 60: Middle East & Africa Aftermarket Volume ('000 Units) Historical Data 2018 to 2022 and Forecast 2023 to 2033 by Product Type

Table 61: Middle East & Africa Aftermarket Value (US$ Million) Historical Data 2018 to 2022 and Forecast 2023 to 2033 by Product Type

Table 62: Middle East & Africa Aftermarket Value (US$ Million) Historical Data 2018 to 2022 and Forecast 2023 to 2033 by Product Type

Table 63: Middle East & Africa Aftermarket Volume ('000 Units) Historical Data 2018 to 2022 and Forecast 2023 to 2033 by Vehicle Type

Table 64: Middle East & Africa Aftermarket Value (US$ Million) Historical Data 2018 to 2022 and Forecast 2023 to 2033 by Vehicle Type

Table 65: Middle East & Africa Aftermarket Volume ('000 Units) & Value (US$ Million) Historical Data 2018 to 2022 and Forecast 2023 to 2033 by Sales Channel

List of Charts

Figure 01: Global Aftermarket Historical Volume ('000 Units), 2018 to 2022

Figure 02: Global Aftermarket Market Volume ('000 Units) Forecast, 2023 to 2033

Figure 03: Global Aftermarket Historical Value (US$ Million), 2018 to 2022

Figure 04: Global Aftermarket Value (US$ Million) Forecast, 2023 to 2033

Figure 05: Global Aftermarket Absolute $ Opportunity, 2018 to 2023 and 2033

Figure 06: Global Aftermarket Share and BPS Analysis by Product Type- 2023 & 2033

Figure 07: Global Aftermarket Y-o-Y Growth by Product Type, 2023 to 2033

Figure 08: Global Aftermarket Attractiveness Analysis by Product Type, 2023 to 2033

Figure 09: Global Aftermarket Absolute $ Opportunity by Product Type Segment

Figure 10: Global Aftermarket Share and BPS Analysis by Vehicle Type- 2023 & 2033

Figure 11: Global Aftermarket Y-o-Y Growth by Vehicle Type, 2023 to 2033

Figure 12: Global Aftermarket Attractiveness Analysis by Vehicle Type, 2023 to 2033

Figure 13: Global Aftermarket Absolute $ Opportunity by Product Type Segment

Figure 14: Global Aftermarket Share and BPS Analysis by Sales Channel- 2023 & 2033

Figure 15: Global Aftermarket Y-o-Y Growth by Sales Channel, 2023 to 2033

Figure 16: Global Aftermarket Attractiveness Analysis by Sales Channel, 2023 to 2033

Figure 17: Global Aftermarket Absolute $ Opportunity by Sales Channel

Figure 18: Global Aftermarket Share and BPS Analysis by Region - 2023 & 2033

Figure 19: Global Aftermarket Y-o-Y Growth by Region, 2023 to 2033

Figure 20: Global Aftermarket Attractiveness Analysis by Region, 2023 to 2033

Figure 21: Global Aftermarket Absolute $ Opportunity by Region Segment

Figure 22: North America Aftermarket Share and BPS Analysis by Country, 2023 & 2033

Figure 23: North America Aftermarket Y-o-Y Growth by Country, 2023 to 2033

Figure 24: North America Aftermarket Attractiveness Analysis by Country, 2023 to 2033

Figure 25: North America Aftermarket Share and BPS Analysis by Product Type- 2023 & 2033

Figure 26: North America Aftermarket Y-o-Y Growth by Product Type, 2023 to 2033

Figure 27: North America Aftermarket Attractiveness Analysis by Product Type, 2023 to 2033

Figure 28: North America Aftermarket Share and BPS Analysis by Vehicle Type- 2023 & 2033

Figure 29: North America Aftermarket Y-o-Y Growth by Vehicle Type, 2023 to 2033

Figure 30: North America Aftermarket Attractiveness Analysis by Vehicle Type, 2023 to 2033

Figure 31: North America Aftermarket Share and BPS Analysis by Sales Channel- 2023 & 2033

Figure 32: North America Aftermarket Y-o-Y Growth by Sales Channel, 2023 to 2033

Figure 33: North America Aftermarket Attractiveness Analysis by Sales Channel, 2023 to 2033

Figure 34: Latin America Aftermarket Share and BPS Analysis by Country, 2023 & 2033

Figure 35: Latin America Aftermarket Y-o-Y Growth by Country, 2023 to 2033

Figure 36: Latin America Aftermarket Attractiveness Analysis by Country, 2023 to 2033

Figure 37: Latin America Aftermarket Share and BPS Analysis by Product Type- 2023 & 2033

Figure 38: Latin America Aftermarket Y-o-Y Growth by Product Type, 2023 to 2033

Figure 39: Latin America Aftermarket Attractiveness Analysis by Product Type, 2023 to 2033

Figure 40: Latin America Aftermarket Share and BPS Analysis by Vehicle Type- 2023 & 2033

Figure 41: Latin America Aftermarket Y-o-Y Growth by Vehicle Type, 2023 to 2033

Figure 42: Latin America Aftermarket Attractiveness Analysis by Vehicle Type, 2023 to 2033

Figure 43: Latin America Aftermarket Share and BPS Analysis by Sales Channel- 2023 & 2033

Figure 44: Latin America Aftermarket Y-o-Y Growth by Sales Channel, 2023 to 2033

Figure 45: Latin America Aftermarket Attractiveness Analysis by Sales Channel, 2023 to 2033

Figure 46: Western Europe Aftermarket Share and BPS Analysis by Country, 2023 & 2033

Figure 47: Western Europe Aftermarket Y-o-Y Growth by Country, 2023 to 2033

Figure 48: Western Europe Aftermarket Attractiveness Analysis by Country, 2023 to 2033

Figure 49: Western Europe Aftermarket Share and BPS Analysis by Product Type- 2023 & 2033

Figure 50: Western Europe Aftermarket Y-o-Y Growth by Product Type, 2023 to 2033

Figure 51: Western Europe Aftermarket Attractiveness Analysis by Product Type, 2023 to 2033

Figure 52: Western Europe Aftermarket Share and BPS Analysis by Vehicle Type- 2023 & 2033

Figure 53: Western Europe Aftermarket Y-o-Y Growth by Vehicle Type, 2023 to 2033

Figure 54: Western Europe Aftermarket Attractiveness Analysis by Vehicle Type, 2023 to 2033

Figure 55: Western Europe Aftermarket Share and BPS Analysis by Sales Channel- 2023 & 2033

Figure 56: Western Europe Aftermarket Y-o-Y Growth by Sales Channel, 2023 to 2033

Figure 57: Western Europe Aftermarket Attractiveness Analysis by Sales Channel, 2023 to 2033

Figure 58: Eastern Europe Aftermarket Share and BPS Analysis by Country, 2023 & 2033

Figure 59: Eastern Europe Aftermarket Y-o-Y Growth by Country, 2023 to 2033

Figure 60: Eastern Europe Aftermarket Attractiveness Analysis by Country, 2023 to 2033

Figure 61: Eastern Europe Aftermarket Share and BPS Analysis by Product Type- 2023 & 2033

Figure 62: Eastern Europe Aftermarket Y-o-Y Growth by Product Type, 2023 to 2033

Figure 63: Eastern Europe Aftermarket Attractiveness Analysis by Product Type, 2023 to 2033

Figure 64: Eastern Europe Aftermarket Share and BPS Analysis by Vehicle Type- 2023 & 2033

Figure 65: Eastern Europe Aftermarket Y-o-Y Growth by Vehicle Type, 2023 to 2033

Figure 66: Eastern Europe Aftermarket Attractiveness Analysis by Vehicle Type, 2023 to 2033

Figure 67: Eastern Europe Aftermarket Share and BPS Analysis by Sales Channel- 2023 & 2033

Figure 68: Eastern Europe Aftermarket Y-o-Y Growth by Sales Channel, 2023 to 2033

Figure 69: Eastern Europe Aftermarket Attractiveness Analysis by Sales Channel, 2023 to 2033

Figure 70: East Asia Aftermarket Share and BPS Analysis by Country, 2023 & 2033

Figure 71: East Asia Aftermarket Y-o-Y Growth by Country, 2023 to 2033

Figure 72: East Asia Aftermarket Attractiveness Analysis by Country, 2023 to 2033

Figure 73: East Asia Aftermarket Share and BPS Analysis by Product Type- 2023 & 2033

Figure 74: East Asia Aftermarket Y-o-Y Growth by Product Type, 2023 to 2033

Figure 75: East Asia Aftermarket Attractiveness Analysis by Product Type, 2023 to 2033

Figure 76: East Asia Aftermarket Share and BPS Analysis by Vehicle Type- 2023 & 2033

Figure 77: East Asia Aftermarket Y-o-Y Growth by Vehicle Type, 2023 to 2033

Figure 78: East Asia Aftermarket Attractiveness Analysis by Vehicle Type, 2023 to 2033

Figure 79: East Asia Aftermarket Share and BPS Analysis by Sales Channel- 2023 & 2033

Figure 80: East Asia Aftermarket Y-o-Y Growth by Sales Channel, 2023 to 2033

Figure 81: East Asia Aftermarket Attractiveness Analysis by Sales Channel, 2023 to 2033

Figure 82: South Asia Pacific Aftermarket Share and BPS Analysis by Country, 2023 & 2033

Figure 83: South Asia Pacific Aftermarket Y-o-Y Growth by Country, 2023 to 2033

Figure 84: South Asia Pacific Aftermarket Attractiveness Analysis by Country, 2023 to 2033

Figure 85: South Asia & Pacific Aftermarket Share and BPS Analysis by Product Type- 2023 & 2033

Figure 86: South Asia & Pacific Aftermarket Y-o-Y Growth by Product Type, 2023 to 2033

Figure 87: South Asia & Pacific Aftermarket Attractiveness Analysis by Product Type, 2023 to 2033

Figure 88: South Asia & Pacific Aftermarket Share and BPS Analysis by Vehicle Type- 2023 & 2033

Figure 89: South Asia & Pacific Aftermarket Y-o-Y Growth by Vehicle Type, 2023 to 2033

Figure 90: South Asia & Pacific Aftermarket Attractiveness Analysis by Vehicle Type, 2023 to 2033

Figure 91: South Asia & Pacific Aftermarket Share and BPS Analysis by Sales Channel- 2023 & 2033

Figure 92: South Asia & Pacific Aftermarket Y-o-Y Growth by Sales Channel, 2023 to 2033

Figure 93: South Asia & Pacific Aftermarket Attractiveness Analysis by Sales Channel, 2023 to 2033

Figure 94: Middle East & Africa Aftermarket Share and BPS Analysis by Country, 2023 & 2033

Figure 95: Middle East & Africa Aftermarket Y-o-Y Growth by Country, 2023 to 2033

Figure 96: Middle East & Africa Aftermarket Attractiveness Analysis by Country, 2023 to 2033

Figure 97: Middle East & Africa Aftermarket Share and BPS Analysis by Product Type- 2023 & 2033

Figure 98: Middle East & Africa Aftermarket Y-o-Y Growth by Product Type, 2023 to 2033

Figure 99: Middle East & Africa Aftermarket Attractiveness Analysis by Product Type, 2023 to 2033

Figure 100: Middle East & Africa Aftermarket Share and BPS Analysis by Vehicle Type- 2023 & 2033

Figure 101: Middle East & Africa Aftermarket Y-o-Y Growth by Vehicle Type, 2023 to 2033

Figure 102: Middle East & Africa Aftermarket Attractiveness Analysis by Vehicle Type, 2023 to 2033

Figure 103: Middle East & Africa Aftermarket Share and BPS Analysis by Sales Channel- 2023 & 2033

Figure 104: Middle East & Africa Aftermarket Y-o-Y Growth by Sales Channel, 2023 to 2033

Figure 105: Middle East & Africa Aftermarket Attractiveness Analysis by Sales Channel, 2023 to 2033

Recommendations

Automotive

Plain Bearing Market

Published : May 2023

Automotive

Railway Bearing Market

Published : March 2023

Automotive

Clutch Friction Plate Market

Published : March 2023

Explore Automotive Insights

View Reports

Automotive Bearing and Clutch Component Aftermarket