

- Market Size (2026)
- USD 2140.7 Mn
- Forecast (2036)
- USD 3797.7 Mn
- CAGR (2026 to 2036)
- 5.9%
How big is the Plastic Terminal Blocks Market in 2026?
USD 2,140.7 million in 2026 and USD 3,797.7 million by 2036 at a 5.9% CAGR.
Demand for plastic terminal blocks is projected to expand at 5.9% CAGR between 2026 and 2036. Valuation is estimated to increase from USD 2,140.7 million in 2026 to USD 3,797.7 million by 2036. Control-panel builders are using plastic housings to keep copper conductors separated inside compact cabinets. The Federal Reserve Board reported total industrial production at an index of 102.6 in May 2026. The factory rhythm is expected to support connector demand where insulation stability and wiring speed decide repeat orders.
Industry in China and India is projected to favor quick-assembly terminal blocks because local electronics output is moving into wider factory networks. United States and Germany accounts are expected to stress IEC files and UL ratings before they approve broader cabinet programs. Panel engineers examine clamp force and flame rating before a block enters a control design. Electrical distributors compare shelf depth and marking accessories before they extend branch coverage. China's National Bureau of Statistics reported industrial export delivery value of USD 212.4 billion in March 2026. The production signal keeps cabinet wiring close to factory automation projects. The implication is practical for low-voltage components because terminal choice is settled during drawing release.
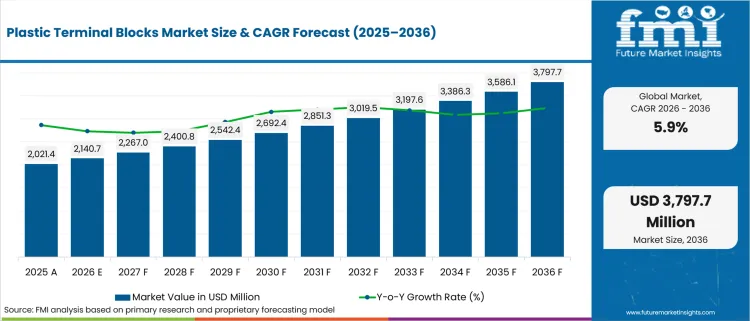
| Metric | Value |
|---|---|
| 2025 Market Size | USD 2,021.4 million |
| 2026 Market Size | USD 2,140.7 million |
| 2036 Market Size | USD 3,797.7 million |
| Forecast CAGR (2026-2036) | 5.9% |
| Current Rating Focus | Low Current |
| Low Current Share (2026) | 46.0% |
| End Use Focus | Industrial Controls |
| Industrial Controls Share (2026) | 44.3% |
| Sales Channel Focus | Direct OEM |
| Direct OEM Share (2026) | 41.1% |
Summary of the Plastic Terminal Blocks Market
| Market Signal | Commercial Impact |
|---|---|
| Demand and Growth Drivers | Growth is expected to be driven by control-panel densification and faster wiring work. Product proof is projected to carry more weight where cabinet space and service time are under pressure.
|
| Product and Segment View | Low current is estimated to lead current rating in 2026. Industrial controls and direct OEM routes are projected to carry the clearest approval logic.
|
| Geography and Growth Outlook | India and China are projected to expand faster than the United States and Germany because electronics assembly is spreading across more plants. Developed accounts are expected to grow more steadily under formal approval routines.
|
| Competitive Landscape | Competition is expected to center on connection technology, certification support and stocking reach. Terminal block specialists and connector groups are projected to compete for the same control-cabinet drawings.
|
| Analyst Perspective | Terminal block selection is decided at the drawing table before a control cabinet reaches the shop floor. A small housing change often forces new approvals across markers, jumpers and conductor rules.
|
Source: FMI's proprietary forecasting model and primary research
How is the plastic terminal blocks market segmented?
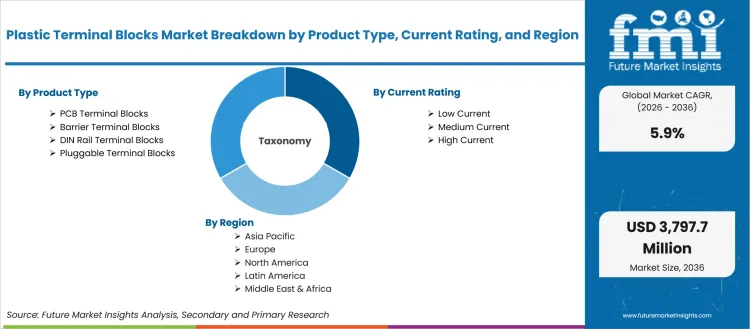
The plastic terminal blocks industry is segmented by product type, material, current rating, end use, sales channel, and region.
The plastic terminal blocks market is segmented by product type, material, current rating, end use and sales channel. Region is treated as coverage. Product type covers PCB terminal blocks and barrier terminal blocks. It also covers DIN rail terminal blocks and pluggable terminal blocks. Material covers PA or nylon and PBT. Polycarbonate and high-temperature thermoplastics complete the material scope. Current rating covers low current and medium current. High current completes the rating view. End use covers industrial controls and building automation. Power distribution and consumer electronics complete the end-use view. Sales channel covers electrical distributors and direct OEM. E-commerce catalog routes complete channel coverage. Regional coverage is linked to copper and aluminum terminal blocks.
How does low current shape demand within the current rating category?
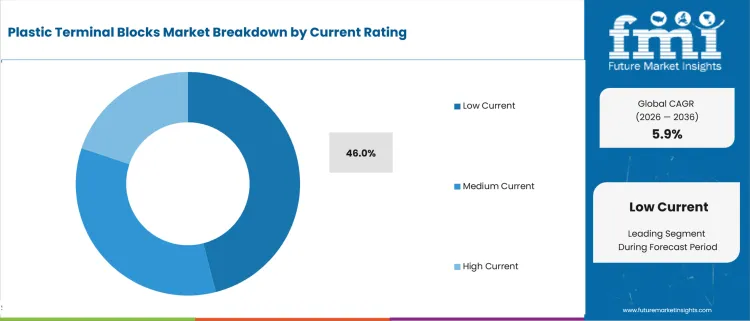
Low current blocks serve signal circuits and control wiring where a small housing still needs clear separation. At SPS 2025, TE Connectivity listed PCB terminal block headers and plugs with 2.5 mm pitch and 4 A maximum current. The same event page named 3.5 mm and 3.81 mm options at 8 A. Small ratings keep low current blocks tied to board-mounted devices that need clear markings and safe service access.
- Based on current rating, low current is projected to account for 46.0% in 2026 due to dense signal wiring in PLC panels. The segment fits devices that route sensor signals and relay wiring through narrow housings. OEM engineers are expected to test plastic grade and conductor range before a terminal family moves into repeated builds.
- Low current is drawing demand from OEM engineers owing to thinner cabinets and more field signals. Device makers using wire-to-board connector programs are expected to favor blocks that match PCB layouts without adding assembly steps. The route suits compact controls where service crews must identify conductors quickly after installation.
What supports demand for industrial controls within the end use category?
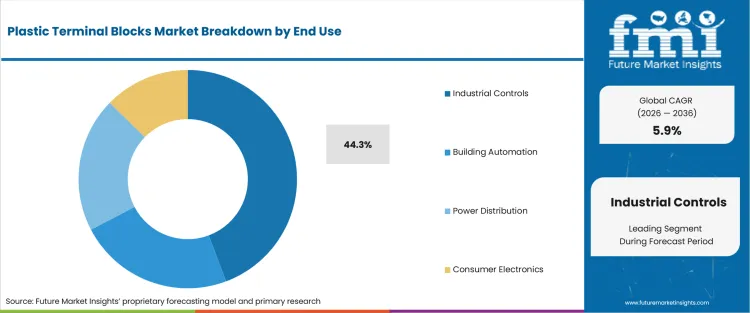
Industrial controls place terminal blocks beside relays and motor circuits inside cabinets. WAGO's control signal terminal strip page lists a DIN VDE 4100:2025-05 version under the TOPJOB S family. The product record links rail-mount terminal blocks to modern building installations and industrial applications. The connection helps panel teams combine control wiring and distribution needs within one product family.
- By end use, industrial controls are estimated to hold 44.3% in 2026 owing to high wiring counts in automation panels. Cabinet builders use terminal strips to separate power circuits from control wiring. The segment is expected to stay visible because automation projects still need inspectable conductor paths after sensors and drives are installed.
- Demand for industrial controls is expected to grow among automation integrators attributable to retrofit work and documented ratings. Projects tied to substation automation need terminals that remain easy to mark during maintenance. Panel teams also prefer plastic housings that keep wire identification readable after repeated access.
How do OEM engineers evaluate direct OEM routes within the sales channel category?
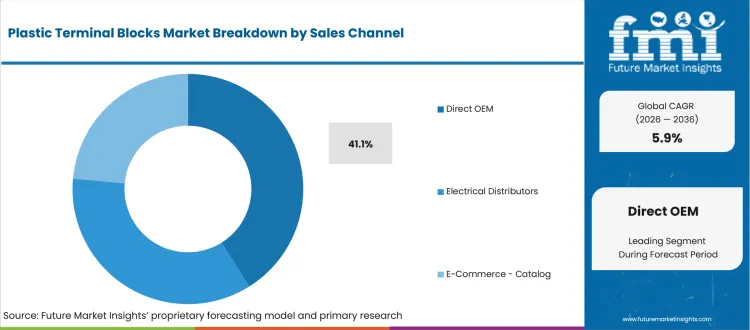
Direct OEM routes fit terminal blocks that enter drawings before a cabinet goes into serial production. Weidmüller's 2025 technical catalogue page lists Klippon Connect terminal block volumes and a SNAP IN or PUSH IN catalogue extract. The catalogue record gives engineers a current source for product families before they freeze panel drawings. OEM accounts use that evidence to reduce handoffs between design teams and purchasing staff.
- In 2026, direct OEM is expected to lead sales channel with 41.1% share because approved drawings control terminal choices. The route fits accounts that need one supplier response for samples and certificates. It also supports repeat orders where product teams value direct contact after marker or jumper changes.
- OEM engineers are expected to choose direct OEM routes when drawing control reduces distributor handoffs. TE Connectivity launched an inside-device connectivity portfolio in October 2025 that covered wire-to-board and board-to-board connector technologies. Connector groups serving automotive data connectors are anticipated to package terminal blocks with broader wiring support.
What drives electrical distributors within the sales channel category?
Electrical distributors remain central when maintenance teams need the same terminal series after the original panel build. Schneider Electric updated a Harmony contact block FAQ in February 2025. The answer identified compact push-in and push-pull spring terminal options. Distributor branches use that product clarity to reduce ordering mistakes when electricians replace blocks during service work.
- By sales channel, electrical distributors are forecast to represent 38.9% in 2026 driven by replacement demand and accessory stocking. Branches handle terminal blocks beside markers and jumpers. The channel is expected to protect repeat sales where maintenance staff ask for the same part family after cabinet faults.
- Purchase activity for electrical distributors is anticipated to rise driven by MRO teams that need terminals and related protection items. Branches selling surge protection devices already serve electricians that install terminal blocks inside the same cabinets. The channel route helps vendors stay visible after the original OEM drawing is complete.
How is PCB terminal blocks positioned within the product type category?
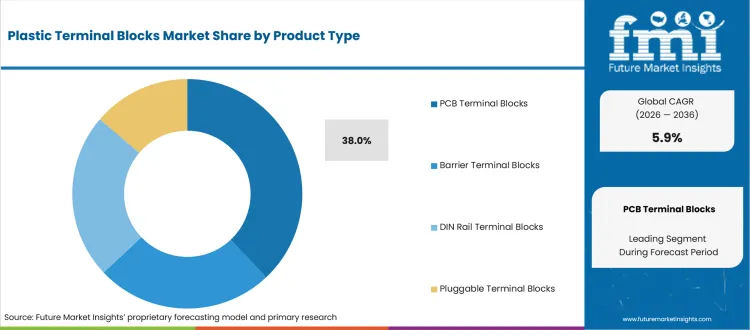
PCB terminal blocks connect board-mounted electronics to field wiring inside drives and control modules. Dinkle presented PCB terminal blocks at Hannover Messe in March 2025. The company described PID push-in designs and site-configuration options for control panels. The source fits this segment because PCB blocks must combine solder-side stability with field wiring access.
- PCB terminal blocks are projected to lead product type with 38.0% share in 2026 due to board-level connection needs. The format gives device developers a serviceable handoff from circuitry to field wiring. Demand is expected to hold where small drives and sensor modules need removable conductors without a separate harness.
- Sales of PCB terminal blocks are forecast to gain traction in compact device assemblies reinforced by tool-light wiring and board access. Product developers are expected to compare pitch and conductor range before adopting a terminal family. Design teams still need low-voltage board access for controls and diagnostics after the power circuit is fixed.
What are the drivers, restraints, and opportunities in the plastic terminal blocks market?
Near-term purchases are projected to be shaped by cabinet densification, certification checks and retrofit wiring needs outlined below.
- Driver: control-panel densification is expected to raise demand for compact plastic housings with stable conductor separation.
- Restraint: approval work is projected to slow switching where IEC files, flame ratings and accessory compatibility remain incomplete.
- Opportunity: retrofit projects are anticipated to open distributor demand for marked blocks and tool-light wiring formats.
Control-panel teams are expected to raise interest in blocks that shorten wiring work without weakening connection proof. Phoenix Contact launched XT terminal blocks with Push-X and a Combi plug-in zone in June 2025. The products covered conductor cross-sections from 0.5 to 4 mm². The conductor range helps engineers serve common control wiring without changing the terminal family.
Standards offices keep the restraint close to everyday product selection. ETICS activated EN IEC 60947-7-1:2025 in July 2025 for terminal blocks used with copper conductors. The standard environment is expected to keep test records central during vendor review. Products without clear files receive a slower path into OEM drawings and distributor listings.
Retrofit demand is forecast to turn approval pressure into a service opening for brands that simplify panel rewiring. TE Connectivity reported in January 2026 that it took part in the completed Next2OEM project for automated wiring harness production. The project connects wiring labor to component selection in modular electrical systems. Maintenance teams buying power quality equipment are expected to value terminal blocks that keep fault checks clear.
Which country CAGRs are profiled in the plastic terminal blocks market?
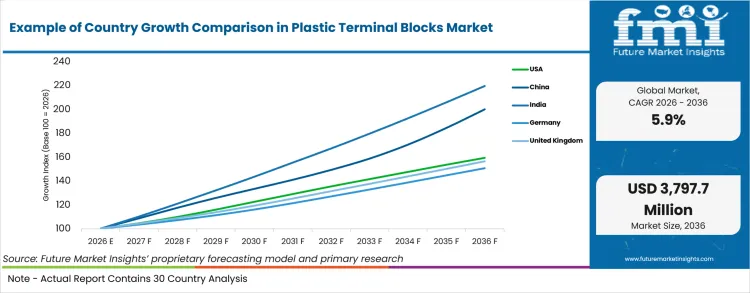
| Country | CAGR |
|---|---|
| United States | 4.78% |
| China | 7.18% |
| India | 8.18% |
| Germany | 4.18% |
| United Kingdom | 4.58% |
| Japan | 3.98% |
| South Korea | 5.38% |
Source: FMI's proprietary forecasting model and primary research
How do country-level CAGRs compare in the plastic terminal blocks market?
Country expansion is expected to split between electronics build-out and replacement-led cabinet work. India and China are projected to show wider gains because electronics assembly and electrical machinery output are spreading through more factories. The United States and Germany are anticipated to move more steadily under approved supplier lists and standards review. Japan and the United Kingdom are estimated to grow through selective automation renewal. South Korea is forecast to benefit from machinery investment and compact production networks.
- USA panel builders are working inside a factory base that still needs replacement wiring despite cautious output. Plastic terminal block demand in United States is forecast to rise at 4.78% CAGR over the forecast period due to control-cabinet renewal. The Federal Reserve Board reported manufacturing capacity use of 75.7% in May 2026. The utilization level keeps MRO teams active without forcing quick supplier changes. Phoenix Contact and WAGO compete for these accounts through terminal families that include accessories and marking systems.
- Chinese electrical equipment factories keep terminal blocks close to automation and export cabinet work. China's plastic terminal blocks outlook is anticipated to advance at 7.18% CAGR over the assessment period, shaped by active electrical machinery output. Data from the National Bureau of Statistics showed electrical machinery and apparatus output up 5.4% in March 2026. The production base gives DEGSON and Dinkle a local route into cabinet wiring and PCB connections. The open question is whether local brands keep price discipline while improving test-file depth.
- India's electronics push is moving more assembly work toward local component sourcing and panel fabrication. Press Information Bureau reported electronics production of INR 11.3 lakh crore in fiscal 2024-25. Adoption of plastic terminal blocks in India is estimated to expand at 8.18% CAGR through 2036, due to wider electronics manufacturing. Havells and Larsen & Toubro channel partners shape electrician access beside global brands. Vendors that combine low-cost housings with clear certificates are expected to gain distributor trials.
- German machinery builders place terminal blocks inside export controls that require clean product files. Destatis reported electrical equipment manufacturing orders rose 21.5% month over month in March 2026. The Germany plastic terminal blocks sector is projected to record 4.18% CAGR during the assessment period, owing to machinery and cabinet review cycles. Weidmüller and Phoenix Contact have local engineering depth that supports specification work. Vendor gains are expected to depend on documented conductor ranges and drawing support.
- UK control-panel accounts are balancing automation upgrades with weaker electrical equipment output. Office for National Statistics reported electrical equipment output fell 4.4% in the three months to April 2026. United Kingdom plastic terminal block demand is anticipated to advance at 4.58% CAGR through 2036 because selective replacement work remains active.
- Japanese cabinet builders tend to keep approved parts longer because quality review remains strict. METI reported the industrial production index at 103.0 in May 2026. Japan is estimated to post 3.98% CAGR over the forecast period, reflecting slower switching and tight approval steps. Product preference is expected to favor proven materials and consistent markings over quick brand substitution.
- South Korea's factory networks give terminal block vendors a shorter feedback loop between engineers and distributors. The Ministry of Data and Statistics recorded domestic machinery orders growth of 25.9% year over year in May 2026. Plastic terminal block sales in South Korea are forecast to expand at 5.38% CAGR by 2036, reinforced by machinery demand and compact automation lines.
Who are the notable companies in the plastic terminal blocks market?
Phoenix Contact, Weidmüller, WAGO, TE Connectivity, Eaton, Schneider Electric, Molex, Amphenol, Dinkle, and DEGSON are the notable companies shaping this market.
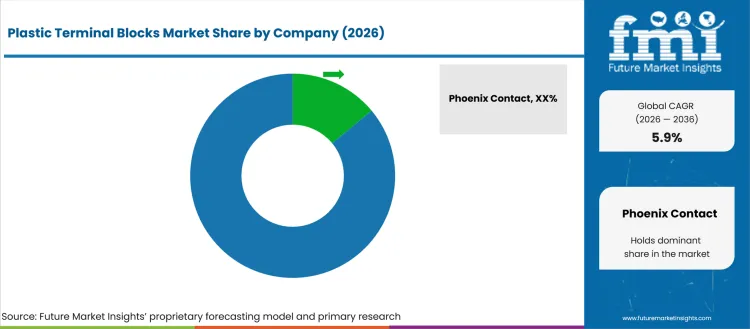
The competitive structure is estimated to remain split between terminal block specialists and broader connector groups. Electrical equipment companies remain active when control panels sit near wider automation portfolios. Control-panel accounts compare connection method and housing material before adding a part to drawings. Suppliers connected to commercial wire and cable are expected to benefit when projects need coordinated wiring components.
- Push-in and pluggable wiring depth separates brands in compact cabinet work. Phoenix Contact and WAGO are expected to compete where installers want faster conductor entry and visible product ratings. Their advantage is tied to accessories and published product data that help panel engineers complete drawings.
- Documentation-heavy accounts often compare production depth before they approve a terminal family. Weidmüller and Schneider Electric are projected to receive attention where control cabinets sit beside broader automation portfolios. Their service route supports drawing release, replacement ordering and plant support.
- Board-level and harness-linked programs bring connector groups into terminal block discussions. TE Connectivity, Molex and Amphenol are anticipated to serve OEMs that use terminal blocks beside device connectors. Their fit is stronger when engineering teams want one contact for multiple connection families.
- Regional service and value pricing create a separate competition lane. Dinkle, DEGSON and Eaton are estimated to compete where distributors need broad terminal lines and quick branch support. The route suits panel builders that test cost, stock depth and basic certification together.
Competitive Benchmarking: Plastic Terminal Blocks Market
| Company | Terminal Range Fit | Push-In Support | Application Evidence | Service Reach | Geographic Coverage |
|---|---|---|---|---|---|
| Phoenix Contact | Strong | High | Strong | Global | Global |
| Weidmüller | Strong | High | Strong | Global | Global |
| WAGO | Strong | High | Strong | Global | Global |
| TE Connectivity | Medium | Medium | Strong | Global | Global |
| Eaton | Medium | Medium | Strong | Global | Global |
| Schneider Electric | Medium | Medium | Strong | Global | Global |
| Molex | Medium | Medium | Strong | Global | Global |
| Amphenol | Medium | Medium | Strong | Global | Global |
| Dinkle | Strong | High | Medium | Regional; Asia | Regional; Asia |
| DEGSON | Strong | High | Medium | Regional; Asia | Regional; Asia |
Source: Future Market Insights competitive analysis, 2026. Ratings reflect relative portfolio relevance and workflow fit. Service capability and geographic reach shape the remaining comparison.
Key Developments in the Plastic Terminal Blocks Market
- In January 2025, Phoenix Contact introduced push-in PCB terminal blocks for BC electronics housings. The release named FKDSO 1.5 and FKDSO 2.5 series for one-housing-width designs. Rated currents up to 22 A give device makers a compact route for PCB-to-field wiring. The same product family supports building automation devices where enclosure width and conductor access are fixed before the board layout is released.
- In October 2025, WAGO broadened its TOPJOB S power distribution terminal block line for cabinet distribution tasks. The company stated that the 2216 and 2016 series were UL-1059 certified and rated at 70 A and 600 V. Panel teams gain clearer options for metering and load connections. The release also gives distributors a cleaner stocking story for control cabinets that combine branch power and field wiring.
- In September 2025, Weidmüller opened a new electronics plant at its Detmold site in Germany. The facility includes PCB assembly and plastics production. It also houses assembly and logistics in a production hall of nearly 19,000 square meters. Localized production depth is expected to help cabinet component accounts when samples and repeat orders need faster support inside Europe.
- In June 2025, Dinkle announced its Manufacturing Expo display in Bangkok for industrial connectivity and wiring solutions. The product set included circular connectors and DIN rail terminal blocks. PCB terminal blocks were also included for control and power distribution. Its Thailand plant plan adds a Southeast Asian service angle for panel builders that want local support before standardizing a terminal family.
Key Players in the Plastic Terminal Blocks Market
Terminal block specialists
- Phoenix Contact
- Weidmüller
- WAGO
- Dinkle
- DEGSON
Electrical equipment groups
- Eaton
- Schneider Electric
Connector and interconnect suppliers
- TE Connectivity
- Molex
- Amphenol
Plastic Terminal Blocks Market - Report Scope
| Coverage field | Report scope |
|---|---|
| Market breakdown | By product type, material, current rating, end use, sales channel and region |
| Quantitative Units | Revenue in USD Million, CAGR in %, and share in % |
| Market Definition | Plastic terminal blocks are insulated connection devices that secure, separate and organize electrical conductors inside equipment and control panels. |
| Regions Covered | North America, Europe, East Asia, South Asia, Latin America, and Middle East and Africa |
| Countries Covered | United States, China, India, Germany, United Kingdom, Japan, South Korea and 20+ countries |
| Key Companies Profiled | Phoenix Contact, Weidmüller, WAGO, TE Connectivity, Eaton, Schneider Electric, Molex, Amphenol, Dinkle, and DEGSON |
| Forecast Period | 2026 to 2036 |
| Approach | Hybrid methodology using product mapping, channel checks, standards review, account-up modeling and portfolio-wide revenue reconciliation |
Source: Future Market Insights - analysis driven by proprietary forecasting models and primary research
Plastic Terminal Blocks Market - Research Methodology
| Method | Approach |
|---|---|
| Primary Research | FMI interviewed component distributors, control-panel builders and OEM engineers that specify plastic terminal blocks. The team tested conductor range and flame rating. It also reviewed pitch, connection method and accessory availability. Interview feedback was mapped against branch stocking behavior and direct OEM approval steps. |
| Desk Research | Desk research reviewed official standards records and company product releases. It also covered national manufacturing indicators. FMI used sources from the Federal Reserve Board, National Bureau of Statistics of China and Destatis. Product evidence from Phoenix Contact, TE Connectivity, WAGO, Weidmüller and Dinkle helped validate commercial relevance. |
| Market Sizing and Forecasting | FMI sized the market through a hybrid model that combined installed cabinet demand, replacement cycles and OEM adoption. Segment shares were checked against product families, current ratings and channel use. Forecasts were reconciled with country-level industrial output signals and supplier portfolio evidence. |
| Data Validation | FMI validated market estimates through triangulation of primary research findings, secondary-source evidence and internal market databases. Demand-side insights from OEMs, panel builders and distributors were cross-checked against supplier product portfolios, shipment patterns and industrial production indicators. Segment shares, pricing assumptions and forecast projections were reviewed for consistency across regions and application categories to ensure accuracy and market relevance. |
Source: Future Market Insights (FMI) analysis, based on proprietary forecasting model and primary research
Plastic Terminal Blocks Market by Segments
Plastic Terminal Blocks Market segmented by Product Type:
- PCB Terminal Blocks
- Barrier Terminal Blocks
- DIN Rail Terminal Blocks
- Pluggable Terminal Blocks
Plastic Terminal Blocks Market segmented by Material:
- PA / Nylon
- PBT
- Polycarbonate
- High-Temperature Thermoplastics
Plastic Terminal Blocks Market segmented by Current Rating:
- Low Current
- Medium Current
- High Current
Plastic Terminal Blocks Market segmented by End Use:
- Industrial Controls
- Building Automation
- Power Distribution
- Consumer Electronics
Plastic Terminal Blocks Market segmented by Sales Channel:
- Electrical Distributors
- Direct OEM
- E-Commerce / Catalog
Plastic Terminal Blocks Market by Region:
- North America
- United States
- Canada
- Latin America
- Brazil
- Mexico
- Argentina
- Europe
- Germany
- United Kingdom
- France
- Italy
- Spain
- Nordics
- East Asia
- China
- Japan
- South Korea
- South Asia
- India
- ASEAN
- Australia and New Zealand
- Middle East and Africa
- GCC Countries
- South Africa
- Türkiye
Research Sources and Bibliography
- Federal Reserve Board. (2026, June). Industrial production and capacity utilization. Federal Reserve Board.
- National Bureau of Statistics of China. (2026, April). Industrial production operation in March 2026. National Bureau of Statistics of China.
- Press Information Bureau. (2026, March). Advancing Self-Reliance and Export Resilience: India’s Growing Global Footprint. Government of India.
- Press Information Bureau. (2026, February). Union Budget 2026-27 raises scheme outlay to INR 40,000 crore. Government of India.
- German Federal Statistical Office. (2026, May). New orders in manufacturing in March 2026: +5.0% on the previous month. Destatis.
- Office for National Statistics. (2026, June). Index of Production, UK: April 2026. Office for National Statistics.
- Ministry of Economy, Trade and Industry. (2026, June). Indices of Industrial Production. Government of Japan.
- Ministry of Data and Statistics. (2026, June). Monthly Industrial Statistics, May 2026. Republic of Korea.
- International Energy Agency. (2026, February). Demand - Electricity 2026. International Energy Agency.
- ETICS European Testing Inspection Certification System. (2025, July). EN IEC 60947-7-1:2025. ETICS.
- Phoenix Contact. (2025, January). Push-in PCB terminal blocks for BC 17,8 electronics housing. Phoenix Contact.
- Phoenix Contact. (2025, June). Convenient wiring of control cabinets with Push-X and Combi plug-in zone. Phoenix Contact.
- WAGO. (2025, October). WAGO Broadens Power Distribution Terminal Block Line. WAGO.
- Weidmüller. (2025, September). New Electronics Plant Opens: Weidmüller Invests in the Future. Weidmüller.
- Dinkle. (2025, March). Dinkle Presents at Hannover Messe 2025. Dinkle.
- Dinkle. (2025, June). DINKLE to Exhibit at Manufacturing Expo 2025. Dinkle.
- Schneider Electric. (2025, February). What is the Difference Between ZBE1015 and ZBE1015SC? Schneider Electric.
- TE Connectivity. (2025, November). TE Connectivity at SPS 2025. TE Connectivity.
- TE Connectivity. (2026, January). Next2OEM: TE Connectivity actively shaping the future of automated wiring harness production. TE Connectivity.
- TE Connectivity. (2025, October). TE Connectivity launches new product portfolio for automotive ECUs. TE Connectivity.
- WAGO. (2025, May). Control Signal Terminal Strip; DIN VDE 4100:2025-05 Version. WAGO.
This bibliography is provided for reader reference and uses primary government sources. It also uses standards-body, official trade body and company sources.
This Report Answers
- What value is the plastic terminal blocks market estimated to record in 2026 and by 2036?
- What CAGR is projected for the plastic terminal blocks market from 2026 to 2036?
- Which segment choices shape demand across the parent categories?
- Which cabinet wiring pressures are expected to support purchase activity?
- How are country CAGRs projected to differ across the profiled markets?
- Which companies compete across connection method, documentation and service reach?
- How does FMI validate forecasts using its hybrid methodology and primary research?
- What should OEM engineers address before broader sourcing commitment?
- How are standards files and certification records expected to affect vendor selection?
Frequently Asked Questions
What is driving growth in the Plastic Terminal Blocks Market?
Growth is expected to be driven by compact control panels and faster wiring needs. Standards review is projected to support documented terminal families.
Who are the key players in the Plastic Terminal Blocks Market?
Key players include Phoenix Contact, Weidmüller, WAGO, TE Connectivity, Eaton, Schneider Electric, Molex, Amphenol, Dinkle, and DEGSON. Competition is projected to center on wiring speed.
What is a significant restraint in the Plastic Terminal Blocks Market?
A significant restraint is lengthy approval work for ratings, materials and accessories. Adoption is anticipated to slow where product files remain incomplete.
Why should executives track the Plastic Terminal Blocks Market?
Executives should track this market because automation growth and control-panel densification are increasing demand for compact and reliable electrical connection solutions. Rising industrial electronics and localized manufacturing investments are also expanding opportunities for certified terminal block suppliers.
What business problem does the Plastic Terminal Blocks Market address?
The market addresses the need for safe and organized conductor connections in industrial equipment and control cabinets. Plastic terminal blocks help simplify wiring while improving insulation performance and maintenance accessibility.
What should procurement leaders evaluate before selecting suppliers?
Procurement leaders should evaluate certification compliance connection technology material quality and accessory compatibility. They should also assess documentation support product availability and long-term supply reliability for approved designs.
What can limit return on investment for buyers?
Return on investment can be limited by lengthy qualification processes incomplete certification records and compatibility issues with existing panel designs. Product changes that require redesigns or additional approvals can also increase project costs and delays.
How can suppliers build executive confidence?
Suppliers can build confidence by providing validated performance data comprehensive certification files and consistent product quality. Strong engineering support rapid sample availability and reliable accessory ecosystems can further strengthen customer trust and repeat business.
Preview the report firsthand - request a free sample
Get SampleGet the brochure for pricing and purchase details.
Get PDFTable of Content
- Key Takeaways
- Market Size and CAGR
- Top Growth Driver
- Fastest Growing Segment
- Leading Region
- Key Companies
- Emerging Opportunities
- Executive Summary
- Global Market Outlook
- Demand-side Trends
- Supply-side Trends
- Technology Roadmap Analysis
- Analysis and Recommendations
- Analyst Perspective (What is happening? Why now? What should investors know?)
- Key Questions Answered
- How large is the market?
- What is the CAGR?
- What are key trends?
- Which region dominates?
- Who are the leaders?
- Market Overview
- Market Coverage / Taxonomy
- Market Definition / Scope / Limitations
- Research Methodology
- Chapter Orientation
- Analytical Lens and Working Hypotheses
- Market Structure, Signals, and Trend Drivers
- Benchmarking and Cross-market Comparability
- Market Sizing, Forecasting, and Opportunity Mapping
- Research Design and Evidence Framework
- Desk Research Programme (Secondary Evidence)
- Expert Input and Fieldwork (Primary Evidence)
- Tooling, Models, and Reference Databases
- Data Engineering and Model Build
- Quality Assurance and Audit Trail
- Market Background
- Market Dynamics (Drivers, Restraints, Opportunity, Trends)
- Scenario Forecast (Optimistic, Likely, Conservative)
- Impact Analysis
- AI Impact
- Sustainability Impact
- Regulatory Impact
- Technology Impact
- Consumer / Buyer Analysis
- Purchase Drivers
- Adoption Barriers
- Buyer Journey
- Opportunity Map Analysis
- Product Life Cycle Analysis
- Supply Chain Analysis
- Investment Feasibility Matrix
- Value Chain Analysis
- PESTLE and Porter's Analysis
- Regulatory Landscape
- Regional Parent Market Outlook
- Production and Consumption Statistics
- Import and Export Statistics
- Global Market Analysis and Forecast, 2021 to 2036
- Historical Market Size Value (USD Million) Analysis, 2021 to 2025
- Current and Future Market Size Value (USD Million) Projections, 2026 to 2036
- Y-o-Y Growth Trend Analysis
- Absolute $ Opportunity Analysis
- Global Market Pricing Analysis, 2021 to 2036
- Global Market Analysis and Forecast, By Product Type, 2021 to 2036
- Introduction / Key Findings
- Historical Market Size Value (USD Million) Analysis By Product Type, 2021 to 2025
- Current and Future Market Size Value (USD Million) Analysis and Forecast By Product Type, 2026 to 2036
- PCB Terminal Blocks
- Barrier Terminal Blocks
- DIN Rail Terminal Blocks
- Pluggable Terminal Blocks
- PCB Terminal Blocks
- Y-o-Y Growth Trend Analysis By Product Type, 2021 to 2025
- Absolute $ Opportunity Analysis By Product Type, 2026 to 2036
- Global Market Analysis and Forecast, By Current Rating, 2021 to 2036
- Introduction / Key Findings
- Historical Market Size Value (USD Million) Analysis By Current Rating, 2021 to 2025
- Current and Future Market Size Value (USD Million) Analysis and Forecast By Current Rating, 2026 to 2036
- Low Current
- Medium Current
- High Current
- Low Current
- Y-o-Y Growth Trend Analysis By Current Rating, 2021 to 2025
- Absolute $ Opportunity Analysis By Current Rating, 2026 to 2036
- Global Market Analysis and Forecast, By End Use, 2021 to 2036
- Introduction / Key Findings
- Historical Market Size Value (USD Million) Analysis By End Use, 2021 to 2025
- Current and Future Market Size Value (USD Million) Analysis and Forecast By End Use, 2026 to 2036
- Industrial Controls
- Building Automation
- Power Distribution
- Consumer Electronics
- Industrial Controls
- Y-o-Y Growth Trend Analysis By End Use, 2021 to 2025
- Absolute $ Opportunity Analysis By End Use, 2026 to 2036
- Global Market Analysis and Forecast, By Sales Channel, 2021 to 2036
- Introduction / Key Findings
- Historical Market Size Value (USD Million) Analysis By Sales Channel, 2021 to 2025
- Current and Future Market Size Value (USD Million) Analysis and Forecast By Sales Channel, 2026 to 2036
- Direct OEM
- Electrical Distributors
- E-Commerce - Catalog
- Direct OEM
- Y-o-Y Growth Trend Analysis By Sales Channel, 2021 to 2025
- Absolute $ Opportunity Analysis By Sales Channel, 2026 to 2036
- Global Market Analysis and Forecast, By Region, 2021 to 2036
- Introduction
- Historical Market Size Value (USD Million) Analysis By Region, 2021 to 2025
- Current Market Size Value (USD Million) Analysis and Forecast By Region, 2026 to 2036
- North America
- Latin America
- Western Europe
- Eastern Europe
- East Asia
- South Asia and Pacific
- Middle East & Africa
- Market Attractiveness Analysis By Region
- North America Market Analysis and Forecast, By Country, 2021 to 2036
- Historical Market Size Value (USD Million) Trend Analysis By Market Taxonomy, 2021 to 2025
- Market Size Value (USD Million) Forecast By Market Taxonomy, 2026 to 2036
- By Country
- USA
- Canada
- By Product Type
- By Current Rating
- By End Use
- By Sales Channel
- By Country
- Market Attractiveness Analysis
- By Country
- By Product Type
- By Current Rating
- By End Use
- By Sales Channel
- Key Takeaways
- Latin America Market Analysis and Forecast, By Country
- Historical Market Size Value (USD Million) Trend Analysis By Market Taxonomy, 2021 to 2025
- Market Size Value (USD Million) Forecast By Market Taxonomy, 2026 to 2036
- By Country
- Brazil
- Mexico
- Chile
- Rest of Latin America
- By Product Type
- By Current Rating
- By End Use
- By Sales Channel
- By Country
- Market Attractiveness Analysis
- By Country
- By Product Type
- By Current Rating
- By End Use
- By Sales Channel
- Key Takeaways
- Western Europe Market Analysis and Forecast, By Country
- Historical Market Size Value (USD Million) Trend Analysis By Market Taxonomy, 2021 to 2025
- Market Size Value (USD Million) Forecast By Market Taxonomy, 2026 to 2036
- By Country
- Germany
- UK
- Italy
- Spain
- France
- Nordic
- BENELUX
- Rest of Western Europe
- By Product Type
- By Current Rating
- By End Use
- By Sales Channel
- By Country
- Market Attractiveness Analysis
- By Country
- By Product Type
- By Current Rating
- By End Use
- By Sales Channel
- Key Takeaways
- Eastern Europe Market Analysis and Forecast, By Country
- Historical Market Size Value (USD Million) Trend Analysis By Market Taxonomy, 2021 to 2025
- Market Size Value (USD Million) Forecast By Market Taxonomy, 2026 to 2036
- By Country
- Russia
- Poland
- Hungary
- Balkan & Baltic
- Rest of Eastern Europe
- By Product Type
- By Current Rating
- By End Use
- By Sales Channel
- By Country
- Market Attractiveness Analysis
- By Country
- By Product Type
- By Current Rating
- By End Use
- By Sales Channel
- Key Takeaways
- East Asia Market Analysis and Forecast, By Country
- Historical Market Size Value (USD Million) Trend Analysis By Market Taxonomy, 2021 to 2025
- Market Size Value (USD Million) Forecast By Market Taxonomy, 2026 to 2036
- By Country
- China
- Japan
- South Korea
- By Product Type
- By Current Rating
- By End Use
- By Sales Channel
- By Country
- Market Attractiveness Analysis
- By Country
- By Product Type
- By Current Rating
- By End Use
- By Sales Channel
- Key Takeaways
- South Asia and Pacific Market Analysis and Forecast, By Country
- Historical Market Size Value (USD Million) Trend Analysis By Market Taxonomy, 2021 to 2025
- Market Size Value (USD Million) Forecast By Market Taxonomy, 2026 to 2036
- By Country
- India
- ASEAN
- Australia & New Zealand
- Rest of South Asia and Pacific
- By Product Type
- By Current Rating
- By End Use
- By Sales Channel
- By Country
- Market Attractiveness Analysis
- By Country
- By Product Type
- By Current Rating
- By End Use
- By Sales Channel
- Key Takeaways
- Middle East & Africa Market Analysis and Forecast, By Country
- Historical Market Size Value (USD Million) Trend Analysis By Market Taxonomy, 2021 to 2025
- Market Size Value (USD Million) Forecast By Market Taxonomy, 2026 to 2036
- By Country
- Kingdom of Saudi Arabia
- Other GCC Countries
- Türkiye
- South Africa
- Other African Union
- Rest of Middle East & Africa
- By Product Type
- By Current Rating
- By End Use
- By Sales Channel
- By Country
- Market Attractiveness Analysis
- By Country
- By Product Type
- By Current Rating
- By End Use
- By Sales Channel
- Key Takeaways
- Key Countries Market Analysis
- USA
- Pricing Analysis
- Market Share Analysis, 2025
- By Product Type
- By Current Rating
- By End Use
- By Sales Channel
- Canada
- Pricing Analysis
- Market Share Analysis, 2025
- By Product Type
- By Current Rating
- By End Use
- By Sales Channel
- Mexico
- Pricing Analysis
- Market Share Analysis, 2025
- By Product Type
- By Current Rating
- By End Use
- By Sales Channel
- Brazil
- Pricing Analysis
- Market Share Analysis, 2025
- By Product Type
- By Current Rating
- By End Use
- By Sales Channel
- Chile
- Pricing Analysis
- Market Share Analysis, 2025
- By Product Type
- By Current Rating
- By End Use
- By Sales Channel
- Germany
- Pricing Analysis
- Market Share Analysis, 2025
- By Product Type
- By Current Rating
- By End Use
- By Sales Channel
- UK
- Pricing Analysis
- Market Share Analysis, 2025
- By Product Type
- By Current Rating
- By End Use
- By Sales Channel
- Italy
- Pricing Analysis
- Market Share Analysis, 2025
- By Product Type
- By Current Rating
- By End Use
- By Sales Channel
- Spain
- Pricing Analysis
- Market Share Analysis, 2025
- By Product Type
- By Current Rating
- By End Use
- By Sales Channel
- France
- Pricing Analysis
- Market Share Analysis, 2025
- By Product Type
- By Current Rating
- By End Use
- By Sales Channel
- India
- Pricing Analysis
- Market Share Analysis, 2025
- By Product Type
- By Current Rating
- By End Use
- By Sales Channel
- ASEAN
- Pricing Analysis
- Market Share Analysis, 2025
- By Product Type
- By Current Rating
- By End Use
- By Sales Channel
- Australia & New Zealand
- Pricing Analysis
- Market Share Analysis, 2025
- By Product Type
- By Current Rating
- By End Use
- By Sales Channel
- China
- Pricing Analysis
- Market Share Analysis, 2025
- By Product Type
- By Current Rating
- By End Use
- By Sales Channel
- Japan
- Pricing Analysis
- Market Share Analysis, 2025
- By Product Type
- By Current Rating
- By End Use
- By Sales Channel
- South Korea
- Pricing Analysis
- Market Share Analysis, 2025
- By Product Type
- By Current Rating
- By End Use
- By Sales Channel
- Russia
- Pricing Analysis
- Market Share Analysis, 2025
- By Product Type
- By Current Rating
- By End Use
- By Sales Channel
- Poland
- Pricing Analysis
- Market Share Analysis, 2025
- By Product Type
- By Current Rating
- By End Use
- By Sales Channel
- Hungary
- Pricing Analysis
- Market Share Analysis, 2025
- By Product Type
- By Current Rating
- By End Use
- By Sales Channel
- Kingdom of Saudi Arabia
- Pricing Analysis
- Market Share Analysis, 2025
- By Product Type
- By Current Rating
- By End Use
- By Sales Channel
- Türkiye
- Pricing Analysis
- Market Share Analysis, 2025
- By Product Type
- By Current Rating
- By End Use
- By Sales Channel
- South Africa
- Pricing Analysis
- Market Share Analysis, 2025
- By Product Type
- By Current Rating
- By End Use
- By Sales Channel
- USA
- Market Structure Analysis
- Competition Dashboard
- Competition Benchmarking
- Market Share Analysis of Top Players
- By Regional
- By Product Type
- By Current Rating
- By End Use
- By Sales Channel
- Emerging Startups
- Innovation Benchmarking
- Competition Analysis
- Competition Deep Dive
- Phoenix Contact
- Overview
- Product Portfolio
- Profitability by Market Segments
- Sales Footprint
- Strategy Overview
- Marketing Strategy
- Product Strategy
- Channel Strategy
- Weidmüller
- WAGO
- TE Connectivity
- Eaton
- Schneider Electric
- Phoenix Contact
- Case Studies
- Success Stories
- Recent Developments
- Competition Deep Dive
- Assumptions & Acronyms Used


