Reports

- Global Locations -

Headquarters

Future Market Insights, Inc.

Christiana Corporate, 200
Continental Drive, Suite 401,
Newark, Delaware - 19713,
United States

T: +1-845-579-5705

Americas

Future Market Insights, Inc.

616 Corporate Way, Suite 2-9018,
Valley Cottage, NY 10989, United States

T: +1-347-918-3531

MEA

Future Market Insights

1602-6 Jumeirah Bay X2 Tower, Plot No: JLT-PH2-X2A,
Jumeirah Lakes Towers, Dubai,
United Arab Emirates

Europe

Future Market Insights

3rd Floor, 207 Regent Street,
W1B 3HH London
United Kingdom

T: + 44 (0) 20 8123 9659
D: +44 (0) 20 3287 4268

Asia Pacific

Future Market Insights

IndiaLand Global Tech Park, Unit UG-1, Behind Grand HighStreet, Phase 1, Hinjawadi, MH, Pune – 411057, India

Portable Printer Market Snapshot (2022 to 2032)

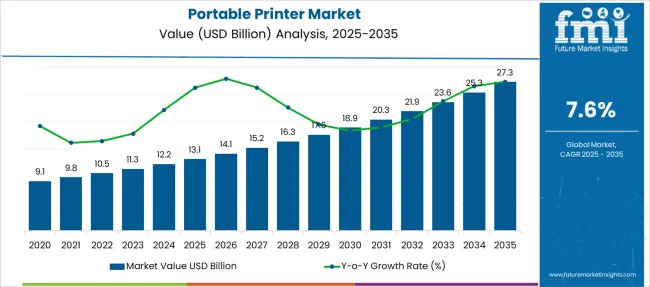
The global portable printer market is anticipated to reach US$ 10,522 Million by 2022. With the increasing use of smart devices such as tablets and smartphones, the overall demand for portable printers is projected to grow at a CAGR of 7.6% between 2022 and 2032, surpassing a valuation of US$ 21,909 Million by 2032.

Portable printers, also known as mobile printers, are small and light peripheral devices that may be linked to a computer by Bluetooth or a universal serial bus (USB). Business travelers use them to update papers and exchange them with clients. They are also used in gas stations, stores, credit card terminals, hotels, and restaurants to print bill receipts.

Furthermore, portable printers increase the efficiency of the operations team and front-line personnel by allowing them to swiftly create invoices. As a result, these printers are widely used in the retail, healthcare, hospitality, manufacturing, e-commerce, and logistics industries all over the world.

Data Points Key Statistics
Portable Printer Market Value 2022 US$ 10,522 Million
Portable Printer Market Projected Value (2032) US$ 21,909 Million
Portable Printer Market CAGR (2022 to 2032) 7.6%

Don't pay for what you don't need

Customize your report by selecting specific countries or regions and save 30%!

Portable Printer Demand Analysis (2017 to 2021) Vs Market Outlook (2022 to 2032)

The global demand for the portable printer is projected to increase at a CAGR of 7.6% during the forecast period between 2022 and 2032, reaching a total of US$ 21,909 Million in 2032, according to a report from Future Market Insights (FMI). From 2017 to 2021, sales witnessed significant growth, registering a CAGR of 5.2%.

The growing number of mobile workers is a major element driving the worldwide portable printer market. Portable printers, ranging from small handheld versions to big cart-mounted printers, use wireless network connections. Portable printers come in a variety of shapes and sizes, allowing them to work in a variety of settings.

Portable printers, like stationary printers, are simple to operate, lightweight, and robust, with the high print quality and support for a wide range of media. Portable printers can be linked to a local area network (LAN) using an 802.11b/g wireless interface, and they can accept commands from smartphones, laptops, and tablets via both cabled and wireless connections. Portable printers are used to print specific printing applications such as barcode/RFID labels, tags, tickets, and receipts, which need fine-tuning of characteristics such as the printer's print speed and darkness setting, which are not available on standard office printers.

Which Drivers underpin Portable Printer Industry Expansion?

Work-from-home and remote working popularity will fuel market growth

During the pandemic, a huge number of enterprises in the Asia Pacific area shifted to remote working. Employees needed the necessary tools to help them transition to a mobile workforce. Sales, logistics, and retail, in particular, require quick printing of receipts, tokens, tickets, invoices, shipping labels, barcodes, and so on, boosting the demand for portable printers.

Furthermore, the worldwide portable printer market is expected to be pushed by increased internet penetration globally. An estimated 75.58 billion IoT devices (smart devices connected through the internet) will be deployed globally by 2025. In addition, the rising usage of smart gadgets and portable electronics will boost the market growth in the next years.

The Expansion of Online Industries will Drive Portable Printer Market Development throughout the Projected Period

Online companies such as e-commerce, online meal delivery services, grocery delivery services, and logistics have gained major traction in recent years, particularly in Asia Pacific and Latin America's rising markets. Brazil, Mexico, China, South Korea, India, and ASEAN nations are among them.

Along with e-receipts, these organizations must meet consumer demands for on-demand barcode, receipt, and label printing, which is projected to continue in the coming years and boost the portable printer market expansion.

Sudip Saha
Sudip Saha

Principal Consultant

Talk to Analyst

Find your sweet spots for generating winning opportunities in this market.

Which Factors are limiting the Growth of Portable Printer Market?

The High Cost of Research is projected to limit Worldwide Market Expansion

For the portable printer industry to benefit from market trends, innovation is required. This needs design centers and a well-established Research and Development staff. The cost of research varies according to geography, as does the cost of production. This is expected to stifle market expansion to some degree.

However, due to their existing research institutions, Europe and the USA are projected to lead the industry. Asian nations such as China, Taiwan, and the Philippines have lately begun to expand innovation centers and units to produce technologically superior portable printers, which will aid the market in overcoming restrictions.
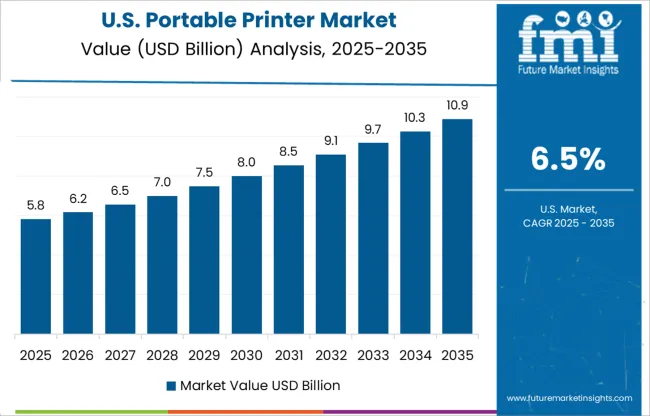
USA Dominates the Portable Printer Market by Constant Focus on Improving Customer Experience

North America is expected to dominate the market by acquiring the highest market share of 25.3% during the forecast period. Owing to the constant focus on improving customer experience and mobile worker efficiency in the USA is accelerating the demand for a portable printers.

In addition, increased usage of portable printers in the retail and healthcare sector is the key factor driving the USA portable printer market size. Moreover, the growing BYOD policy in the USA is the top factor that drives the market share. The key players are investing in the portable printer with rising smart devices flourishing the USA portable printer market growth.

Get the data you need at a Fraction of the cost

Personalize your report by choosing insights you need
and save 40%!

United Kingdom Portable Printer Market Drives by Growing Healthcare Sector

Europe is likely to secure a share of 19.8% in the portable printer market during the forecast period. The rising healthcare, retail, and transport industry in the United Kingdom& is likely to increase the adoption of the portable printer during the forecast period. Moreover, the key manufacturers are focusing on the innovation of portable printers with modern technology to work faster and more accurately during the forecast period.

Cloudprinter.com is the world's premier Print API for Web2Print providers, E-commerce solutions, Enterprises, and publishers. Cloudprinter.com, with offices in the Netherlands, Denmark, and Ukraine, is establishing a global network of 170+ print partners for local printing. With our services and solutions, you may print flyers, posters, brochures, picture albums, and over 5000 more goods internationally. Cloudprinter.com helps you save money on shipping, cut transit times, and minimize CO2 emissions.

Asia Pacific Portable Printer Market Fuel by Rising Mobile Consumers

Asia Pacific portable printer market is expected to accumulate a significant market share of 12% during the forecast

Korean market is likely to secure a significant share in the region by rising numbers of mobile users during the forecast period. With the increasing emphasis on simplifying receipt and order administration, the Korean portable printer market share surging in recent years. Korea is one of the fastest growing countries, which contributes phenomenal CAGR in the region by rising numbers of small enterprises. Moreover, growing numbers of key manufacturing industries and rising start-ups are adding value to the market and are likely to increase the adoption of the portable printer in Korea.

Japan is known for its highly advanced technology in the region. However, it secures the maximum share of the portable printer market in the region during the forecast period. Rising portable printers and growing demand for the mobile printer is key factors that accelerate the market share. The rise in adoption of small, smart, and movable devices is flourishing the market size. Moreover, consumers' attraction towards the devices due to their great flexibility, accuracy, and productivity is increasing the Japan portable printer market growth during the forecast period. The key manufacturers are using several marketing tactics in Japan to uplift the size of the market through acquisitions, mergers, and product launches in the market.
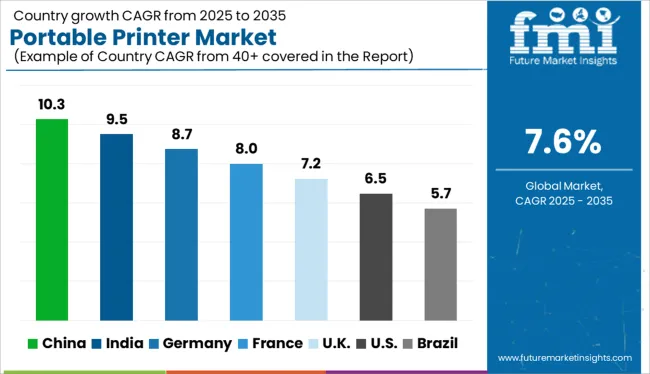
Country-wise Insights

Will North America Continue Dominance in the Global Portable Printer Market?

Constant Focus on Improving Customer Experience to Fuel the Market Growth

The portable printer market in North America is expected to accumulate the highest market share of 25.3% in 2022. Owing to the constant focus on improving customer experience and mobile worker efficiency, North America, is likely to provide a large market share. The USA Because of the increased usage of portable printers in the retail and healthcare sectors is the dominant country in the North American area.

Where does the growth of the Portable Printer Market in the Asia Pacific stand?

Increasing Number of Mobile Users Fuel the Market Growth

The portable printer market in Asia Pacific is expected to accumulate a significant market share of 12% in 2022 and is expected to continue to maintain the trend over the forecast period as well.

Because of the rising number of mobile users and the increased emphasis on simplifying receipt and order administration, Asia Pacific is expected to be the fastest-growing portable printer market. The Asia Pacific region's market has been steadily growing due to an expanding mobile workforce and a rising need for easier receipts for order management. China alone is predicted to develop at a phenomenal CAGR between 2022 and 2032. Another element contributing to development in this region is the rising number of small enterprises operating online and start-ups.
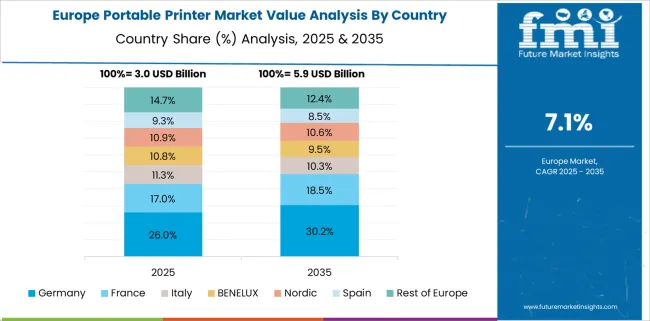
How Will the Growth of the Portable Printer Market unfold in Europe?

The portable printer market in Europe is expected to accumulate a market share value of 19.8% in 2022. Due to the constant focus on improving customer experience and mobile workforce productivity, Europe is likely to contribute a large market share.

Category-wise Insights

By Printing Technology, which Portable Printer Category dominates the Market?

The Thermal Printing Segment to Drive the Portable Printer Market

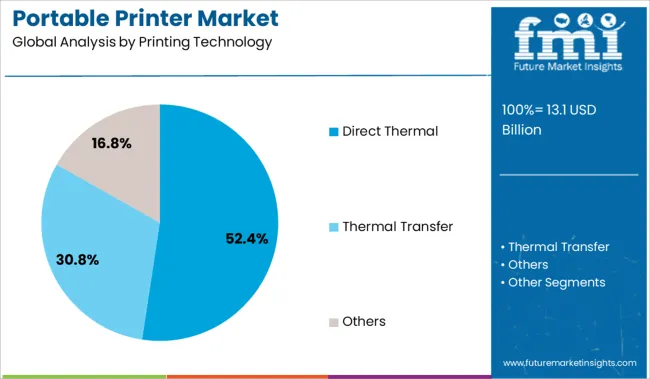
The printing technology category is separated into three categories: direct thermal, thermal transfer, and others. The thermal portable printer category grabbed the most market share in the entire portable printer industry.

Which End User Industry is Gaining the Most Traction?

The Transportation & Logistics Segment is Gaining the Most Traction

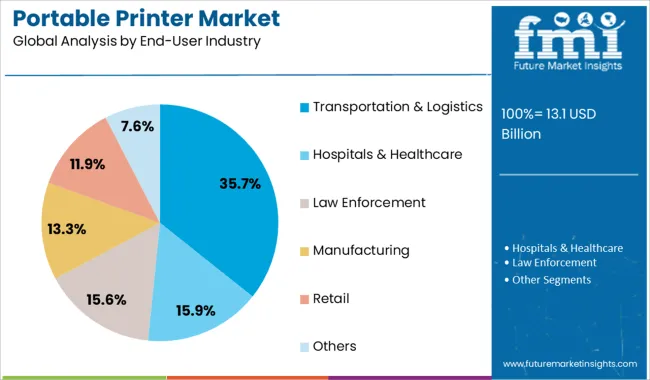
On the basis of the end-user industry portable printer is categorized into transportation & logistics, hospitals & healthcare, law enforcement, manufacturing, retail, and others. The transportation & logistics sector accounted for the lion’s share in the portable printers market and is anticipated to gain maximum traction during the forecast period.

The increased demand from the healthcare, logistics, e-commerce, and hospitality industries will propel this sector’s growth to new heights. Furthermore, the popularity of portable printers is rapidly expanding. Many businesses are using portable printers for their staff in order to boost productivity and operations. As a result, all of these factors will contribute to the portable printer market's rapid expansion.

The Start-up Ecosystem: How key Players are opening Frontiers for Future Growth?

Start-ups and their innovations are driving some of the most recent advances in the portable printer sector.

A portable printer gives the consumer actionable innovation intelligence and highlights some of the companies. Let's have a look at some of the primary areas of innovation in this industry:
  • Cloudprinter.com is the world's premier Print API for Web2Print providers, E-commerce solutions, Enterprises, and publishers. Cloudprinter.com, with offices in the Netherlands, Denmark, and Ukraine, is establishing a global network of 170+ print partners for local printing. With our services and solutions, you may print flyers, posters, brochures, picture albums, and over 5000 more goods internationally. Cloudprinter.com helps you save money on shipping, cut transit times, and minimize CO2 emissions.

Who are the Leading Players in the Portable Printer Market?

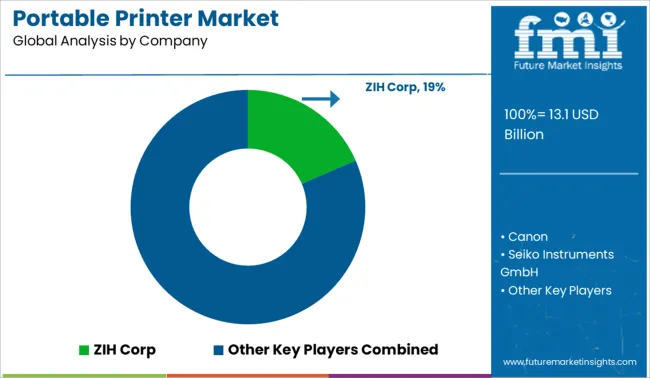
ZIH Corp, Canon, Seiko Instruments GmbH, Toshiba TEC Corporation, Brother United Kingdom Ltd, HP Development Company, L.P., Epson, PrinterOn Inc., Fujifilm Holdings Corporation, and Polaroid are some of the important participants in the worldwide Portable Printer Market.

Recent Developments:

  • In September 2022, Toshiba TEC Corporation announced the release of 12 Office Collection 3 next-generation multifunction printers (MFPs) that enable today's workforce to operate more effectively and securely while using the cloud.
  • In February 2022, Canon announced the release of the new MAXIFY GX5070 ink tank business printer, as part of the MAXIFY Ink Efficient GX Series line-up. The printer combines cheap color printing prices with paper handling, speed, and networking capabilities to increase productivity and efficiency in enterprises and offices.

Report Scope

Report Attribute Details
Growth Rate CAGR of 7.6% from 2022 to 2032
Market Value in 2022 US$ 10,522 Million
Market Value in 2032 US$ 21,909 Million
Base Year for Estimation 2021
Historical Data 2016 to 2021
Forecast Period 2022 to 2032
Quantitative Units Revenue in US$ Million and CAGR from 2022 to 2032
Report Coverage Revenue Forecast, Company Ranking, Competitive Landscape, Growth Factors, Trends, and Pricing Analysis
Segments Covered
  • Printing Technology
  • Connecting Technology
  • End-User Industry
  • Region
Regions Covered
  • North America
  • Latin America
  • Europe
  • East Asia
  • South Asia
  • Oceania
  • Middle East & Africa
Key Countries Profiled
  • USA
  • Canada
  • Brazil
  • Mexico
  • Germany
  • United Kingdom
  • France
  • Spain
  • Italy
  • Russia
  • Poland
  • China
  • Japan
  • South Korea
  • India
  • Malaysia
  • Singapore
  • Thailand
  • Australia
  • New Zealand
  • GCC Countries
  • South Africa
  • Israel
Key Companies Profiled
  • ZIH Corp
  • Canon
  • Seiko Instruments GmbH
  • Toshiba TEC Corporation
  • Brother United Kingdom Ltd
  • HP Development Company
  • L.P. Printing
  • Epson
  • PrinterOn Inc.
  • Fujifilm Holdings Corporation
  • Polaroid
Customization & Pricing Available upon Request

Key Segments Covered in the Portable Printer Industry Analysis

Portable Printer Market by Printing Technology:

  • Direct Thermal
  • Thermal Transfer
  • Others

Portable Printer Market by Connecting Technology:

  • Bluetooth
  • Other Wireless Network Technology

Portable Printer Market by End-User Industry:

  • Transportation & Logistics
  • Hospitals & Healthcare
  • Law Enforcement
  • Manufacturing
  • Retail
  • Others

Portable Printer Market by Region:

  • North America Portable Printer Market
  • Latin America Portable Printer Market
  • Europe Portable Printer Market
  • East Asia Portable Printer Market
  • South Asia Portable Printer Market
  • Oceania Portable Printer Market
  • Middle East & Africa Portable Printer Market

Frequently Asked Questions

At what value did the portable printer market close in 2022?

By 2022 end, sales of portable printer closed at a value of US$ 10,522 Million

What was the last 5 years value CAGR for portable printer market value?

From 2016 to 2021, portable printer demand expanded at a CAGR of 5.2%

What is the projected forecast CAGR for the portable printer industry from 2022 to 2032?

From 2022 to 2032, portable printer sales are expected to flourish at a CAGR of 7.6%

According to FMI, what is the anticipated market value for portable printer in 2032?

By 2032, the market value of portable printer expected to reach US$ 21,909 Million

Table of Content

1. Executive Summary | Portable Printer Market

    1.1. Global Market Outlook

    1.2. Demand-side Trends

    1.3. Supply-side Trends

    1.4. Technology Roadmap Analysis

    1.5. Analysis and Recommendations

2. Market Overview

    2.1. Market Coverage / Taxonomy

    2.2. Market Definition / Scope / Limitations

3. Market Background

    3.1. Market Dynamics

        3.1.1. Drivers

        3.1.2. Restraints

        3.1.3. Opportunity

        3.1.4. Trends

    3.2. Scenario Forecast

        3.2.1. Demand in Optimistic Scenario

        3.2.2. Demand in Likely Scenario

        3.2.3. Demand in Conservative Scenario

    3.3. Opportunity Map Analysis

    3.4. Investment Feasibility Matrix

    3.5. PESTLE and Porter’s Analysis

    3.6. Regulatory Landscape

        3.6.1. By Key Regions

        3.6.2. By Key Countries

    3.7. Regional Parent Market Outlook

4. Global Market Analysis 2016 to 2021 and Forecast, 2022 to 2032

    4.1. Historical Market Size Value (US$ Million) Analysis, 2016 to 2021

    4.2. Current and Future Market Size Value (US$ Million) Projections, 2022 to 2032

        4.2.1. Y-o-Y Growth Trend Analysis

        4.2.2. Absolute $ Opportunity Analysis

5. Global Market Analysis 2016 to 2021 and Forecast 2022 to 2032, By Printing Technology

    5.1. Introduction / Key Findings

    5.2. Historical Market Size Value (US$ Million) Analysis By Printing Technology, 2016 to 2021

    5.3. Current and Future Market Size Value (US$ Million) Analysis and Forecast By Printing Technology, 2022 to 2032

        5.3.1. Direct Thermal

        5.3.2. Thermal Transfer

        5.3.3. Others

    5.4. Y-o-Y Growth Trend Analysis By Printing Technology, 2016 to 2021

    5.5. Absolute $ Opportunity Analysis By Printing Technology, 2022 to 2032

6. Global Market Analysis 2016 to 2021 and Forecast 2022 to 2032, By Connecting Technology

    6.1. Introduction / Key Findings

    6.2. Historical Market Size Value (US$ Million) Analysis By Connecting Technology, 2016 to 2021

    6.3. Current and Future Market Size Value (US$ Million) Analysis and Forecast By Connecting Technology, 2022 to 2032

        6.3.1. Bluetooth

        6.3.2. Other Wireless Network Technology

    6.4. Y-o-Y Growth Trend Analysis By Connecting Technology, 2016 to 2021

    6.5. Absolute $ Opportunity Analysis By Connecting Technology, 2022 to 2032

7. Global Market Analysis 2016 to 2021 and Forecast 2022 to 2032, By End User Industry

    7.1. Introduction / Key Findings

    7.2. Historical Market Size Value (US$ Million) Analysis By End User Industry, 2016 to 2021

    7.3. Current and Future Market Size Value (US$ Million) Analysis and Forecast By End User Industry, 2022 to 2032

        7.3.1. Transportation & Logistics

        7.3.2. Hospitals & Healthcare

        7.3.3. Law Enforcement

        7.3.4. Manufacturing

        7.3.5. Retail

        7.3.6. Others

    7.4. Y-o-Y Growth Trend Analysis By End User Industry, 2016 to 2021

    7.5. Absolute $ Opportunity Analysis By End User Industry, 2022 to 2032

8. Global Market Analysis 2016 to 2021 and Forecast 2022 to 2032, By Region

    8.1. Introduction

    8.2. Historical Market Size Value (US$ Million) Analysis By Region, 2016 to 2021

    8.3. Current Market Size Value (US$ Million) Analysis and Forecast By Region, 2022 to 2032

        8.3.1. North America

        8.3.2. Latin America

        8.3.3. Europe

        8.3.4. South Asia

        8.3.5. East Asia

        8.3.6. Oceania

        8.3.7. Middle East and Africa(MEA)

    8.4. Market Attractiveness Analysis By Region

9. North America Market Analysis 2016 to 2021 and Forecast 2022 to 2032, By Country

    9.1. Historical Market Size Value (US$ Million) Trend Analysis By Market Taxonomy, 2016 to 2021

    9.2. Market Size Value (US$ Million) Forecast By Market Taxonomy, 2022 to 2032

        9.2.1. By Country

            9.2.1.1. USA

            9.2.1.2. Canada

        9.2.2. By Printing Technology

        9.2.3. By Connecting Technology

        9.2.4. By End User Industry

    9.3. Market Attractiveness Analysis

        9.3.1. By Country

        9.3.2. By Printing Technology

        9.3.3. By Connecting Technology

        9.3.4. By End User Industry

    9.4. Key Takeaways

10. Latin America Market Analysis 2016 to 2021 and Forecast 2022 to 2032, By Country

    10.1. Historical Market Size Value (US$ Million) Trend Analysis By Market Taxonomy, 2016 to 2021

    10.2. Market Size Value (US$ Million) Forecast By Market Taxonomy, 2022 to 2032

        10.2.1. By Country

            10.2.1.1. Brazil

            10.2.1.2. Mexico

            10.2.1.3. Rest of Latin America

        10.2.2. By Printing Technology

        10.2.3. By Connecting Technology

        10.2.4. By End User Industry

    10.3. Market Attractiveness Analysis

        10.3.1. By Country

        10.3.2. By Printing Technology

        10.3.3. By Connecting Technology

        10.3.4. By End User Industry

    10.4. Key Takeaways

11. Europe Market Analysis 2016 to 2021 and Forecast 2022 to 2032, By Country

    11.1. Historical Market Size Value (US$ Million) Trend Analysis By Market Taxonomy, 2016 to 2021

    11.2. Market Size Value (US$ Million) Forecast By Market Taxonomy, 2022 to 2032

        11.2.1. By Country

            11.2.1.1. Germany

            11.2.1.2. United Kingdom

            11.2.1.3. France

            11.2.1.4. Spain

            11.2.1.5. Italy

            11.2.1.6. Rest of Europe

        11.2.2. By Printing Technology

        11.2.3. By Connecting Technology

        11.2.4. By End User Industry

    11.3. Market Attractiveness Analysis

        11.3.1. By Country

        11.3.2. By Printing Technology

        11.3.3. By Connecting Technology

        11.3.4. By End User Industry

    11.4. Key Takeaways

12. South Asia Market Analysis 2016 to 2021 and Forecast 2022 to 2032, By Country

    12.1. Historical Market Size Value (US$ Million) Trend Analysis By Market Taxonomy, 2016 to 2021

    12.2. Market Size Value (US$ Million) Forecast By Market Taxonomy, 2022 to 2032

        12.2.1. By Country

            12.2.1.1. India

            12.2.1.2. Malaysia

            12.2.1.3. Singapore

            12.2.1.4. Thailand

            12.2.1.5. Rest of South Asia

        12.2.2. By Printing Technology

        12.2.3. By Connecting Technology

        12.2.4. By End User Industry

    12.3. Market Attractiveness Analysis

        12.3.1. By Country

        12.3.2. By Printing Technology

        12.3.3. By Connecting Technology

        12.3.4. By End User Industry

    12.4. Key Takeaways

13. East Asia Market Analysis 2016 to 2021 and Forecast 2022 to 2032, By Country

    13.1. Historical Market Size Value (US$ Million) Trend Analysis By Market Taxonomy, 2016 to 2021

    13.2. Market Size Value (US$ Million) Forecast By Market Taxonomy, 2022 to 2032

        13.2.1. By Country

            13.2.1.1. China

            13.2.1.2. Japan

            13.2.1.3. South Korea

        13.2.2. By Printing Technology

        13.2.3. By Connecting Technology

        13.2.4. By End User Industry

    13.3. Market Attractiveness Analysis

        13.3.1. By Country

        13.3.2. By Printing Technology

        13.3.3. By Connecting Technology

        13.3.4. By End User Industry

    13.4. Key Takeaways

14. Oceania Market Analysis 2016 to 2021 and Forecast 2022 to 2032, By Country

    14.1. Historical Market Size Value (US$ Million) Trend Analysis By Market Taxonomy, 2016 to 2021

    14.2. Market Size Value (US$ Million) Forecast By Market Taxonomy, 2022 to 2032

        14.2.1. By Country

            14.2.1.1. Australia

            14.2.1.2. New Zealand

        14.2.2. By Printing Technology

        14.2.3. By Connecting Technology

        14.2.4. By End User Industry

    14.3. Market Attractiveness Analysis

        14.3.1. By Country

        14.3.2. By Printing Technology

        14.3.3. By Connecting Technology

        14.3.4. By End User Industry

    14.4. Key Takeaways

15. Middle East and Africa(MEA) Market Analysis 2016 to 2021 and Forecast 2022 to 2032, By Country

    15.1. Historical Market Size Value (US$ Million) Trend Analysis By Market Taxonomy, 2016 to 2021

    15.2. Market Size Value (US$ Million) Forecast By Market Taxonomy, 2022 to 2032

        15.2.1. By Country

            15.2.1.1. GCC Countries

            15.2.1.2. South Africa

            15.2.1.3. Israel

            15.2.1.4. Rest of Middle East and Africa(MEA)

        15.2.2. By Printing Technology

        15.2.3. By Connecting Technology

        15.2.4. By End User Industry

    15.3. Market Attractiveness Analysis

        15.3.1. By Country

        15.3.2. By Printing Technology

        15.3.3. By Connecting Technology

        15.3.4. By End User Industry

    15.4. Key Takeaways

16. Key Countries Market Analysis

    16.1. USA

        16.1.1. Pricing Analysis

        16.1.2. Market Share Analysis, 2021

            16.1.2.1. By Printing Technology

            16.1.2.2. By Connecting Technology

            16.1.2.3. By End User Industry

    16.2. Canada

        16.2.1. Pricing Analysis

        16.2.2. Market Share Analysis, 2021

            16.2.2.1. By Printing Technology

            16.2.2.2. By Connecting Technology

            16.2.2.3. By End User Industry

    16.3. Brazil

        16.3.1. Pricing Analysis

        16.3.2. Market Share Analysis, 2021

            16.3.2.1. By Printing Technology

            16.3.2.2. By Connecting Technology

            16.3.2.3. By End User Industry

    16.4. Mexico

        16.4.1. Pricing Analysis

        16.4.2. Market Share Analysis, 2021

            16.4.2.1. By Printing Technology

            16.4.2.2. By Connecting Technology

            16.4.2.3. By End User Industry

    16.5. Germany

        16.5.1. Pricing Analysis

        16.5.2. Market Share Analysis, 2021

            16.5.2.1. By Printing Technology

            16.5.2.2. By Connecting Technology

            16.5.2.3. By End User Industry

    16.6. United Kingdom

        16.6.1. Pricing Analysis

        16.6.2. Market Share Analysis, 2021

            16.6.2.1. By Printing Technology

            16.6.2.2. By Connecting Technology

            16.6.2.3. By End User Industry

    16.7. France

        16.7.1. Pricing Analysis

        16.7.2. Market Share Analysis, 2021

            16.7.2.1. By Printing Technology

            16.7.2.2. By Connecting Technology

            16.7.2.3. By End User Industry

    16.8. Spain

        16.8.1. Pricing Analysis

        16.8.2. Market Share Analysis, 2021

            16.8.2.1. By Printing Technology

            16.8.2.2. By Connecting Technology

            16.8.2.3. By End User Industry

    16.9. Italy

        16.9.1. Pricing Analysis

        16.9.2. Market Share Analysis, 2021

            16.9.2.1. By Printing Technology

            16.9.2.2. By Connecting Technology

            16.9.2.3. By End User Industry ;

    16.10. India

        16.10.1. Pricing Analysis

        16.10.2. Market Share Analysis, 2021

            16.10.2.1. By Printing Technology

            16.10.2.2. By Connecting Technology

            16.10.2.3. By End User Industry

    16.11. Malaysia

        16.11.1. Pricing Analysis

        16.11.2. Market Share Analysis, 2021

            16.11.2.1. By Printing Technology

            16.11.2.2. By Connecting Technology

            16.11.2.3. By End User Industry

    16.12. Singapore

        16.12.1. Pricing Analysis

        16.12.2. Market Share Analysis, 2021

            16.12.2.1. By Printing Technology

            16.12.2.2. By Connecting Technology

            16.12.2.3. By End User Industry

    16.13. Thailand

        16.13.1. Pricing Analysis

        16.13.2. Market Share Analysis, 2021

            16.13.2.1. By Printing Technology

            16.13.2.2. By Connecting Technology

            16.13.2.3. By End User Industry

    16.14. China

        16.14.1. Pricing Analysis

        16.14.2. Market Share Analysis, 2021

            16.14.2.1. By Printing Technology

            16.14.2.2. By Connecting Technology

            16.14.2.3. By End User Industry

    16.15. Japan

        16.15.1. Pricing Analysis

        16.15.2. Market Share Analysis, 2021

            16.15.2.1. By Printing Technology

            16.15.2.2. By Connecting Technology

            16.15.2.3. By End User Industry

    16.16. South Korea

        16.16.1. Pricing Analysis

        16.16.2. Market Share Analysis, 2021

            16.16.2.1. By Printing Technology

            16.16.2.2. By Connecting Technology

            16.16.2.3. By End User Industry

    16.17. Australia

        16.17.1. Pricing Analysis

        16.17.2. Market Share Analysis, 2021

            16.17.2.1. By Printing Technology

            16.17.2.2. By Connecting Technology

            16.17.2.3. By End User Industry

    16.18. New Zealand

        16.18.1. Pricing Analysis

        16.18.2. Market Share Analysis, 2021

            16.18.2.1. By Printing Technology

            16.18.2.2. By Connecting Technology

            16.18.2.3. By End User Industry

    16.19. GCC Countries

        16.19.1. Pricing Analysis

        16.19.2. Market Share Analysis, 2021

            16.19.2.1. By Printing Technology

            16.19.2.2. By Connecting Technology

            16.19.2.3. By End User Industry

    16.20. South Africa

        16.20.1. Pricing Analysis

        16.20.2. Market Share Analysis, 2021

            16.20.2.1. By Printing Technology

            16.20.2.2. By Connecting Technology

            16.20.2.3. By End User Industry

    16.21. Israel

        16.21.1. Pricing Analysis

        16.21.2. Market Share Analysis, 2021

            16.21.2.1. By Printing Technology

            16.21.2.2. By Connecting Technology

            16.21.2.3. By End User Industry

17. Market Structure Analysis

    17.1. Competition Dashboard

    17.2. Competition Benchmarking

    17.3. Market Share Analysis of Top Players

        17.3.1. By Regional

        17.3.2. By Printing Technology

        17.3.3. By Connecting Technology

        17.3.4. By End User Industry

18. Competition Analysis

    18.1. Competition Deep Dive

        18.1.1. ZIH Corp

            18.1.1.1. Overview

            18.1.1.2. Product Portfolio

            18.1.1.3. Profitability by Market Segments

            18.1.1.4. Sales Footprint

            18.1.1.5. Strategy Overview

                18.1.1.5.1. Marketing Strategy

        18.1.2. Canon

            18.1.2.1. Overview

            18.1.2.2. Product Portfolio

            18.1.2.3. Profitability by Market Segments

            18.1.2.4. Sales Footprint

            18.1.2.5. Strategy Overview

                18.1.2.5.1. Marketing Strategy

        18.1.3. Seiko Instruments GmbH

            18.1.3.1. Overview

            18.1.3.2. Product Portfolio

            18.1.3.3. Profitability by Market Segments

            18.1.3.4. Sales Footprint

            18.1.3.5. Strategy Overview

                18.1.3.5.1. Marketing Strategy

        18.1.4. Toshiba TEC Corporation

            18.1.4.1. Overview

            18.1.4.2. Product Portfolio

            18.1.4.3. Profitability by Market Segments

            18.1.4.4. Sales Footprint

            18.1.4.5. Strategy Overview

                18.1.4.5.1. Marketing Strategy

        18.1.5. Brother United Kingdom Ltd

            18.1.5.1. Overview

            18.1.5.2. Product Portfolio

            18.1.5.3. Profitability by Market Segments

            18.1.5.4. Sales Footprint

            18.1.5.5. Strategy Overview

                18.1.5.5.1. Marketing Strategy

        18.1.6. HP Development Company

            18.1.6.1. Overview

            18.1.6.2. Product Portfolio

            18.1.6.3. Profitability by Market Segments

            18.1.6.4. Sales Footprint

            18.1.6.5. Strategy Overview

                18.1.6.5.1. Marketing Strategy

        18.1.7. L.P. Printing

            18.1.7.1. Overview

            18.1.7.2. Product Portfolio

            18.1.7.3. Profitability by Market Segments

            18.1.7.4. Sales Footprint

            18.1.7.5. Strategy Overview

                18.1.7.5.1. Marketing Strategy

        18.1.8. Epson

            18.1.8.1. Overview

            18.1.8.2. Product Portfolio

            18.1.8.3. Profitability by Market Segments

            18.1.8.4. Sales Footprint

            18.1.8.5. Strategy Overview

                18.1.8.5.1. Marketing Strategy

        18.1.9. PrinterOn Inc.

            18.1.9.1. Overview

            18.1.9.2. Product Portfolio

            18.1.9.3. Profitability by Market Segments

            18.1.9.4. Sales Footprint

            18.1.9.5. Strategy Overview

                18.1.9.5.1. Marketing Strategy

        18.1.10. Fujifilm Holdings Corporation

            18.1.10.1. Overview

            18.1.10.2. Product Portfolio

            18.1.10.3. Profitability by Market Segments

            18.1.10.4. Sales Footprint

            18.1.10.5. Strategy Overview

                18.1.10.5.1. Marketing Strategy

        18.1.11. Polaroid

            18.1.11.1. Overview

            18.1.11.2. Product Portfolio

            18.1.11.3. Profitability by Market Segments

            18.1.11.4. Sales Footprint

            18.1.11.5. Strategy Overview

                18.1.11.5.1. Marketing Strategy

19. Assumptions & Acronyms Used

20. Research Methodology

List of Tables

Table 1: Global Market Value (US$ Million) Forecast by Region, 2016 to 2032

Table 2: Global Market Value (US$ Million) Forecast by Printing Technology, 2016 to 2032

Table 3: Global Market Value (US$ Million) Forecast by Connecting Technology, 2016 to 2032

Table 4: Global Market Value (US$ Million) Forecast by End User Industry, 2016 to 2032

Table 5: North America Market Value (US$ Million) Forecast by Country, 2016 to 2032

Table 6: North America Market Value (US$ Million) Forecast by Printing Technology, 2016 to 2032

Table 7: North America Market Value (US$ Million) Forecast by Connecting Technology, 2016 to 2032

Table 8: North America Market Value (US$ Million) Forecast by End User Industry, 2016 to 2032

Table 9: Latin America Market Value (US$ Million) Forecast by Country, 2016 to 2032

Table 10: Latin America Market Value (US$ Million) Forecast by Printing Technology, 2016 to 2032

Table 11: Latin America Market Value (US$ Million) Forecast by Connecting Technology, 2016 to 2032

Table 12: Latin America Market Value (US$ Million) Forecast by End User Industry, 2016 to 2032

Table 13: Europe Market Value (US$ Million) Forecast by Country, 2016 to 2032

Table 14: Europe Market Value (US$ Million) Forecast by Printing Technology, 2016 to 2032

Table 15: Europe Market Value (US$ Million) Forecast by Connecting Technology, 2016 to 2032

Table 16: Europe Market Value (US$ Million) Forecast by End User Industry, 2016 to 2032

Table 17: South Asia Market Value (US$ Million) Forecast by Country, 2016 to 2032

Table 18: South Asia Market Value (US$ Million) Forecast by Printing Technology, 2016 to 2032

Table 19: South Asia Market Value (US$ Million) Forecast by Connecting Technology, 2016 to 2032

Table 20: South Asia Market Value (US$ Million) Forecast by End User Industry, 2016 to 2032

Table 21: East Asia Market Value (US$ Million) Forecast by Country, 2016 to 2032

Table 22: East Asia Market Value (US$ Million) Forecast by Printing Technology, 2016 to 2032

Table 23: East Asia Market Value (US$ Million) Forecast by Connecting Technology, 2016 to 2032

Table 24: East Asia Market Value (US$ Million) Forecast by End User Industry, 2016 to 2032

Table 25: Oceania Market Value (US$ Million) Forecast by Country, 2016 to 2032

Table 26: Oceania Market Value (US$ Million) Forecast by Printing Technology, 2016 to 2032

Table 27: Oceania Market Value (US$ Million) Forecast by Connecting Technology, 2016 to 2032

Table 28: Oceania Market Value (US$ Million) Forecast by End User Industry, 2016 to 2032

Table 29: MEA Market Value (US$ Million) Forecast by Country, 2016 to 2032

Table 30: MEA Market Value (US$ Million) Forecast by Printing Technology, 2016 to 2032

Table 31: MEA Market Value (US$ Million) Forecast by Connecting Technology, 2016 to 2032

Table 32: MEA Market Value (US$ Million) Forecast by End User Industry, 2016 to 2032

List of Charts

Figure 1: Global Market Value (US$ Million) by Printing Technology, 2022 to 2032

Figure 2: Global Market Value (US$ Million) by Connecting Technology, 2022 to 2032

Figure 3: Global Market Value (US$ Million) by End User Industry, 2022 to 2032

Figure 4: Global Market Value (US$ Million) by Region, 2022 to 2032

Figure 5: Global Market Value (US$ Million) Analysis by Region, 2016 to 2032

Figure 6: Global Market Value Share (%) and BPS Analysis by Region, 2022 to 2032

Figure 7: Global Market Y-o-Y Growth (%) Projections by Region, 2022 to 2032

Figure 8: Global Market Value (US$ Million) Analysis by Printing Technology, 2016 to 2032

Figure 9: Global Market Value Share (%) and BPS Analysis by Printing Technology, 2022 to 2032

Figure 10: Global Market Y-o-Y Growth (%) Projections by Printing Technology, 2022 to 2032

Figure 11: Global Market Value (US$ Million) Analysis by Connecting Technology, 2016 to 2032

Figure 12: Global Market Value Share (%) and BPS Analysis by Connecting Technology, 2022 to 2032

Figure 13: Global Market Y-o-Y Growth (%) Projections by Connecting Technology, 2022 to 2032

Figure 14: Global Market Value (US$ Million) Analysis by End User Industry, 2016 to 2032

Figure 15: Global Market Value Share (%) and BPS Analysis by End User Industry, 2022 to 2032

Figure 16: Global Market Y-o-Y Growth (%) Projections by End User Industry, 2022 to 2032

Figure 17: Global Market Attractiveness by Printing Technology, 2022 to 2032

Figure 18: Global Market Attractiveness by Connecting Technology, 2022 to 2032

Figure 19: Global Market Attractiveness by End User Industry, 2022 to 2032

Figure 20: Global Market Attractiveness by Region, 2022 to 2032

Figure 21: North America Market Value (US$ Million) by Printing Technology, 2022 to 2032

Figure 22: North America Market Value (US$ Million) by Connecting Technology, 2022 to 2032

Figure 23: North America Market Value (US$ Million) by End User Industry, 2022 to 2032

Figure 24: North America Market Value (US$ Million) by Country, 2022 to 2032

Figure 25: North America Market Value (US$ Million) Analysis by Country, 2016 to 2032

Figure 26: North America Market Value Share (%) and BPS Analysis by Country, 2022 to 2032

Figure 27: North America Market Y-o-Y Growth (%) Projections by Country, 2022 to 2032

Figure 28: North America Market Value (US$ Million) Analysis by Printing Technology, 2016 to 2032

Figure 29: North America Market Value Share (%) and BPS Analysis by Printing Technology, 2022 to 2032

Figure 30: North America Market Y-o-Y Growth (%) Projections by Printing Technology, 2022 to 2032

Figure 31: North America Market Value (US$ Million) Analysis by Connecting Technology, 2016 to 2032

Figure 32: North America Market Value Share (%) and BPS Analysis by Connecting Technology, 2022 to 2032

Figure 33: North America Market Y-o-Y Growth (%) Projections by Connecting Technology, 2022 to 2032

Figure 34: North America Market Value (US$ Million) Analysis by End User Industry, 2016 to 2032

Figure 35: North America Market Value Share (%) and BPS Analysis by End User Industry, 2022 to 2032

Figure 36: North America Market Y-o-Y Growth (%) Projections by End User Industry, 2022 to 2032

Figure 37: North America Market Attractiveness by Printing Technology, 2022 to 2032

Figure 38: North America Market Attractiveness by Connecting Technology, 2022 to 2032

Figure 39: North America Market Attractiveness by End User Industry, 2022 to 2032

Figure 40: North America Market Attractiveness by Country, 2022 to 2032

Figure 41: Latin America Market Value (US$ Million) by Printing Technology, 2022 to 2032

Figure 42: Latin America Market Value (US$ Million) by Connecting Technology, 2022 to 2032

Figure 43: Latin America Market Value (US$ Million) by End User Industry, 2022 to 2032

Figure 44: Latin America Market Value (US$ Million) by Country, 2022 to 2032

Figure 45: Latin America Market Value (US$ Million) Analysis by Country, 2016 to 2032

Figure 46: Latin America Market Value Share (%) and BPS Analysis by Country, 2022 to 2032

Figure 47: Latin America Market Y-o-Y Growth (%) Projections by Country, 2022 to 2032

Figure 48: Latin America Market Value (US$ Million) Analysis by Printing Technology, 2016 to 2032

Figure 49: Latin America Market Value Share (%) and BPS Analysis by Printing Technology, 2022 to 2032

Figure 50: Latin America Market Y-o-Y Growth (%) Projections by Printing Technology, 2022 to 2032

Figure 51: Latin America Market Value (US$ Million) Analysis by Connecting Technology, 2016 to 2032

Figure 52: Latin America Market Value Share (%) and BPS Analysis by Connecting Technology, 2022 to 2032

Figure 53: Latin America Market Y-o-Y Growth (%) Projections by Connecting Technology, 2022 to 2032

Figure 54: Latin America Market Value (US$ Million) Analysis by End User Industry, 2016 to 2032

Figure 55: Latin America Market Value Share (%) and BPS Analysis by End User Industry, 2022 to 2032

Figure 56: Latin America Market Y-o-Y Growth (%) Projections by End User Industry, 2022 to 2032

Figure 57: Latin America Market Attractiveness by Printing Technology, 2022 to 2032

Figure 58: Latin America Market Attractiveness by Connecting Technology, 2022 to 2032

Figure 59: Latin America Market Attractiveness by End User Industry, 2022 to 2032

Figure 60: Latin America Market Attractiveness by Country, 2022 to 2032

Figure 61: Europe Market Value (US$ Million) by Printing Technology, 2022 to 2032

Figure 62: Europe Market Value (US$ Million) by Connecting Technology, 2022 to 2032

Figure 63: Europe Market Value (US$ Million) by End User Industry, 2022 to 2032

Figure 64: Europe Market Value (US$ Million) by Country, 2022 to 2032

Figure 65: Europe Market Value (US$ Million) Analysis by Country, 2016 to 2032

Figure 66: Europe Market Value Share (%) and BPS Analysis by Country, 2022 to 2032

Figure 67: Europe Market Y-o-Y Growth (%) Projections by Country, 2022 to 2032

Figure 68: Europe Market Value (US$ Million) Analysis by Printing Technology, 2016 to 2032

Figure 69: Europe Market Value Share (%) and BPS Analysis by Printing Technology, 2022 to 2032

Figure 70: Europe Market Y-o-Y Growth (%) Projections by Printing Technology, 2022 to 2032

Figure 71: Europe Market Value (US$ Million) Analysis by Connecting Technology, 2016 to 2032

Figure 72: Europe Market Value Share (%) and BPS Analysis by Connecting Technology, 2022 to 2032

Figure 73: Europe Market Y-o-Y Growth (%) Projections by Connecting Technology, 2022 to 2032

Figure 74: Europe Market Value (US$ Million) Analysis by End User Industry, 2016 to 2032

Figure 75: Europe Market Value Share (%) and BPS Analysis by End User Industry, 2022 to 2032

Figure 76: Europe Market Y-o-Y Growth (%) Projections by End User Industry, 2022 to 2032

Figure 77: Europe Market Attractiveness by Printing Technology, 2022 to 2032

Figure 78: Europe Market Attractiveness by Connecting Technology, 2022 to 2032

Figure 79: Europe Market Attractiveness by End User Industry, 2022 to 2032

Figure 80: Europe Market Attractiveness by Country, 2022 to 2032

Figure 81: South Asia Market Value (US$ Million) by Printing Technology, 2022 to 2032

Figure 82: South Asia Market Value (US$ Million) by Connecting Technology, 2022 to 2032

Figure 83: South Asia Market Value (US$ Million) by End User Industry, 2022 to 2032

Figure 84: South Asia Market Value (US$ Million) by Country, 2022 to 2032

Figure 85: South Asia Market Value (US$ Million) Analysis by Country, 2016 to 2032

Figure 86: South Asia Market Value Share (%) and BPS Analysis by Country, 2022 to 2032

Figure 87: South Asia Market Y-o-Y Growth (%) Projections by Country, 2022 to 2032

Figure 88: South Asia Market Value (US$ Million) Analysis by Printing Technology, 2016 to 2032

Figure 89: South Asia Market Value Share (%) and BPS Analysis by Printing Technology, 2022 to 2032

Figure 90: South Asia Market Y-o-Y Growth (%) Projections by Printing Technology, 2022 to 2032

Figure 91: South Asia Market Value (US$ Million) Analysis by Connecting Technology, 2016 to 2032

Figure 92: South Asia Market Value Share (%) and BPS Analysis by Connecting Technology, 2022 to 2032

Figure 93: South Asia Market Y-o-Y Growth (%) Projections by Connecting Technology, 2022 to 2032

Figure 94: South Asia Market Value (US$ Million) Analysis by End User Industry, 2016 to 2032

Figure 95: South Asia Market Value Share (%) and BPS Analysis by End User Industry, 2022 to 2032

Figure 96: South Asia Market Y-o-Y Growth (%) Projections by End User Industry, 2022 to 2032

Figure 97: South Asia Market Attractiveness by Printing Technology, 2022 to 2032

Figure 98: South Asia Market Attractiveness by Connecting Technology, 2022 to 2032

Figure 99: South Asia Market Attractiveness by End User Industry, 2022 to 2032

Figure 100: South Asia Market Attractiveness by Country, 2022 to 2032

Figure 101: East Asia Market Value (US$ Million) by Printing Technology, 2022 to 2032

Figure 102: East Asia Market Value (US$ Million) by Connecting Technology, 2022 to 2032

Figure 103: East Asia Market Value (US$ Million) by End User Industry, 2022 to 2032

Figure 104: East Asia Market Value (US$ Million) by Country, 2022 to 2032

Figure 105: East Asia Market Value (US$ Million) Analysis by Country, 2016 to 2032

Figure 106: East Asia Market Value Share (%) and BPS Analysis by Country, 2022 to 2032

Figure 107: East Asia Market Y-o-Y Growth (%) Projections by Country, 2022 to 2032

Figure 108: East Asia Market Value (US$ Million) Analysis by Printing Technology, 2016 to 2032

Figure 109: East Asia Market Value Share (%) and BPS Analysis by Printing Technology, 2022 to 2032

Figure 110: East Asia Market Y-o-Y Growth (%) Projections by Printing Technology, 2022 to 2032

Figure 111: East Asia Market Value (US$ Million) Analysis by Connecting Technology, 2016 to 2032

Figure 112: East Asia Market Value Share (%) and BPS Analysis by Connecting Technology, 2022 to 2032

Figure 113: East Asia Market Y-o-Y Growth (%) Projections by Connecting Technology, 2022 to 2032

Figure 114: East Asia Market Value (US$ Million) Analysis by End User Industry, 2016 to 2032

Figure 115: East Asia Market Value Share (%) and BPS Analysis by End User Industry, 2022 to 2032

Figure 116: East Asia Market Y-o-Y Growth (%) Projections by End User Industry, 2022 to 2032

Figure 117: East Asia Market Attractiveness by Printing Technology, 2022 to 2032

Figure 118: East Asia Market Attractiveness by Connecting Technology, 2022 to 2032

Figure 119: East Asia Market Attractiveness by End User Industry, 2022 to 2032

Figure 120: East Asia Market Attractiveness by Country, 2022 to 2032

Figure 121: Oceania Market Value (US$ Million) by Printing Technology, 2022 to 2032

Figure 122: Oceania Market Value (US$ Million) by Connecting Technology, 2022 to 2032

Figure 123: Oceania Market Value (US$ Million) by End User Industry, 2022 to 2032

Figure 124: Oceania Market Value (US$ Million) by Country, 2022 to 2032

Figure 125: Oceania Market Value (US$ Million) Analysis by Country, 2016 to 2032

Figure 126: Oceania Market Value Share (%) and BPS Analysis by Country, 2022 to 2032

Figure 127: Oceania Market Y-o-Y Growth (%) Projections by Country, 2022 to 2032

Figure 128: Oceania Market Value (US$ Million) Analysis by Printing Technology, 2016 to 2032

Figure 129: Oceania Market Value Share (%) and BPS Analysis by Printing Technology, 2022 to 2032

Figure 130: Oceania Market Y-o-Y Growth (%) Projections by Printing Technology, 2022 to 2032

Figure 131: Oceania Market Value (US$ Million) Analysis by Connecting Technology, 2016 to 2032

Figure 132: Oceania Market Value Share (%) and BPS Analysis by Connecting Technology, 2022 to 2032

Figure 133: Oceania Market Y-o-Y Growth (%) Projections by Connecting Technology, 2022 to 2032

Figure 134: Oceania Market Value (US$ Million) Analysis by End User Industry, 2016 to 2032

Figure 135: Oceania Market Value Share (%) and BPS Analysis by End User Industry, 2022 to 2032

Figure 136: Oceania Market Y-o-Y Growth (%) Projections by End User Industry, 2022 to 2032

Figure 137: Oceania Market Attractiveness by Printing Technology, 2022 to 2032

Figure 138: Oceania Market Attractiveness by Connecting Technology, 2022 to 2032

Figure 139: Oceania Market Attractiveness by End User Industry, 2022 to 2032

Figure 140: Oceania Market Attractiveness by Country, 2022 to 2032

Figure 141: MEA Market Value (US$ Million) by Printing Technology, 2022 to 2032

Figure 142: MEA Market Value (US$ Million) by Connecting Technology, 2022 to 2032

Figure 143: MEA Market Value (US$ Million) by End User Industry, 2022 to 2032

Figure 144: MEA Market Value (US$ Million) by Country, 2022 to 2032

Figure 145: MEA Market Value (US$ Million) Analysis by Country, 2016 to 2032

Figure 146: MEA Market Value Share (%) and BPS Analysis by Country, 2022 to 2032

Figure 147: MEA Market Y-o-Y Growth (%) Projections by Country, 2022 to 2032

Figure 148: MEA Market Value (US$ Million) Analysis by Printing Technology, 2016 to 2032

Figure 149: MEA Market Value Share (%) and BPS Analysis by Printing Technology, 2022 to 2032

Figure 150: MEA Market Y-o-Y Growth (%) Projections by Printing Technology, 2022 to 2032

Figure 151: MEA Market Value (US$ Million) Analysis by Connecting Technology, 2016 to 2032

Figure 152: MEA Market Value Share (%) and BPS Analysis by Connecting Technology, 2022 to 2032

Figure 153: MEA Market Y-o-Y Growth (%) Projections by Connecting Technology, 2022 to 2032

Figure 154: MEA Market Value (US$ Million) Analysis by End User Industry, 2016 to 2032

Figure 155: MEA Market Value Share (%) and BPS Analysis by End User Industry, 2022 to 2032

Figure 156: MEA Market Y-o-Y Growth (%) Projections by End User Industry, 2022 to 2032

Figure 157: MEA Market Attractiveness by Printing Technology, 2022 to 2032

Figure 158: MEA Market Attractiveness by Connecting Technology, 2022 to 2032

Figure 159: MEA Market Attractiveness by End User Industry, 2022 to 2032

Figure 160: MEA Market Attractiveness by Country, 2022 to 2032

Recommendations

Technology

Thermal & Inkjet Disc Printers Market

Published : August 2023

Industrial Automation

Barcode Printers Market

Published : October 2022

Technology

Commercial Printer Market

Published : July 2022

Explore Technology Insights

View Reports