Reports

- Global Locations -

Headquarters

Future Market Insights, Inc.

Christiana Corporate, 200
Continental Drive, Suite 401,
Newark, Delaware - 19713,
United States

T: +1-845-579-5705

Americas

Future Market Insights, Inc.

616 Corporate Way, Suite 2-9018,
Valley Cottage, NY 10989, United States

T: +1-347-918-3531

MEA

Future Market Insights

1602-6 Jumeirah Bay X2 Tower, Plot No: JLT-PH2-X2A,
Jumeirah Lakes Towers, Dubai,
United Arab Emirates

Europe

Future Market Insights

3rd Floor, 207 Regent Street,
W1B 3HH London
United Kingdom

T: + 44 (0) 20 8123 9659
D: +44 (0) 20 3287 4268

Asia Pacific

Future Market Insights

IndiaLand Global Tech Park, Unit UG-1, Behind Grand HighStreet, Phase 1, Hinjawadi, MH, Pune – 411057, India

Portable Toilet Rental Market Overview for 2024 to 2034

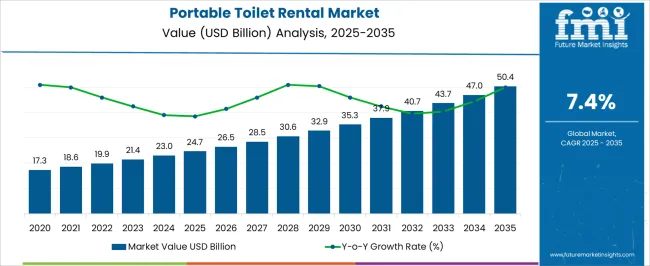
The portable toilet rental market has experienced significant growth over the past decade, and it is projected to continue with a CAGR of 7.40%.

In 2024, the market value is set to surpass an impressive US$ 22,998.20 million, exceeding expectations. Looking ahead, the market is expected to continue expanding and reach a whopping US$ 46,960.80 million by 2034. This growth is driven by two primary factors, including:

  • Increasing awareness among people about the importance of hygiene and sanitation
  • The growing demand for portable toilets at outdoor events and construction sites
Attributes Details
Portable Toilet Rental Market Value for 2024 US$ 22,998.20 million
Projected Market Value for 2034 US$ 46,960.80 million
Value-based CAGR of Market for 2024 to 2034 7.40%

Don't pay for what you don't need

Customize your report by selecting specific countries or regions and save 30%!

Portable Toilet Rental Market Dynamics

  • The market is witnessing an upsurge in demand due to growing infrastructure events in the construction sector.
  • The growth rate of the market is predicted to be positively impacted by factors such as the addition of modern technology into portable toilets. This acceleration is expected to drive market growth and create new opportunities for industry players to expand their offerings.
  • Various market players are vying for market share in this highly competitive market. They are concentrating on product development and strategic collaboration to stay ahead of the competition.
  • The rental model is a popular choice among consumers, but there is also a growing trend toward purchasing portable toilets for long-term use.
  • Industry players are focusing on offering high-quality services, excellent customer support, and after-sales service.
  • Regions like North America and Europe are the largest markets for portable toilet rentals, but Asia Pacific is predicted to grow at the fastest rate due to increasing construction and infrastructure projects.

Comparative View of Adjacent Markets

An in-depth analysis has been done with two intriguing markets alongside our main focus on the portable toilet rental market: the toilet cistern block market and the toilet rim block market. While they may seem distinct, they intersect in several ways, especially vis-à-vis hygiene and sanitation solutions.

New technology in portable toilets, like smart sensors or eco-friendly materials, can make cistern and rim block products better. Companies from different areas can work together to offer packages that include both in-place and portable toilet services. This collaboration and technology can improve the whole industry.

Portable Toilet Rental Market:

Attributes Portable Toilet Rental Market
Value-based CAGR (2024 to 2034) 7.40%
Projected Market Value (2034) US$ 46,960.80 million
Market Trend Growing preference for eco-friendly and sustainable portable toilet options
Growth Factor Convenience and cost-effectiveness of portable toilet rentals

Toilet Cistern Block Market:

Attributes Toilet Cistern Block Market
Value-based CAGR (2024 to 2034) 6.10%
Projected Market Value (2034) US$ 3,500.30 million
Market Trend Integration of smart technologies for automatic cistern block dispensing reminders
Growth Factor Consumer preference for convenient toilet maintenance products

Toilet Rim Block Market:

Attributes Toilet Rim Block Market
Value-based CAGR (2024 to 2034) 5.90%
Projected Market Value (2034) US$ 2,783.60 million
Market Trend Customization options for rim blocks to cater to different toilet types
Growth Factor Growing awareness about water conservation is leading to the adoption of water-saving rim blocks
Sudip Saha
Sudip Saha

Principal Consultant

Talk to Analyst

Find your sweet spots for generating winning opportunities in this market.

Category-wise Outlook

Standard Portable Toilets Occurred as the Top Choice for Short-term Sanitation Needs

Attributes Details
Product Type Standard Portable Toilet Rental
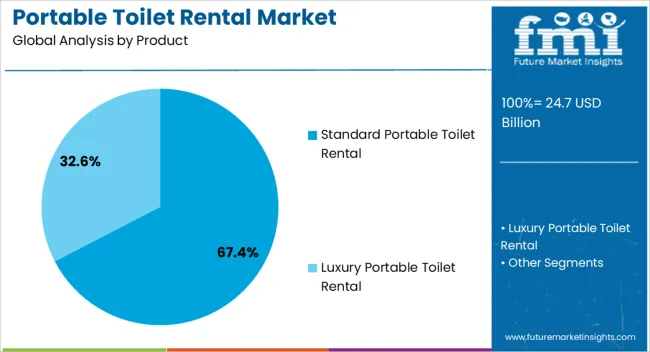
Market Share (2024) 67.40

In 2024, standard portable toilet rental is projected to hold 67.40% of the market share.

  • The standard portable toilets cater to an extensive range of events and locations. The customary versatility of portable standard toilets makes them a top choice for multiple temporary sanitation needs. The standard portable toilet is more cost-effective than multiple luxury or ADA-compliant units.
  • Rental companies often maintain large inventories of standard portable toilets due to their high demand. This widespread availability makes it easier for customers to find and rent these units, further solidifying their dominance in the market.

Temporary Portable Toilet Rentals are in High Demand for Construction Projects

Attributes Details
Application Construction
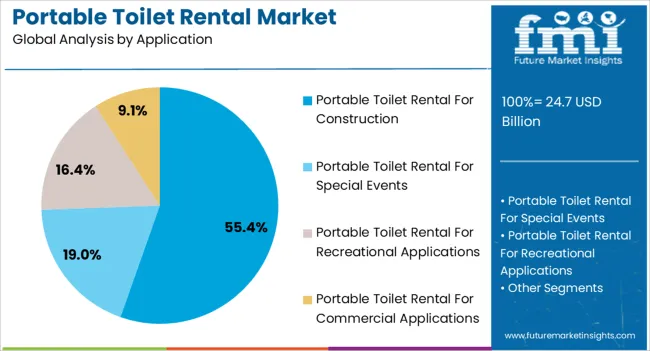
Market Share (2024) 55.40%

The construction application is projected to account for 55.40% of the market share in 2024.

  • Rising demand in the construction industry for portable toilet rentals due to project phases, workforce size, and location accessibility is driving market growth.
  • Construction projects have finite periods, necessitating short-term rental options for portable toilets. This makes them as an affordable solution.
  • Regulations mandate guidelines for adequate restroom facilities on construction project sites, driving the need for portable toilets.
  • Companies offering portable toilet rental services vie to offer innovative solutions, reliable service, and competitive pricing to secure contracts in the construction industry.

Country-wise Analysis

Countries CAGR (2024 to 2034)
United state 4.30%
Germany 2.80%
China 11.30%
India 12.80%
Australia 8.30%

Compliance with Sanitation Standards Drives Portable Toilet Rental Adoption in the United States

The forecasted CAGR for the market in the United States is expected to be 4.30%, influenced by various factors such as.

  • The growing demand for outdoor events, along with extensive construction projects requiring temporary facilities.
  • Increasing population, especially in urban areas, is leading to the need for portable toilet facilities at public gatherings.
  • Stringent regulations regarding sanitation at outdoor events and construction sites are prompting businesses and organizers to rent portable toilets to comply with standards.

Eco-friendly Focus Spurs Demand for Portable Toilets in Germany's Industries

The market is projected to develop at a CAGR of 2.80% in Germany, influenced by various factors like.

  • Strict environmental regulations push small to big event organizers and industries to opt for eco-friendly portable toilets to minimize their carbon footprint.
  • Growing urbanization leads to increased construction activities in cities, driving the demand for temporary sanitation solutions.
  • Government initiatives promoting hygiene and sanitation standards at public events and construction sites boost the portable toilet rental market.

New Portable Toilet Rental Industry Arisen in China to Serve Tourism Needs

The market is projected to progress at a CAGR of 11.30% in China over the forecast period. The proliferating tourism industry in China has contributed to the growth of portable toilet adoption. The rising demand is due to their exceptional benefits, such as toilets in various locations like public parks, tourist sites, and rest stops. This has led to the emergence of new portable toilet rental industries to cater to the needs of tourists.

Government Initiatives to Improve Sanitation in Rural Areas Propel Market Growth in India

The market in India is projected to surge at a CAGR of 12.80% through 2024, driven by various factors.

  • Governmental initiatives to improve sanitation facilities in rural areas and public places, which is leading to a significant expansion of the market.
  • The growing awareness of hygiene and sanitation among the population is leading them to choose high-quality portable toilets with advanced features such as hand sanitizers and air fresheners.

Competitive Pricing and Flexible Toilet Rental Options Attract Customers in Australia

The market is projected to inflate at a CAGR of 8.30% in Australia during the forecast period, influenced by various factors.
  • Competitive pricing and flexible rental opportunities offered by portable toilet rental corporations are attracting more customers and fueling the market's growth in Australia.
  • The market's growth is driven by the increasing focus on disaster management and emergency preparedness. Portable toilets have emerged as a viable solution for such situations, leading to an increase in demand and, therefore, market growth.

Get the data you need at a Fraction of the cost

Personalize your report by choosing insights you need
and save 40%!

Competitive Landscape

The portable toilet rental market is experiencing continuous growth, with rising demand from multiple sectors like construction, events, and outdoor activities. The market is expected to grow further due to increasing infrastructure development. The demand for eco-friendly and sustainable portable toilets is predicted to create ample opportunities for market growth.

In terms of key players in the market, B&B Portable Toilets, PolyJohn Enterprises Corporation, United Site Services Inc., Biffs, Inc., and Halco Portables are some of the prominent players. These companies are focusing on expanding their product portfolios and geographical reach to gain a competitive edge in the market. They are also investing in research and development activities to develop new and innovative products to cater to the evolving demands of customers.

Upcoming Developments in the Market

  • The incorporation of smart technologies to improve user experience and enhance hygiene.
  • The use of solar-powered portable toilets and the adoption of biodegradable materials for manufacturing portable toilets are also expected to gain traction in the market.
  • The growing trend of luxury portable toilets, equipped with air conditioning, music systems, and other advanced features, is expected to create new growth opportunities for market players.

Company Portfolio

  • B&B Portable Toilets is a leading provider of portable toilet rentals for events, construction sites, and other outdoor occasions. The company offers a variety of portable toilet options to meet the needs of its clients.
  • PolyJohn Enterprises Corporation is a manufacturer of portable restrooms, hand-washing stations, and other sanitation products. The company specializes in providing quality, durable products for industrial, commercial, and residential use.
  • United Site Services Inc. is a premier provider of portable toilet rentals, temporary fence rentals, and other site services for construction sites, special events, and other outdoor gatherings. The company offers a wide selection of products and services to meet the needs of its clients.
  • Biffs, Inc. is a provider of portable toilets, luxury restroom trailers, and other sanitation solutions for events and construction sites. The company prides itself on offering top-quality products and excellent customer service.
  • Halco Portables is a leading provider of portable toilets and other sanitation products for the construction industry, special events, and other outdoor gatherings. The company offers a wide range of products to meet the needs of its clients and is committed to providing exceptional service and support.

Key Companies

  • ADCO Group
  • B&B Portable Toilets
  • PolyJohn Enterprises Corporation
  • United Site Services Inc.
  • Biffs, Inc.
  • Halco Portables
  • Handi-Can Portable Toilets
  • West Coast Disposal Ltd.

Key Coverage

  • Market Segmentation of Portable Restroom Services
  • Market Share of Portable Restroom Rental Companies
  • Competitive Landscape in the Sanitation Market
  • Emerging Opportunities in the Portable Toilet Rental Sector
  • Sanitation Industry Aalysis
  • Portable Restroom Services Sector
  • Trends in the Global Portable Toilet Rental
  • Growth Prospects in the Portable Toilet Rental

Key Segmentation

By Product:

  • Standard Portable Toilet Rental
  • Luxury Portable Toilet Rental

By Application:

  • Portable Toilet Rental for Construction
  • Portable Toilet Rental for Special Events
  • Portable Toilet Rental for Recreational Applications
  • Portable Toilet Rental for Commercial Applications

By Technology:

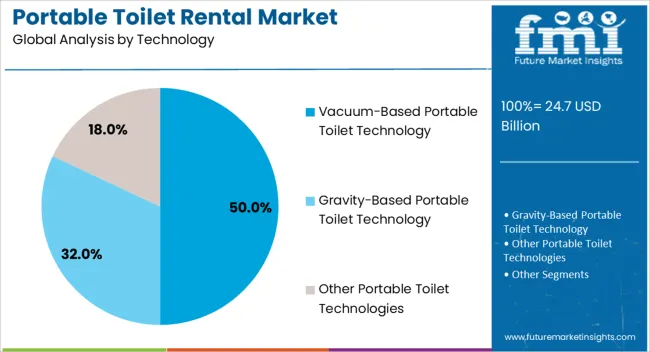
  • Vacuum-based Portable Toilet Technology
  • Gravity-based Portable Toilet Technology
  • Other Portable Toilet Technologies

By Region:

  • North America
  • Latin America
  • Europe
  • Asia Pacific
  • Middle East & Africa

Frequently Asked Questions

How Big is the Portable Toilet Rental Market?

The market size is estimated to be US$ 22,998.20 million in 2024.

At What Rate is the Portable Toilet Rental Market Expected to Grow?

The market is expected to increase at a CAGR of 7.40% over the forecast period.

What is the Scope of Portable Toilet Rental in India?

The market is expected to register a CAGR of 12.80% in India from 2024 to 2034.

What is the Future Forecast for the Portable Toilet Rental Market?

The market is forecasted to have reached a size of US$ 46,960.80 million by 2034.

Who are the Key Companies in the Market?

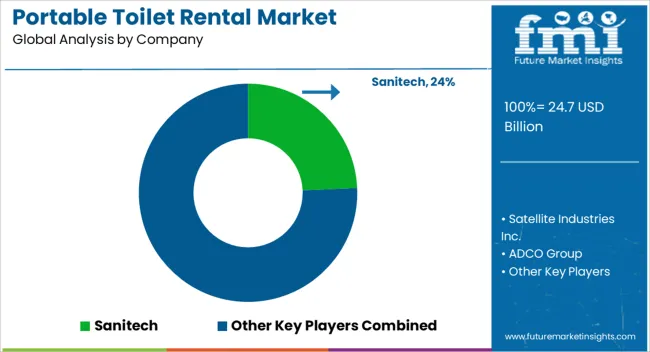
Sanitech, Satellite Industries Inc., ADCO Group, B&B Portable Toilets, PolyJohn Enterprises Corporation, United Site Services Inc., Biffs, Inc., Halco Portables, Handi-Can Portable Toilets, West Coast Disposal Ltd.

What is the Top Type of Portable Toilet Rental?

Standard portable toilet rental is the top product type in the market.

Table of Content

1. Executive Summary

    1.1. Global Market Outlook

    1.2. Demand-side Trends

    1.3. Supply-side Trends

    1.4. TechnologyRoadmap Analysis

    1.5. Analysis and Recommendations

2. Market Overview

    2.1. Market Coverage / Taxonomy

    2.2. Market Definition / Scope / Limitations

3. Market Background

    3.1. Market Dynamics

        3.1.1. Drivers

        3.1.2. Restraints

        3.1.3. Opportunity

        3.1.4. Trends

    3.2. Scenario Forecast

        3.2.1. Demand in Optimistic Scenario

        3.2.2. Demand in Likely Scenario

        3.2.3. Demand in Conservative Scenario

    3.3. Opportunity Map Analysis

    3.4. Investment Feasibility Matrix

    3.5. PESTLE and Porter’s Analysis

    3.6. Regulatory Landscape

        3.6.1. By Key Regions

        3.6.2. By Key Countries

    3.7. Regional Parent Market Outlook

4. Global Market Analysis 2019 to 2023 and Forecast, 2024 to 2034

    4.1. Historical Market Size Value (US$ Million) Analysis, 2019 to 2023

    4.2. Current and Future Market Size Value (US$ Million) Projections, 2024 to 2034

        4.2.1. Y-o-Y Growth Trend Analysis

        4.2.2. Absolute $ Opportunity Analysis

5. Global Market Analysis 2019 to 2023 and Forecast 2024 to 2034, By Product

    5.1. Introduction / Key Findings

    5.2. Historical Market Size Value (US$ Million) Analysis By Product, 2019 to 2023

    5.3. Current and Future Market Size Value (US$ Million) Analysis and Forecast By Product, 2024 to 2034

        5.3.1. Standard Portable Toilet Rental

        5.3.2. Luxury Portable Toilet Rental

    5.4. Y-o-Y Growth Trend Analysis By Product, 2019 to 2023

    5.5. Absolute $ Opportunity Analysis By Product, 2024 to 2034

6. Global Market Analysis 2019 to 2023 and Forecast 2024 to 2034, By Application

    6.1. Introduction / Key Findings

    6.2. Historical Market Size Value (US$ Million) Analysis By Application, 2019 to 2023

    6.3. Current and Future Market Size Value (US$ Million) Analysis and Forecast By Application, 2024 to 2034

        6.3.1. Construction

        6.3.2. Special Events

        6.3.3. Recreational

        6.3.4. Commercial

    6.4. Y-o-Y Growth Trend Analysis By Application, 2019 to 2023

    6.5. Absolute $ Opportunity Analysis By Application, 2024 to 2034

7. Global Market Analysis 2019 to 2023 and Forecast 2024 to 2034, By Technology

    7.1. Introduction / Key Findings

    7.2. Historical Market Size Value (US$ Million) Analysis By Technology, 2019 to 2023

    7.3. Current and Future Market Size Value (US$ Million) Analysis and Forecast By Technology, 2024 to 2034

        7.3.1. Vacuum-Based

        7.3.2. Gravity-Based

        7.3.3. Other

    7.4. Y-o-Y Growth Trend Analysis By Technology, 2019 to 2023

    7.5. Absolute $ Opportunity Analysis By Technology, 2024 to 2034

8. Global Market Analysis 2019 to 2023 and Forecast 2024 to 2034, By Region

    8.1. Introduction

    8.2. Historical Market Size Value (US$ Million) Analysis By Region, 2019 to 2023

    8.3. Current Market Size Value (US$ Million) Analysis and Forecast By Region, 2024 to 2034

        8.3.1. North America

        8.3.2. Latin America

        8.3.3. Western Europe

        8.3.4. Eastern Europe

        8.3.5. South Asia and Pacific

        8.3.6. East Asia

        8.3.7. Middle East and Africa

    8.4. Market Attractiveness Analysis By Region

9. North America Market Analysis 2019 to 2023 and Forecast 2024 to 2034, By Country

    9.1. Historical Market Size Value (US$ Million) Trend Analysis By Market Taxonomy, 2019 to 2023

    9.2. Market Size Value (US$ Million) Forecast By Market Taxonomy, 2024 to 2034

        9.2.1. By Country

            9.2.1.1. USA

            9.2.1.2. Canada

        9.2.2. By Product

        9.2.3. By Application

        9.2.4. By Technology

    9.3. Market Attractiveness Analysis

        9.3.1. By Country

        9.3.2. By Product

        9.3.3. By Application

        9.3.4. By Technology

    9.4. Key Takeaways

10. Latin America Market Analysis 2019 to 2023 and Forecast 2024 to 2034, By Country

    10.1. Historical Market Size Value (US$ Million) Trend Analysis By Market Taxonomy, 2019 to 2023

    10.2. Market Size Value (US$ Million) Forecast By Market Taxonomy, 2024 to 2034

        10.2.1. By Country

            10.2.1.1. Brazil

            10.2.1.2. Mexico

            10.2.1.3. Rest of Latin America

        10.2.2. By Product

        10.2.3. By Application

        10.2.4. By Technology

    10.3. Market Attractiveness Analysis

        10.3.1. By Country

        10.3.2. By Product

        10.3.3. By Application

        10.3.4. By Technology

    10.4. Key Takeaways

11. Western Europe Market Analysis 2019 to 2023 and Forecast 2024 to 2034, By Country

    11.1. Historical Market Size Value (US$ Million) Trend Analysis By Market Taxonomy, 2019 to 2023

    11.2. Market Size Value (US$ Million) Forecast By Market Taxonomy, 2024 to 2034

        11.2.1. By Country

            11.2.1.1. Germany

            11.2.1.2. UK

            11.2.1.3. France

            11.2.1.4. Spain

            11.2.1.5. Italy

            11.2.1.6. Rest of Western Europe

        11.2.2. By Product

        11.2.3. By Application

        11.2.4. By Technology

    11.3. Market Attractiveness Analysis

        11.3.1. By Country

        11.3.2. By Product

        11.3.3. By Application

        11.3.4. By Technology

    11.4. Key Takeaways

12. Eastern Europe Market Analysis 2019 to 2023 and Forecast 2024 to 2034, By Country

    12.1. Historical Market Size Value (US$ Million) Trend Analysis By Market Taxonomy, 2019 to 2023

    12.2. Market Size Value (US$ Million) Forecast By Market Taxonomy, 2024 to 2034

        12.2.1. By Country

            12.2.1.1. Poland

            12.2.1.2. Russia

            12.2.1.3. Czech Republic

            12.2.1.4. Romania

            12.2.1.5. Rest of Eastern Europe

        12.2.2. By Product

        12.2.3. By Application

        12.2.4. By Technology

    12.3. Market Attractiveness Analysis

        12.3.1. By Country

        12.3.2. By Product

        12.3.3. By Application

        12.3.4. By Technology

    12.4. Key Takeaways

13. South Asia and Pacific Market Analysis 2019 to 2023 and Forecast 2024 to 2034, By Country

    13.1. Historical Market Size Value (US$ Million) Trend Analysis By Market Taxonomy, 2019 to 2023

    13.2. Market Size Value (US$ Million) Forecast By Market Taxonomy, 2024 to 2034

        13.2.1. By Country

            13.2.1.1. India

            13.2.1.2. Bangladesh

            13.2.1.3. Australia

            13.2.1.4. New Zealand

            13.2.1.5. Rest of South Asia and Pacific

        13.2.2. By Product

        13.2.3. By Application

        13.2.4. By Technology

    13.3. Market Attractiveness Analysis

        13.3.1. By Country

        13.3.2. By Product

        13.3.3. By Application

        13.3.4. By Technology

    13.4. Key Takeaways

14. East Asia Market Analysis 2019 to 2023 and Forecast 2024 to 2034, By Country

    14.1. Historical Market Size Value (US$ Million) Trend Analysis By Market Taxonomy, 2019 to 2023

    14.2. Market Size Value (US$ Million) Forecast By Market Taxonomy, 2024 to 2034

        14.2.1. By Country

            14.2.1.1. China

            14.2.1.2. Japan

            14.2.1.3. South Korea

        14.2.2. By Product

        14.2.3. By Application

        14.2.4. By Technology

    14.3. Market Attractiveness Analysis

        14.3.1. By Country

        14.3.2. By Product

        14.3.3. By Application

        14.3.4. By Technology

    14.4. Key Takeaways

15. Middle East and Africa Market Analysis 2019 to 2023 and Forecast 2024 to 2034, By Country

    15.1. Historical Market Size Value (US$ Million) Trend Analysis By Market Taxonomy, 2019 to 2023

    15.2. Market Size Value (US$ Million) Forecast By Market Taxonomy, 2024 to 2034

        15.2.1. By Country

            15.2.1.1. GCC Countries

            15.2.1.2. South Africa

            15.2.1.3. Israel

            15.2.1.4. Rest of MEA

        15.2.2. By Product

        15.2.3. By Application

        15.2.4. By Technology

    15.3. Market Attractiveness Analysis

        15.3.1. By Country

        15.3.2. By Product

        15.3.3. By Application

        15.3.4. By Technology

    15.4. Key Takeaways

16. Key Countries Market Analysis

    16.1. USA

        16.1.1. Pricing Analysis

        16.1.2. Market Share Analysis, 2023

            16.1.2.1. By Product

            16.1.2.2. By Application

            16.1.2.3. By Technology

    16.2. Canada

        16.2.1. Pricing Analysis

        16.2.2. Market Share Analysis, 2023

            16.2.2.1. By Product

            16.2.2.2. By Application

            16.2.2.3. By Technology

    16.3. Brazil

        16.3.1. Pricing Analysis

        16.3.2. Market Share Analysis, 2023

            16.3.2.1. By Product

            16.3.2.2. By Application

            16.3.2.3. By Technology

    16.4. Mexico

        16.4.1. Pricing Analysis

        16.4.2. Market Share Analysis, 2023

            16.4.2.1. By Product

            16.4.2.2. By Application

            16.4.2.3. By Technology

    16.5. Germany

        16.5.1. Pricing Analysis

        16.5.2. Market Share Analysis, 2023

            16.5.2.1. By Product

            16.5.2.2. By Application

            16.5.2.3. By Technology

    16.6. UK

        16.6.1. Pricing Analysis

        16.6.2. Market Share Analysis, 2023

            16.6.2.1. By Product

            16.6.2.2. By Application

            16.6.2.3. By Technology

    16.7. France

        16.7.1. Pricing Analysis

        16.7.2. Market Share Analysis, 2023

            16.7.2.1. By Product

            16.7.2.2. By Application

            16.7.2.3. By Technology

    16.8. Spain

        16.8.1. Pricing Analysis

        16.8.2. Market Share Analysis, 2023

            16.8.2.1. By Product

            16.8.2.2. By Application

            16.8.2.3. By Technology

    16.9. Italy

        16.9.1. Pricing Analysis

        16.9.2. Market Share Analysis, 2023

            16.9.2.1. By Product

            16.9.2.2. By Application

            16.9.2.3. By Technology

    16.10. Poland

        16.10.1. Pricing Analysis

        16.10.2. Market Share Analysis, 2023

            16.10.2.1. By Product

            16.10.2.2. By Application

            16.10.2.3. By Technology

    16.11. Russia

        16.11.1. Pricing Analysis

        16.11.2. Market Share Analysis, 2023

            16.11.2.1. By Product

            16.11.2.2. By Application

            16.11.2.3. By Technology

    16.12. Czech Republic

        16.12.1. Pricing Analysis

        16.12.2. Market Share Analysis, 2023

            16.12.2.1. By Product

            16.12.2.2. By Application

            16.12.2.3. By Technology

    16.13. Romania

        16.13.1. Pricing Analysis

        16.13.2. Market Share Analysis, 2023

            16.13.2.1. By Product

            16.13.2.2. By Application

            16.13.2.3. By Technology

    16.14. India

        16.14.1. Pricing Analysis

        16.14.2. Market Share Analysis, 2023

            16.14.2.1. By Product

            16.14.2.2. By Application

            16.14.2.3. By Technology

    16.15. Bangladesh

        16.15.1. Pricing Analysis

        16.15.2. Market Share Analysis, 2023

            16.15.2.1. By Product

            16.15.2.2. By Application

            16.15.2.3. By Technology

    16.16. Australia

        16.16.1. Pricing Analysis

        16.16.2. Market Share Analysis, 2023

            16.16.2.1. By Product

            16.16.2.2. By Application

            16.16.2.3. By Technology

    16.17. New Zealand

        16.17.1. Pricing Analysis

        16.17.2. Market Share Analysis, 2023

            16.17.2.1. By Product

            16.17.2.2. By Application

            16.17.2.3. By Technology

    16.18. China

        16.18.1. Pricing Analysis

        16.18.2. Market Share Analysis, 2023

            16.18.2.1. By Product

            16.18.2.2. By Application

            16.18.2.3. By Technology

    16.19. Japan

        16.19.1. Pricing Analysis

        16.19.2. Market Share Analysis, 2023

            16.19.2.1. By Product

            16.19.2.2. By Application

            16.19.2.3. By Technology

    16.20. South Korea

        16.20.1. Pricing Analysis

        16.20.2. Market Share Analysis, 2023

            16.20.2.1. By Product

            16.20.2.2. By Application

            16.20.2.3. By Technology

    16.21. GCC Countries

        16.21.1. Pricing Analysis

        16.21.2. Market Share Analysis, 2023

            16.21.2.1. By Product

            16.21.2.2. By Application

            16.21.2.3. By Technology

    16.22. South Africa

        16.22.1. Pricing Analysis

        16.22.2. Market Share Analysis, 2023

            16.22.2.1. By Product

            16.22.2.2. By Application

            16.22.2.3. By Technology

    16.23. Israel

        16.23.1. Pricing Analysis

        16.23.2. Market Share Analysis, 2023

            16.23.2.1. By Product

            16.23.2.2. By Application

            16.23.2.3. By Technology

17. Market Structure Analysis

    17.1. Competition Dashboard

    17.2. Competition Benchmarking

    17.3. Market Share Analysis of Top Players

        17.3.1. By Regional

        17.3.2. By Product

        17.3.3. By Application

        17.3.4. By Technology

18. Competition Analysis

    18.1. Competition Deep Dive

        18.1.1. Sanitech

            18.1.1.1. Overview

            18.1.1.2. Product Portfolio

            18.1.1.3. Profitability by Market Segments

            18.1.1.4. Sales Footprint

            18.1.1.5. Strategy Overview

                18.1.1.5.1. Marketing Strategy

        18.1.2. Satellite Industries Inc.

            18.1.2.1. Overview

            18.1.2.2. Product Portfolio

            18.1.2.3. Profitability by Market Segments

            18.1.2.4. Sales Footprint

            18.1.2.5. Strategy Overview

                18.1.2.5.1. Marketing Strategy

        18.1.3. ADCO Group

            18.1.3.1. Overview

            18.1.3.2. Product Portfolio

            18.1.3.3. Profitability by Market Segments

            18.1.3.4. Sales Footprint

            18.1.3.5. Strategy Overview

                18.1.3.5.1. Marketing Strategy

        18.1.4. B&B Portable Toilets

            18.1.4.1. Overview

            18.1.4.2. Product Portfolio

            18.1.4.3. Profitability by Market Segments

            18.1.4.4. Sales Footprint

            18.1.4.5. Strategy Overview

                18.1.4.5.1. Marketing Strategy

        18.1.5. PolyJohn Enterprises Corporation

            18.1.5.1. Overview

            18.1.5.2. Product Portfolio

            18.1.5.3. Profitability by Market Segments

            18.1.5.4. Sales Footprint

            18.1.5.5. Strategy Overview

                18.1.5.5.1. Marketing Strategy

        18.1.6. Biffs, Inc.

            18.1.6.1. Overview

            18.1.6.2. Product Portfolio

            18.1.6.3. Profitability by Market Segments

            18.1.6.4. Sales Footprint

            18.1.6.5. Strategy Overview

                18.1.6.5.1. Marketing Strategy

        18.1.7. Halco Portables

            18.1.7.1. Overview

            18.1.7.2. Product Portfolio

            18.1.7.3. Profitability by Market Segments

            18.1.7.4. Sales Footprint

            18.1.7.5. Strategy Overview

                18.1.7.5.1. Marketing Strategy

        18.1.8. Handi-Can Portable Toilets

            18.1.8.1. Overview

            18.1.8.2. Product Portfolio

            18.1.8.3. Profitability by Market Segments

            18.1.8.4. Sales Footprint

            18.1.8.5. Strategy Overview

                18.1.8.5.1. Marketing Strategy

        18.1.9. West Coast Disposal Ltd.

            18.1.9.1. Overview

            18.1.9.2. Product Portfolio

            18.1.9.3. Profitability by Market Segments

            18.1.9.4. Sales Footprint

            18.1.9.5. Strategy Overview

                18.1.9.5.1. Marketing Strategy

        18.1.10. United Site Services Inc.

            18.1.10.1. Overview

            18.1.10.2. Product Portfolio

            18.1.10.3. Profitability by Market Segments

            18.1.10.4. Sales Footprint

            18.1.10.5. Strategy Overview

                18.1.10.5.1. Marketing Strategy

19. Assumptions & Acronyms Used

20. Research Methodolog

List of Tables

Table 1: Global Market Value (US$ Million) Forecast by Region, 2019 to 2034

Table 2: Global Market Value (US$ Million) Forecast by Product, 2019 to 2034

Table 3: Global Market Value (US$ Million) Forecast by Application, 2019 to 2034

Table 4: Global Market Value (US$ Million) Forecast by Technology, 2019 to 2034

Table 5: North America Market Value (US$ Million) Forecast by Country, 2019 to 2034

Table 6: North America Market Value (US$ Million) Forecast by Product, 2019 to 2034

Table 7: North America Market Value (US$ Million) Forecast by Application, 2019 to 2034

Table 8: North America Market Value (US$ Million) Forecast by Technology, 2019 to 2034

Table 9: Latin America Market Value (US$ Million) Forecast by Country, 2019 to 2034

Table 10: Latin America Market Value (US$ Million) Forecast by Product, 2019 to 2034

Table 11: Latin America Market Value (US$ Million) Forecast by Application, 2019 to 2034

Table 12: Latin America Market Value (US$ Million) Forecast by Technology, 2019 to 2034

Table 13: Western Europe Market Value (US$ Million) Forecast by Country, 2019 to 2034

Table 14: Western Europe Market Value (US$ Million) Forecast by Product, 2019 to 2034

Table 15: Western Europe Market Value (US$ Million) Forecast by Application, 2019 to 2034

Table 16: Western Europe Market Value (US$ Million) Forecast by Technology, 2019 to 2034

Table 17: Eastern Europe Market Value (US$ Million) Forecast by Country, 2019 to 2034

Table 18: Eastern Europe Market Value (US$ Million) Forecast by Product, 2019 to 2034

Table 19: Eastern Europe Market Value (US$ Million) Forecast by Application, 2019 to 2034

Table 20: Eastern Europe Market Value (US$ Million) Forecast by Technology, 2019 to 2034

Table 21: South Asia and Pacific Market Value (US$ Million) Forecast by Country, 2019 to 2034

Table 22: South Asia and Pacific Market Value (US$ Million) Forecast by Product, 2019 to 2034

Table 23: South Asia and Pacific Market Value (US$ Million) Forecast by Application, 2019 to 2034

Table 24: South Asia and Pacific Market Value (US$ Million) Forecast by Technology, 2019 to 2034

Table 25: East Asia Market Value (US$ Million) Forecast by Country, 2019 to 2034

Table 26: East Asia Market Value (US$ Million) Forecast by Product, 2019 to 2034

Table 27: East Asia Market Value (US$ Million) Forecast by Application, 2019 to 2034

Table 28: East Asia Market Value (US$ Million) Forecast by Technology, 2019 to 2034

Table 29: Middle East and Africa Market Value (US$ Million) Forecast by Country, 2019 to 2034

Table 30: Middle East and Africa Market Value (US$ Million) Forecast by Product, 2019 to 2034

Table 31: Middle East and Africa Market Value (US$ Million) Forecast by Application, 2019 to 2034

Table 32: Middle East and Africa Market Value (US$ Million) Forecast by Technology, 2019 to 2034

List of Charts

Figure 1: Global Market Value (US$ Million) by Product, 2024 to 2034

Figure 2: Global Market Value (US$ Million) by Application, 2024 to 2034

Figure 3: Global Market Value (US$ Million) by Technology, 2024 to 2034

Figure 4: Global Market Value (US$ Million) by Region, 2024 to 2034

Figure 5: Global Market Value (US$ Million) Analysis by Region, 2019 to 2034

Figure 6: Global Market Value Share (%) and BPS Analysis by Region, 2024 to 2034

Figure 7: Global Market Y-o-Y Growth (%) Projections by Region, 2024 to 2034

Figure 8: Global Market Value (US$ Million) Analysis by Product, 2019 to 2034

Figure 9: Global Market Value Share (%) and BPS Analysis by Product, 2024 to 2034

Figure 10: Global Market Y-o-Y Growth (%) Projections by Product, 2024 to 2034

Figure 11: Global Market Value (US$ Million) Analysis by Application, 2019 to 2034

Figure 12: Global Market Value Share (%) and BPS Analysis by Application, 2024 to 2034

Figure 13: Global Market Y-o-Y Growth (%) Projections by Application, 2024 to 2034

Figure 14: Global Market Value (US$ Million) Analysis by Technology, 2019 to 2034

Figure 15: Global Market Value Share (%) and BPS Analysis by Technology, 2024 to 2034

Figure 16: Global Market Y-o-Y Growth (%) Projections by Technology, 2024 to 2034

Figure 17: Global Market Attractiveness by Product, 2024 to 2034

Figure 18: Global Market Attractiveness by Application, 2024 to 2034

Figure 19: Global Market Attractiveness by Technology, 2024 to 2034

Figure 20: Global Market Attractiveness by Region, 2024 to 2034

Figure 21: North America Market Value (US$ Million) by Product, 2024 to 2034

Figure 22: North America Market Value (US$ Million) by Application, 2024 to 2034

Figure 23: North America Market Value (US$ Million) by Technology, 2024 to 2034

Figure 24: North America Market Value (US$ Million) by Country, 2024 to 2034

Figure 25: North America Market Value (US$ Million) Analysis by Country, 2019 to 2034

Figure 26: North America Market Value Share (%) and BPS Analysis by Country, 2024 to 2034

Figure 27: North America Market Y-o-Y Growth (%) Projections by Country, 2024 to 2034

Figure 28: North America Market Value (US$ Million) Analysis by Product, 2019 to 2034

Figure 29: North America Market Value Share (%) and BPS Analysis by Product, 2024 to 2034

Figure 30: North America Market Y-o-Y Growth (%) Projections by Product, 2024 to 2034

Figure 31: North America Market Value (US$ Million) Analysis by Application, 2019 to 2034

Figure 32: North America Market Value Share (%) and BPS Analysis by Application, 2024 to 2034

Figure 33: North America Market Y-o-Y Growth (%) Projections by Application, 2024 to 2034

Figure 34: North America Market Value (US$ Million) Analysis by Technology, 2019 to 2034

Figure 35: North America Market Value Share (%) and BPS Analysis by Technology, 2024 to 2034

Figure 36: North America Market Y-o-Y Growth (%) Projections by Technology, 2024 to 2034

Figure 37: North America Market Attractiveness by Product, 2024 to 2034

Figure 38: North America Market Attractiveness by Application, 2024 to 2034

Figure 39: North America Market Attractiveness by Technology, 2024 to 2034

Figure 40: North America Market Attractiveness by Country, 2024 to 2034

Figure 41: Latin America Market Value (US$ Million) by Product, 2024 to 2034

Figure 42: Latin America Market Value (US$ Million) by Application, 2024 to 2034

Figure 43: Latin America Market Value (US$ Million) by Technology, 2024 to 2034

Figure 44: Latin America Market Value (US$ Million) by Country, 2024 to 2034

Figure 45: Latin America Market Value (US$ Million) Analysis by Country, 2019 to 2034

Figure 46: Latin America Market Value Share (%) and BPS Analysis by Country, 2024 to 2034

Figure 47: Latin America Market Y-o-Y Growth (%) Projections by Country, 2024 to 2034

Figure 48: Latin America Market Value (US$ Million) Analysis by Product, 2019 to 2034

Figure 49: Latin America Market Value Share (%) and BPS Analysis by Product, 2024 to 2034

Figure 50: Latin America Market Y-o-Y Growth (%) Projections by Product, 2024 to 2034

Figure 51: Latin America Market Value (US$ Million) Analysis by Application, 2019 to 2034

Figure 52: Latin America Market Value Share (%) and BPS Analysis by Application, 2024 to 2034

Figure 53: Latin America Market Y-o-Y Growth (%) Projections by Application, 2024 to 2034

Figure 54: Latin America Market Value (US$ Million) Analysis by Technology, 2019 to 2034

Figure 55: Latin America Market Value Share (%) and BPS Analysis by Technology, 2024 to 2034

Figure 56: Latin America Market Y-o-Y Growth (%) Projections by Technology, 2024 to 2034

Figure 57: Latin America Market Attractiveness by Product, 2024 to 2034

Figure 58: Latin America Market Attractiveness by Application, 2024 to 2034

Figure 59: Latin America Market Attractiveness by Technology, 2024 to 2034

Figure 60: Latin America Market Attractiveness by Country, 2024 to 2034

Figure 61: Western Europe Market Value (US$ Million) by Product, 2024 to 2034

Figure 62: Western Europe Market Value (US$ Million) by Application, 2024 to 2034

Figure 63: Western Europe Market Value (US$ Million) by Technology, 2024 to 2034

Figure 64: Western Europe Market Value (US$ Million) by Country, 2024 to 2034

Figure 65: Western Europe Market Value (US$ Million) Analysis by Country, 2019 to 2034

Figure 66: Western Europe Market Value Share (%) and BPS Analysis by Country, 2024 to 2034

Figure 67: Western Europe Market Y-o-Y Growth (%) Projections by Country, 2024 to 2034

Figure 68: Western Europe Market Value (US$ Million) Analysis by Product, 2019 to 2034

Figure 69: Western Europe Market Value Share (%) and BPS Analysis by Product, 2024 to 2034

Figure 70: Western Europe Market Y-o-Y Growth (%) Projections by Product, 2024 to 2034

Figure 71: Western Europe Market Value (US$ Million) Analysis by Application, 2019 to 2034

Figure 72: Western Europe Market Value Share (%) and BPS Analysis by Application, 2024 to 2034

Figure 73: Western Europe Market Y-o-Y Growth (%) Projections by Application, 2024 to 2034

Figure 74: Western Europe Market Value (US$ Million) Analysis by Technology, 2019 to 2034

Figure 75: Western Europe Market Value Share (%) and BPS Analysis by Technology, 2024 to 2034

Figure 76: Western Europe Market Y-o-Y Growth (%) Projections by Technology, 2024 to 2034

Figure 77: Western Europe Market Attractiveness by Product, 2024 to 2034

Figure 78: Western Europe Market Attractiveness by Application, 2024 to 2034

Figure 79: Western Europe Market Attractiveness by Technology, 2024 to 2034

Figure 80: Western Europe Market Attractiveness by Country, 2024 to 2034

Figure 81: Eastern Europe Market Value (US$ Million) by Product, 2024 to 2034

Figure 82: Eastern Europe Market Value (US$ Million) by Application, 2024 to 2034

Figure 83: Eastern Europe Market Value (US$ Million) by Technology, 2024 to 2034

Figure 84: Eastern Europe Market Value (US$ Million) by Country, 2024 to 2034

Figure 85: Eastern Europe Market Value (US$ Million) Analysis by Country, 2019 to 2034

Figure 86: Eastern Europe Market Value Share (%) and BPS Analysis by Country, 2024 to 2034

Figure 87: Eastern Europe Market Y-o-Y Growth (%) Projections by Country, 2024 to 2034

Figure 88: Eastern Europe Market Value (US$ Million) Analysis by Product, 2019 to 2034

Figure 89: Eastern Europe Market Value Share (%) and BPS Analysis by Product, 2024 to 2034

Figure 90: Eastern Europe Market Y-o-Y Growth (%) Projections by Product, 2024 to 2034

Figure 91: Eastern Europe Market Value (US$ Million) Analysis by Application, 2019 to 2034

Figure 92: Eastern Europe Market Value Share (%) and BPS Analysis by Application, 2024 to 2034

Figure 93: Eastern Europe Market Y-o-Y Growth (%) Projections by Application, 2024 to 2034

Figure 94: Eastern Europe Market Value (US$ Million) Analysis by Technology, 2019 to 2034

Figure 95: Eastern Europe Market Value Share (%) and BPS Analysis by Technology, 2024 to 2034

Figure 96: Eastern Europe Market Y-o-Y Growth (%) Projections by Technology, 2024 to 2034

Figure 97: Eastern Europe Market Attractiveness by Product, 2024 to 2034

Figure 98: Eastern Europe Market Attractiveness by Application, 2024 to 2034

Figure 99: Eastern Europe Market Attractiveness by Technology, 2024 to 2034

Figure 100: Eastern Europe Market Attractiveness by Country, 2024 to 2034

Figure 101: South Asia and Pacific Market Value (US$ Million) by Product, 2024 to 2034

Figure 102: South Asia and Pacific Market Value (US$ Million) by Application, 2024 to 2034

Figure 103: South Asia and Pacific Market Value (US$ Million) by Technology, 2024 to 2034

Figure 104: South Asia and Pacific Market Value (US$ Million) by Country, 2024 to 2034

Figure 105: South Asia and Pacific Market Value (US$ Million) Analysis by Country, 2019 to 2034

Figure 106: South Asia and Pacific Market Value Share (%) and BPS Analysis by Country, 2024 to 2034

Figure 107: South Asia and Pacific Market Y-o-Y Growth (%) Projections by Country, 2024 to 2034

Figure 108: South Asia and Pacific Market Value (US$ Million) Analysis by Product, 2019 to 2034

Figure 109: South Asia and Pacific Market Value Share (%) and BPS Analysis by Product, 2024 to 2034

Figure 110: South Asia and Pacific Market Y-o-Y Growth (%) Projections by Product, 2024 to 2034

Figure 111: South Asia and Pacific Market Value (US$ Million) Analysis by Application, 2019 to 2034

Figure 112: South Asia and Pacific Market Value Share (%) and BPS Analysis by Application, 2024 to 2034

Figure 113: South Asia and Pacific Market Y-o-Y Growth (%) Projections by Application, 2024 to 2034

Figure 114: South Asia and Pacific Market Value (US$ Million) Analysis by Technology, 2019 to 2034

Figure 115: South Asia and Pacific Market Value Share (%) and BPS Analysis by Technology, 2024 to 2034

Figure 116: South Asia and Pacific Market Y-o-Y Growth (%) Projections by Technology, 2024 to 2034

Figure 117: South Asia and Pacific Market Attractiveness by Product, 2024 to 2034

Figure 118: South Asia and Pacific Market Attractiveness by Application, 2024 to 2034

Figure 119: South Asia and Pacific Market Attractiveness by Technology, 2024 to 2034

Figure 120: South Asia and Pacific Market Attractiveness by Country, 2024 to 2034

Figure 121: East Asia Market Value (US$ Million) by Product, 2024 to 2034

Figure 122: East Asia Market Value (US$ Million) by Application, 2024 to 2034

Figure 123: East Asia Market Value (US$ Million) by Technology, 2024 to 2034

Figure 124: East Asia Market Value (US$ Million) by Country, 2024 to 2034

Figure 125: East Asia Market Value (US$ Million) Analysis by Country, 2019 to 2034

Figure 126: East Asia Market Value Share (%) and BPS Analysis by Country, 2024 to 2034

Figure 127: East Asia Market Y-o-Y Growth (%) Projections by Country, 2024 to 2034

Figure 128: East Asia Market Value (US$ Million) Analysis by Product, 2019 to 2034

Figure 129: East Asia Market Value Share (%) and BPS Analysis by Product, 2024 to 2034

Figure 130: East Asia Market Y-o-Y Growth (%) Projections by Product, 2024 to 2034

Figure 131: East Asia Market Value (US$ Million) Analysis by Application, 2019 to 2034

Figure 132: East Asia Market Value Share (%) and BPS Analysis by Application, 2024 to 2034

Figure 133: East Asia Market Y-o-Y Growth (%) Projections by Application, 2024 to 2034

Figure 134: East Asia Market Value (US$ Million) Analysis by Technology, 2019 to 2034

Figure 135: East Asia Market Value Share (%) and BPS Analysis by Technology, 2024 to 2034

Figure 136: East Asia Market Y-o-Y Growth (%) Projections by Technology, 2024 to 2034

Figure 137: East Asia Market Attractiveness by Product, 2024 to 2034

Figure 138: East Asia Market Attractiveness by Application, 2024 to 2034

Figure 139: East Asia Market Attractiveness by Technology, 2024 to 2034

Figure 140: East Asia Market Attractiveness by Country, 2024 to 2034

Figure 141: Middle East and Africa Market Value (US$ Million) by Product, 2024 to 2034

Figure 142: Middle East and Africa Market Value (US$ Million) by Application, 2024 to 2034

Figure 143: Middle East and Africa Market Value (US$ Million) by Technology, 2024 to 2034

Figure 144: Middle East and Africa Market Value (US$ Million) by Country, 2024 to 2034

Figure 145: Middle East and Africa Market Value (US$ Million) Analysis by Country, 2019 to 2034

Figure 146: Middle East and Africa Market Value Share (%) and BPS Analysis by Country, 2024 to 2034

Figure 147: Middle East and Africa Market Y-o-Y Growth (%) Projections by Country, 2024 to 2034

Figure 148: Middle East and Africa Market Value (US$ Million) Analysis by Product, 2019 to 2034

Figure 149: Middle East and Africa Market Value Share (%) and BPS Analysis by Product, 2024 to 2034

Figure 150: Middle East and Africa Market Y-o-Y Growth (%) Projections by Product, 2024 to 2034

Figure 151: Middle East and Africa Market Value (US$ Million) Analysis by Application, 2019 to 2034

Figure 152: Middle East and Africa Market Value Share (%) and BPS Analysis by Application, 2024 to 2034

Figure 153: Middle East and Africa Market Y-o-Y Growth (%) Projections by Application, 2024 to 2034

Figure 154: Middle East and Africa Market Value (US$ Million) Analysis by Technology, 2019 to 2034

Figure 155: Middle East and Africa Market Value Share (%) and BPS Analysis by Technology, 2024 to 2034

Figure 156: Middle East and Africa Market Y-o-Y Growth (%) Projections by Technology, 2024 to 2034

Figure 157: Middle East and Africa Market Attractiveness by Product, 2024 to 2034

Figure 158: Middle East and Africa Market Attractiveness by Application, 2024 to 2034

Figure 159: Middle East and Africa Market Attractiveness by Technology, 2024 to 2034

Figure 160: Middle East and Africa Market Attractiveness by Country, 2024 to 2034

Recommendations

Consumer Product

Toilet Cistern Block Market

Published : November 2023

Consumer Product

Toilet Rim Block Market

Published : November 2023

Consumer Product

Toilet Care Wipes Market

Published : June 2022

Explore Consumer Product Insights

View Reports

Portable Toilet Rental Market