Portable Charging Units Market Size and Share Forecast Outlook 2025 to 2035

The Portable Charging Units Market is estimated to be valued at USD 7.5 billion in 2025 and is projected to reach USD 19.5 billion by 2035, registering a compound annual growth rate (CAGR) of 10.0% over the forecast period.
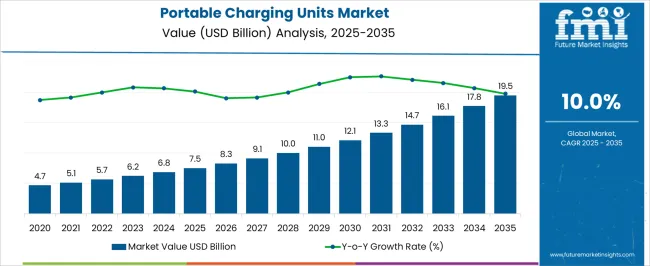
Quick Stats for Portable Charging Units Market

  • Portable Charging Units Market Value (2025): USD 7.5 billion
  • Portable Charging Units Market Forecast Value (2035): USD 19.5 billion
  • Portable Charging Units Market Forecast CAGR: 10.0%
  • Leading Segment in Portable Charging Units Market in 2025: 1,000 mAh-3,000 mAh (35.6%)
  • Key Growth Regions in Portable Charging Units Market: North America, Asia-Pacific, Europe
  • Top Key Players in Portable Charging Units Market: Alpha Group, Fantasia Trading LLC (Anker Innovations), Apple Inc., AUKEY Official, Baseus.com, Belkin, ELECOM CO., LTD., Hama GmbH & Co KG, Inter IKEA Systems B.V., Intenso International GmbH, j5create, Mazer, ZAGG Inc., NANAMI

Portable Charging Units Market Market Value Analysis

Portable Charging Units Market Key Takeaways

Metric Value
Portable Charging Units Market Estimated Value in (2025 E) USD 7.5 billion
Portable Charging Units Market Forecast Value in (2035 F) USD 19.5 billion
Forecast CAGR (2025 to 2035) 10.0%

Why is the Portable Charging Units Market Growing?

The Portable Charging Units market is witnessing rapid expansion, driven by the rising dependence on mobile devices and the increasing need for reliable on-the-go power solutions. Smartphones, tablets, music players, and microelectronic devices have become essential daily-use products, creating a strong requirement for portable charging options. The market is being propelled by consumer demand for lightweight, compact, and high-capacity chargers that can ensure uninterrupted connectivity and productivity.

Technological advancements such as fast charging, wireless charging, and intelligent battery management systems are improving product performance and efficiency. Growing adoption of Internet of Things devices and wearable technology is also contributing to the surge in demand. Furthermore, the expansion of e-commerce platforms and retail distribution channels is making these products more accessible worldwide.

Rising disposable incomes and the increasing penetration of digital lifestyles in emerging economies are further supporting growth With manufacturers focusing on product differentiation, sustainability, and eco-friendly designs, the market is expected to maintain strong momentum As energy efficiency standards evolve and power consumption needs rise, portable charging units are projected to remain a crucial accessory across consumer and enterprise segments.

Segmental Analysis

The portable charging units market is segmented by capacity range, application, technology, number of ports, and geographic regions. By capacity range, portable charging units market is divided into 1,000 mAh-3,000 mAh, 3,000 mAh-6,000 mAh, 6,000 mAh-10,000 mAh, and Above 10,000 mAh. In terms of application, portable charging units market is classified into Smartphones, Music Players, Tablets, and Others. Based on technology, portable charging units market is segmented into Li-Ion, Li-Polymer, and Others. By number of ports, portable charging units market is segmented into One, Two, Three, and Four. Regionally, the portable charging units industry is classified into North America, Latin America, Western Europe, Eastern Europe, Balkan & Baltic Countries, Russia & Belarus, Central Asia, East Asia, South Asia & Pacific, and the Middle East & Africa.
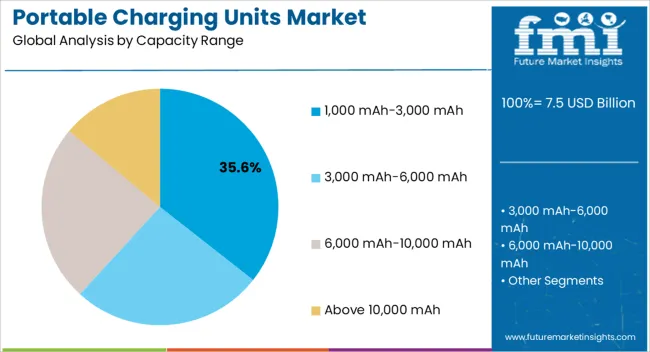
Insights into the 1,000 mAh-3,000 mAh Capacity Range Segment

Portable Charging Units Market Analysis By Capacity Range

The 1,000 mAh-3,000 mAh capacity range segment is projected to hold 35.6% of the market revenue share in 2025, making it a leading contributor. Growth in this segment is being supported by the demand for compact and lightweight chargers suitable for short-term and emergency use. These devices are particularly popular among users seeking affordable options to charge smaller electronic devices such as smartphones, music players, and wearables.

Portability and cost-effectiveness remain the core strengths of this segment, enabling widespread adoption across both developed and emerging economies. Their ease of use, combined with availability through online and offline retail platforms, enhances accessibility for a broad customer base. Increasing travel and outdoor activities have also fueled the need for pocket-sized chargers that provide quick energy boosts on the go.

Furthermore, manufacturers are enhancing product features such as rapid charging and safety protection circuits to improve performance As consumer lifestyles continue to prioritize mobility and convenience, the 1,000 mAh-3,000 mAh segment is expected to retain its significant market position, supported by affordability, accessibility, and evolving user requirements.
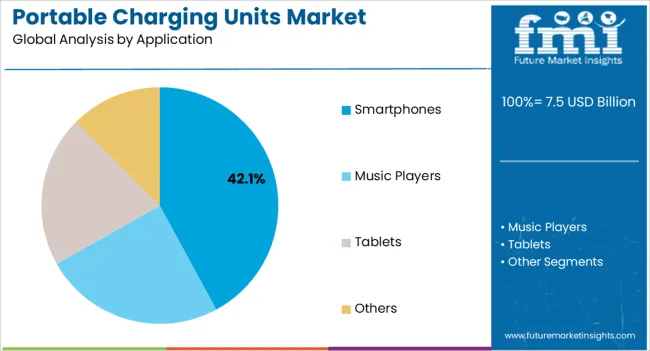
Insights into the Smartphones Application Segment

Portable Charging Units Market Analysis By Application

The smartphones application segment is expected to account for 42.1% of the Portable Charging Units market revenue in 2025, establishing itself as the dominant application area. Rising global smartphone penetration and the increasing use of power-intensive applications such as video streaming, gaming, and mobile commerce are driving the need for reliable charging solutions. Portable chargers for smartphones ensure uninterrupted connectivity, making them indispensable accessories for consumers across all demographics.

The ability to support frequent charging cycles and compatibility with various smartphone models has enhanced their adoption. Rapid advancements in fast-charging technologies and the integration of smart safety features have further improved consumer trust and satisfaction. The growth of e-commerce, particularly in emerging markets, has also expanded product reach and accessibility.

In addition, businesses are incorporating portable chargers into promotional campaigns and employee utilities, broadening usage beyond individual consumers As smartphones remain central to digital lifestyles and work environments, the segment is expected to maintain leadership, supported by rising daily usage and continuous technological innovation in portable charging units.
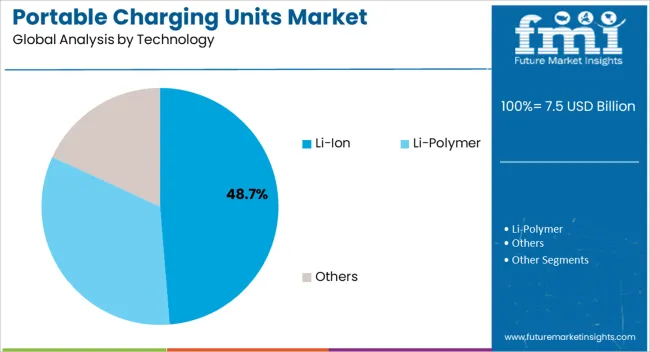
Insights into the Li-Ion Technology Segment

Portable Charging Units Market Analysis By Technology

The Li-Ion technology segment is anticipated to hold 48.7% of the Portable Charging Units market revenue share in 2025, making it the leading technology type. The widespread adoption of lithium-ion batteries is being driven by their superior energy density, lightweight design, and longer cycle life compared to traditional alternatives. Li-Ion technology enables the production of compact, efficient, and high-capacity chargers that meet modern consumer needs for portability and performance.

Rapid charging capabilities, improved safety mechanisms, and compatibility with a wide range of devices further strengthen market adoption. Environmental considerations are also driving innovation, as manufacturers explore recyclable materials and sustainable practices in Li-Ion battery production. With the growing prevalence of IoT devices, wearables, and high-performance smartphones, the demand for efficient power solutions continues to increase, reinforcing the leadership of Li-Ion technology.

Strategic investments in advanced battery technologies, including solid-state variants, are expected to enhance future growth As consumer expectations evolve toward longer-lasting, faster, and safer charging solutions, Li-Ion technology is poised to remain the cornerstone of the portable charging units market, ensuring its dominance over the forecast period.

Market Overview

Portable Charging Units Market Overview

The increased gadgets usage for gaming, surfing the internet, camera, etc. drain out the battery charge swiftly. To combat the unexpected and frequent battery death while travelling or in office, a reliable portable charger is necessary. Portable charging units are commonly called as power banks. Portable charging unit is essentially an external battery in a sealed case.

Portable charging units are manufactured in various capacities depending upon the applications of the units. The capacity of portable charging units refers to the maximum charge the battery can hold inside it. The capacity of portable charging units are measured in terms of milliampere-hour (mAh), the higher mAh indicates higher capacity of the power bank.

Generally, lithium ion batteries are utilized in the design of power bank for their compactness, affordability and varied market reach. Further, lithium is a highly reactive element that can handle and store energy more efficiently and recharge cycles properly. The most important part of portable charging units are the PCB board and batteries.

Currently, portable charging unit batteries are categorized as cylindrical battery, square aluminium case and polymer battery. Portable charging units are available with different number of ports in the market such as one port, two port, three port and four port.

Currently, two USB port charging unit holds major market share and this trend is expected to continue over the forecast period. Portable charging units are utilized to charge various products, which include laptops, mobile devices, tablets, digital cameras and others.

Based on the technology, it is expected that lithium ion battery would lead the portable charging units market as compared to lithium polymer and other batteries owing to the great cost to energy ratio and high energy density. However, lithium polymer batteries are expected to grow at a higher CAGR than lithium ion batteries owing to the light weight and better safety.
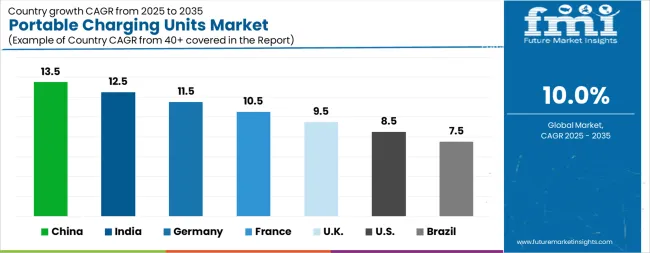
Analysis of Portable Charging Units Market By Key Countries

Portable Charging Units Market Cagr Analysis By Country

Country CAGR
China 13.5%
India 12.5%
Germany 11.5%
France 10.5%
UK 9.5%
USA 8.5%
Brazil 7.5%

Country-wise Analysis

The Portable Charging Units Market is expected to register a CAGR of 10.0% during the forecast period, exhibiting varied country level momentum. China leads with the highest CAGR of 13.5%, followed by India at 12.5%. Developed markets such as Germany, France, and the UK continue to expand steadily, while the USA is likely to grow at consistent rates. Brazil posts the lowest CAGR at 7.5%, yet still underscores a broadly positive trajectory for the global Portable Charging Units Market. In 2024, Germany held a dominant revenue in the Western Europe market and is expected to grow with a CAGR of 11.5%. The USA Portable Charging Units Market is estimated to be valued at USD 2.8 billion in 2025 and is anticipated to reach a valuation of USD 6.4 billion by 2035. Sales are projected to rise at a CAGR of 8.5% over the forecast period between 2025 and 2035. While Japan and South Korea markets are estimated to be valued at USD 402.9 million and USD 229.6 million respectively in 2025.
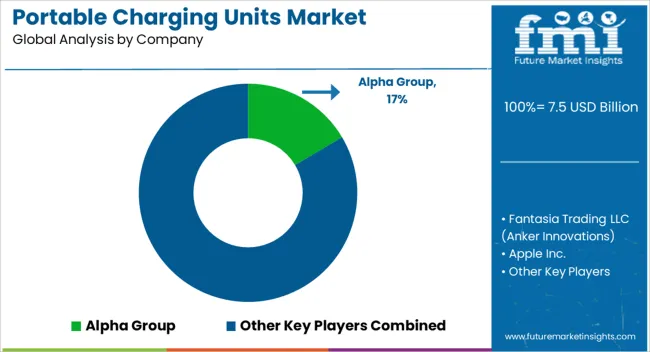
Key Players in the Portable Charging Units Market

Portable Charging Units Market Analysis By Company

  • Alpha Group
  • Fantasia Trading LLC (Anker Innovations)
  • Apple Inc.
  • AUKEY Official
  • Baseus.com
  • Belkin
  • ELECOM CO., LTD.
  • Hama GmbH & Co KG
  • Inter IKEA Systems B.V.
  • Intenso International GmbH
  • j5create
  • Mazer
  • ZAGG Inc.
  • NANAMI

Scope of the Report

Item Value
Quantitative Units USD 7.5 Billion
Capacity Range 1,000 mAh-3,000 mAh, 3,000 mAh-6,000 mAh, 6,000 mAh-10,000 mAh, and Above 10,000 mAh
Application Smartphones, Music Players, Tablets, and Others
Technology Li-Ion, Li-Polymer, and Others
Number of Ports One, Two, Three, and Four
Regions Covered North America, Europe, Asia-Pacific, Latin America, Middle East & Africa
Country Covered United States, Canada, Germany, France, United Kingdom, China, Japan, India, Brazil, South Africa
Key Companies Profiled Alpha Group, Fantasia Trading LLC (Anker Innovations), Apple Inc., AUKEY Official, Baseus.com, Belkin, ELECOM CO., LTD., Hama GmbH & Co KG, Inter IKEA Systems B.V., Intenso International GmbH, j5create, Mazer, ZAGG Inc., and NANAMI

Portable Charging Units Market by Segments

Capacity Range:

  • 1,000 mAh-3,000 mAh
  • 3,000 mAh-6,000 mAh
  • 6,000 mAh-10,000 mAh
  • Above 10,000 mAh

Application:

  • Smartphones
  • Music Players
  • Tablets
  • Others

Technology:

  • Li-Ion
  • Li-Polymer
  • Others

Number of Ports:

  • One
  • Two
  • Three
  • Four

Region:

  • North America
    • USA
    • Canada
    • Mexico
  • Latin America
    • Brazil
    • Chile
    • Rest of Latin America
  • Western Europe
    • Germany
    • UK
    • Italy
    • Spain
    • France
    • Nordic
    • BENELUX
    • Rest of Western Europe
  • Eastern Europe
    • Russia
    • Poland
    • Hungary
    • Balkan & Baltic
    • Rest of Eastern Europe
  • East Asia
    • China
    • Japan
    • South Korea
  • South Asia and Pacific
    • India
    • ASEAN
    • Australia & New Zealand
    • Rest of South Asia and Pacific
  • Middle East & Africa
    • Kingdom of Saudi Arabia
    • Other GCC Countries
    • Turkiye
    • South Africa
    • Other African Union
    • Rest of Middle East & Africa

Table of Content

  1. Executive Summary
    • Global Market Outlook
    • Demand-side Trends
    • Supply-side Trends
    • Technology Roadmap Analysis
    • Analysis and Recommendations
  2. Market Overview
    • Market Coverage / Taxonomy
    • Market Definition / Scope / Limitations
  3. Market Background
    • Market Dynamics
      • Drivers
      • Restraints
      • Opportunity
      • Trends
    • Scenario Forecast
      • Demand in Optimistic Scenario
      • Demand in Likely Scenario
      • Demand in Conservative Scenario
    • Opportunity Map Analysis
    • Product Life Cycle Analysis
    • Supply Chain Analysis
    • Investment Feasibility Matrix
    • Value Chain Analysis
    • PESTLE and Porter’s Analysis
    • Regulatory Landscape
    • Regional Parent Market Outlook
    • Production and Consumption Statistics
    • Import and Export Statistics
  4. Global Market Analysis 2020 to 2024 and Forecast, 2025 to 2035
    • Historical Market Size Value (USD Million) Analysis, 2020 to 2024
    • Current and Future Market Size Value (USD Million) Projections, 2025 to 2035
      • Y-o-Y Growth Trend Analysis
      • Absolute $ Opportunity Analysis
  5. Global Market Pricing Analysis 2020 to 2024 and Forecast 2025 to 2035
  6. Global Market Analysis 2020 to 2024 and Forecast 2025 to 2035, By Capacity Range
    • Introduction / Key Findings
    • Historical Market Size Value (USD Million) Analysis By Capacity Range , 2020 to 2024
    • Current and Future Market Size Value (USD Million) Analysis and Forecast By Capacity Range , 2025 to 2035
      • 1,000 mAh-3,000 mAh
      • 3,000 mAh-6,000 mAh
      • 6,000 mAh-10,000 mAh
      • Above 10,000 mAh
    • Y-o-Y Growth Trend Analysis By Capacity Range , 2020 to 2024
    • Absolute $ Opportunity Analysis By Capacity Range , 2025 to 2035
  7. Global Market Analysis 2020 to 2024 and Forecast 2025 to 2035, By Application
    • Introduction / Key Findings
    • Historical Market Size Value (USD Million) Analysis By Application, 2020 to 2024
    • Current and Future Market Size Value (USD Million) Analysis and Forecast By Application, 2025 to 2035
      • Smartphones
      • Music Players
      • Tablets
      • Others
    • Y-o-Y Growth Trend Analysis By Application, 2020 to 2024
    • Absolute $ Opportunity Analysis By Application, 2025 to 2035
  8. Global Market Analysis 2020 to 2024 and Forecast 2025 to 2035, By Technology
    • Introduction / Key Findings
    • Historical Market Size Value (USD Million) Analysis By Technology, 2020 to 2024
    • Current and Future Market Size Value (USD Million) Analysis and Forecast By Technology, 2025 to 2035
      • Li-Ion
      • Li-Polymer
      • Others
    • Y-o-Y Growth Trend Analysis By Technology, 2020 to 2024
    • Absolute $ Opportunity Analysis By Technology, 2025 to 2035
  9. Global Market Analysis 2020 to 2024 and Forecast 2025 to 2035, By Number of Ports
    • Introduction / Key Findings
    • Historical Market Size Value (USD Million) Analysis By Number of Ports, 2020 to 2024
    • Current and Future Market Size Value (USD Million) Analysis and Forecast By Number of Ports, 2025 to 2035
      • One
      • Two
      • Three
      • Four
    • Y-o-Y Growth Trend Analysis By Number of Ports, 2020 to 2024
    • Absolute $ Opportunity Analysis By Number of Ports, 2025 to 2035
  10. Global Market Analysis 2020 to 2024 and Forecast 2025 to 2035, By Region
    • Introduction
    • Historical Market Size Value (USD Million) Analysis By Region, 2020 to 2024
    • Current Market Size Value (USD Million) Analysis and Forecast By Region, 2025 to 2035
      • North America
      • Latin America
      • Western Europe
      • Eastern Europe
      • East Asia
      • South Asia and Pacific
      • Middle East & Africa
    • Market Attractiveness Analysis By Region
  11. North America Market Analysis 2020 to 2024 and Forecast 2025 to 2035, By Country
    • Historical Market Size Value (USD Million) Trend Analysis By Market Taxonomy, 2020 to 2024
    • Market Size Value (USD Million) Forecast By Market Taxonomy, 2025 to 2035
      • By Country
        • USA
        • Canada
        • Mexico
      • By Capacity Range
      • By Application
      • By Technology
      • By Number of Ports
    • Market Attractiveness Analysis
      • By Country
      • By Capacity Range
      • By Application
      • By Technology
      • By Number of Ports
    • Key Takeaways
  12. Latin America Market Analysis 2020 to 2024 and Forecast 2025 to 2035, By Country
    • Historical Market Size Value (USD Million) Trend Analysis By Market Taxonomy, 2020 to 2024
    • Market Size Value (USD Million) Forecast By Market Taxonomy, 2025 to 2035
      • By Country
        • Brazil
        • Chile
        • Rest of Latin America
      • By Capacity Range
      • By Application
      • By Technology
      • By Number of Ports
    • Market Attractiveness Analysis
      • By Country
      • By Capacity Range
      • By Application
      • By Technology
      • By Number of Ports
    • Key Takeaways
  13. Western Europe Market Analysis 2020 to 2024 and Forecast 2025 to 2035, By Country
    • Historical Market Size Value (USD Million) Trend Analysis By Market Taxonomy, 2020 to 2024
    • Market Size Value (USD Million) Forecast By Market Taxonomy, 2025 to 2035
      • By Country
        • Germany
        • UK
        • Italy
        • Spain
        • France
        • Nordic
        • BENELUX
        • Rest of Western Europe
      • By Capacity Range
      • By Application
      • By Technology
      • By Number of Ports
    • Market Attractiveness Analysis
      • By Country
      • By Capacity Range
      • By Application
      • By Technology
      • By Number of Ports
    • Key Takeaways
  14. Eastern Europe Market Analysis 2020 to 2024 and Forecast 2025 to 2035, By Country
    • Historical Market Size Value (USD Million) Trend Analysis By Market Taxonomy, 2020 to 2024
    • Market Size Value (USD Million) Forecast By Market Taxonomy, 2025 to 2035
      • By Country
        • Russia
        • Poland
        • Hungary
        • Balkan & Baltic
        • Rest of Eastern Europe
      • By Capacity Range
      • By Application
      • By Technology
      • By Number of Ports
    • Market Attractiveness Analysis
      • By Country
      • By Capacity Range
      • By Application
      • By Technology
      • By Number of Ports
    • Key Takeaways
  15. East Asia Market Analysis 2020 to 2024 and Forecast 2025 to 2035, By Country
    • Historical Market Size Value (USD Million) Trend Analysis By Market Taxonomy, 2020 to 2024
    • Market Size Value (USD Million) Forecast By Market Taxonomy, 2025 to 2035
      • By Country
        • China
        • Japan
        • South Korea
      • By Capacity Range
      • By Application
      • By Technology
      • By Number of Ports
    • Market Attractiveness Analysis
      • By Country
      • By Capacity Range
      • By Application
      • By Technology
      • By Number of Ports
    • Key Takeaways
  16. South Asia and Pacific Market Analysis 2020 to 2024 and Forecast 2025 to 2035, By Country
    • Historical Market Size Value (USD Million) Trend Analysis By Market Taxonomy, 2020 to 2024
    • Market Size Value (USD Million) Forecast By Market Taxonomy, 2025 to 2035
      • By Country
        • India
        • ASEAN
        • Australia & New Zealand
        • Rest of South Asia and Pacific
      • By Capacity Range
      • By Application
      • By Technology
      • By Number of Ports
    • Market Attractiveness Analysis
      • By Country
      • By Capacity Range
      • By Application
      • By Technology
      • By Number of Ports
    • Key Takeaways
  17. Middle East & Africa Market Analysis 2020 to 2024 and Forecast 2025 to 2035, By Country
    • Historical Market Size Value (USD Million) Trend Analysis By Market Taxonomy, 2020 to 2024
    • Market Size Value (USD Million) Forecast By Market Taxonomy, 2025 to 2035
      • By Country
        • Kingdom of Saudi Arabia
        • Other GCC Countries
        • Turkiye
        • South Africa
        • Other African Union
        • Rest of Middle East & Africa
      • By Capacity Range
      • By Application
      • By Technology
      • By Number of Ports
    • Market Attractiveness Analysis
      • By Country
      • By Capacity Range
      • By Application
      • By Technology
      • By Number of Ports
    • Key Takeaways
  18. Key Countries Market Analysis
    • USA
      • Pricing Analysis
      • Market Share Analysis, 2024
        • By Capacity Range
        • By Application
        • By Technology
        • By Number of Ports
    • Canada
      • Pricing Analysis
      • Market Share Analysis, 2024
        • By Capacity Range
        • By Application
        • By Technology
        • By Number of Ports
    • Mexico
      • Pricing Analysis
      • Market Share Analysis, 2024
        • By Capacity Range
        • By Application
        • By Technology
        • By Number of Ports
    • Brazil
      • Pricing Analysis
      • Market Share Analysis, 2024
        • By Capacity Range
        • By Application
        • By Technology
        • By Number of Ports
    • Chile
      • Pricing Analysis
      • Market Share Analysis, 2024
        • By Capacity Range
        • By Application
        • By Technology
        • By Number of Ports
    • Germany
      • Pricing Analysis
      • Market Share Analysis, 2024
        • By Capacity Range
        • By Application
        • By Technology
        • By Number of Ports
    • UK
      • Pricing Analysis
      • Market Share Analysis, 2024
        • By Capacity Range
        • By Application
        • By Technology
        • By Number of Ports
    • Italy
      • Pricing Analysis
      • Market Share Analysis, 2024
        • By Capacity Range
        • By Application
        • By Technology
        • By Number of Ports
    • Spain
      • Pricing Analysis
      • Market Share Analysis, 2024
        • By Capacity Range
        • By Application
        • By Technology
        • By Number of Ports
    • France
      • Pricing Analysis
      • Market Share Analysis, 2024
        • By Capacity Range
        • By Application
        • By Technology
        • By Number of Ports
    • India
      • Pricing Analysis
      • Market Share Analysis, 2024
        • By Capacity Range
        • By Application
        • By Technology
        • By Number of Ports
    • ASEAN
      • Pricing Analysis
      • Market Share Analysis, 2024
        • By Capacity Range
        • By Application
        • By Technology
        • By Number of Ports
    • Australia & New Zealand
      • Pricing Analysis
      • Market Share Analysis, 2024
        • By Capacity Range
        • By Application
        • By Technology
        • By Number of Ports
    • China
      • Pricing Analysis
      • Market Share Analysis, 2024
        • By Capacity Range
        • By Application
        • By Technology
        • By Number of Ports
    • Japan
      • Pricing Analysis
      • Market Share Analysis, 2024
        • By Capacity Range
        • By Application
        • By Technology
        • By Number of Ports
    • South Korea
      • Pricing Analysis
      • Market Share Analysis, 2024
        • By Capacity Range
        • By Application
        • By Technology
        • By Number of Ports
    • Russia
      • Pricing Analysis
      • Market Share Analysis, 2024
        • By Capacity Range
        • By Application
        • By Technology
        • By Number of Ports
    • Poland
      • Pricing Analysis
      • Market Share Analysis, 2024
        • By Capacity Range
        • By Application
        • By Technology
        • By Number of Ports
    • Hungary
      • Pricing Analysis
      • Market Share Analysis, 2024
        • By Capacity Range
        • By Application
        • By Technology
        • By Number of Ports
    • Kingdom of Saudi Arabia
      • Pricing Analysis
      • Market Share Analysis, 2024
        • By Capacity Range
        • By Application
        • By Technology
        • By Number of Ports
    • Turkiye
      • Pricing Analysis
      • Market Share Analysis, 2024
        • By Capacity Range
        • By Application
        • By Technology
        • By Number of Ports
    • South Africa
      • Pricing Analysis
      • Market Share Analysis, 2024
        • By Capacity Range
        • By Application
        • By Technology
        • By Number of Ports
  19. Market Structure Analysis
    • Competition Dashboard
    • Competition Benchmarking
    • Market Share Analysis of Top Players
      • By Regional
      • By Capacity Range
      • By Application
      • By Technology
      • By Number of Ports
  20. Competition Analysis
    • Competition Deep Dive
      • Alpha Group
        • Overview
        • Product Portfolio
        • Profitability by Market Segments (Product/Age /Sales Channel/Region)
        • Sales Footprint
        • Strategy Overview
          • Marketing Strategy
          • Product Strategy
          • Channel Strategy
      • Fantasia Trading LLC (Anker Innovations)
      • Apple Inc.
      • AUKEY Official
      • Baseus.com
      • Belkin
      • ELECOM CO., LTD.
      • Hama GmbH & Co KG
      • Inter IKEA Systems B.V.
      • Intenso International GmbH
      • j5create
      • Mazer
      • ZAGG Inc.
      • NANAMI
  21. Assumptions & Acronyms Used
  22. Research Methodology

List of Tables

  • Table 1: Global Market Value (USD Million) Forecast by Region, 2020 to 2035
  • Table 2: Global Market Value (USD Million) Forecast by Capacity Range , 2020 to 2035
  • Table 3: Global Market Value (USD Million) Forecast by Application, 2020 to 2035
  • Table 4: Global Market Value (USD Million) Forecast by Technology, 2020 to 2035
  • Table 5: Global Market Value (USD Million) Forecast by Number of Ports, 2020 to 2035
  • Table 6: North America Market Value (USD Million) Forecast by Country, 2020 to 2035
  • Table 7: North America Market Value (USD Million) Forecast by Capacity Range , 2020 to 2035
  • Table 8: North America Market Value (USD Million) Forecast by Application, 2020 to 2035
  • Table 9: North America Market Value (USD Million) Forecast by Technology, 2020 to 2035
  • Table 10: North America Market Value (USD Million) Forecast by Number of Ports, 2020 to 2035
  • Table 11: Latin America Market Value (USD Million) Forecast by Country, 2020 to 2035
  • Table 12: Latin America Market Value (USD Million) Forecast by Capacity Range , 2020 to 2035
  • Table 13: Latin America Market Value (USD Million) Forecast by Application, 2020 to 2035
  • Table 14: Latin America Market Value (USD Million) Forecast by Technology, 2020 to 2035
  • Table 15: Latin America Market Value (USD Million) Forecast by Number of Ports, 2020 to 2035
  • Table 16: Western Europe Market Value (USD Million) Forecast by Country, 2020 to 2035
  • Table 17: Western Europe Market Value (USD Million) Forecast by Capacity Range , 2020 to 2035
  • Table 18: Western Europe Market Value (USD Million) Forecast by Application, 2020 to 2035
  • Table 19: Western Europe Market Value (USD Million) Forecast by Technology, 2020 to 2035
  • Table 20: Western Europe Market Value (USD Million) Forecast by Number of Ports, 2020 to 2035
  • Table 21: Eastern Europe Market Value (USD Million) Forecast by Country, 2020 to 2035
  • Table 22: Eastern Europe Market Value (USD Million) Forecast by Capacity Range , 2020 to 2035
  • Table 23: Eastern Europe Market Value (USD Million) Forecast by Application, 2020 to 2035
  • Table 24: Eastern Europe Market Value (USD Million) Forecast by Technology, 2020 to 2035
  • Table 25: Eastern Europe Market Value (USD Million) Forecast by Number of Ports, 2020 to 2035
  • Table 26: East Asia Market Value (USD Million) Forecast by Country, 2020 to 2035
  • Table 27: East Asia Market Value (USD Million) Forecast by Capacity Range , 2020 to 2035
  • Table 28: East Asia Market Value (USD Million) Forecast by Application, 2020 to 2035
  • Table 29: East Asia Market Value (USD Million) Forecast by Technology, 2020 to 2035
  • Table 30: East Asia Market Value (USD Million) Forecast by Number of Ports, 2020 to 2035
  • Table 31: South Asia and Pacific Market Value (USD Million) Forecast by Country, 2020 to 2035
  • Table 32: South Asia and Pacific Market Value (USD Million) Forecast by Capacity Range , 2020 to 2035
  • Table 33: South Asia and Pacific Market Value (USD Million) Forecast by Application, 2020 to 2035
  • Table 34: South Asia and Pacific Market Value (USD Million) Forecast by Technology, 2020 to 2035
  • Table 35: South Asia and Pacific Market Value (USD Million) Forecast by Number of Ports, 2020 to 2035
  • Table 36: Middle East & Africa Market Value (USD Million) Forecast by Country, 2020 to 2035
  • Table 37: Middle East & Africa Market Value (USD Million) Forecast by Capacity Range , 2020 to 2035
  • Table 38: Middle East & Africa Market Value (USD Million) Forecast by Application, 2020 to 2035
  • Table 39: Middle East & Africa Market Value (USD Million) Forecast by Technology, 2020 to 2035
  • Table 40: Middle East & Africa Market Value (USD Million) Forecast by Number of Ports, 2020 to 2035

List of Figures

  • Figure 1: Global Market Pricing Analysis
  • Figure 2: Global Market Value (USD Million) Forecast 2020 to 2035
  • Figure 3: Global Market Value Share and BPS Analysis by Capacity Range , 2025 and 2035
  • Figure 4: Global Market Y-o-Y Growth Comparison by Capacity Range , 2025 to 2035
  • Figure 5: Global Market Attractiveness Analysis by Capacity Range
  • Figure 6: Global Market Value Share and BPS Analysis by Application, 2025 and 2035
  • Figure 7: Global Market Y-o-Y Growth Comparison by Application, 2025 to 2035
  • Figure 8: Global Market Attractiveness Analysis by Application
  • Figure 9: Global Market Value Share and BPS Analysis by Technology, 2025 and 2035
  • Figure 10: Global Market Y-o-Y Growth Comparison by Technology, 2025 to 2035
  • Figure 11: Global Market Attractiveness Analysis by Technology
  • Figure 12: Global Market Value Share and BPS Analysis by Number of Ports, 2025 and 2035
  • Figure 13: Global Market Y-o-Y Growth Comparison by Number of Ports, 2025 to 2035
  • Figure 14: Global Market Attractiveness Analysis by Number of Ports
  • Figure 15: Global Market Value (USD Million) Share and BPS Analysis by Region, 2025 and 2035
  • Figure 16: Global Market Y-o-Y Growth Comparison by Region, 2025 to 2035
  • Figure 17: Global Market Attractiveness Analysis by Region
  • Figure 18: North America Market Incremental Dollar Opportunity, 2025 to 2035
  • Figure 19: Latin America Market Incremental Dollar Opportunity, 2025 to 2035
  • Figure 20: Western Europe Market Incremental Dollar Opportunity, 2025 to 2035
  • Figure 21: Eastern Europe Market Incremental Dollar Opportunity, 2025 to 2035
  • Figure 22: East Asia Market Incremental Dollar Opportunity, 2025 to 2035
  • Figure 23: South Asia and Pacific Market Incremental Dollar Opportunity, 2025 to 2035
  • Figure 24: Middle East & Africa Market Incremental Dollar Opportunity, 2025 to 2035
  • Figure 25: North America Market Value Share and BPS Analysis by Country, 2025 and 2035
  • Figure 26: North America Market Value Share and BPS Analysis by Capacity Range , 2025 and 2035
  • Figure 27: North America Market Y-o-Y Growth Comparison by Capacity Range , 2025 to 2035
  • Figure 28: North America Market Attractiveness Analysis by Capacity Range
  • Figure 29: North America Market Value Share and BPS Analysis by Application, 2025 and 2035
  • Figure 30: North America Market Y-o-Y Growth Comparison by Application, 2025 to 2035
  • Figure 31: North America Market Attractiveness Analysis by Application
  • Figure 32: North America Market Value Share and BPS Analysis by Technology, 2025 and 2035
  • Figure 33: North America Market Y-o-Y Growth Comparison by Technology, 2025 to 2035
  • Figure 34: North America Market Attractiveness Analysis by Technology
  • Figure 35: North America Market Value Share and BPS Analysis by Number of Ports, 2025 and 2035
  • Figure 36: North America Market Y-o-Y Growth Comparison by Number of Ports, 2025 to 2035
  • Figure 37: North America Market Attractiveness Analysis by Number of Ports
  • Figure 38: Latin America Market Value Share and BPS Analysis by Country, 2025 and 2035
  • Figure 39: Latin America Market Value Share and BPS Analysis by Capacity Range , 2025 and 2035
  • Figure 40: Latin America Market Y-o-Y Growth Comparison by Capacity Range , 2025 to 2035
  • Figure 41: Latin America Market Attractiveness Analysis by Capacity Range
  • Figure 42: Latin America Market Value Share and BPS Analysis by Application, 2025 and 2035
  • Figure 43: Latin America Market Y-o-Y Growth Comparison by Application, 2025 to 2035
  • Figure 44: Latin America Market Attractiveness Analysis by Application
  • Figure 45: Latin America Market Value Share and BPS Analysis by Technology, 2025 and 2035
  • Figure 46: Latin America Market Y-o-Y Growth Comparison by Technology, 2025 to 2035
  • Figure 47: Latin America Market Attractiveness Analysis by Technology
  • Figure 48: Latin America Market Value Share and BPS Analysis by Number of Ports, 2025 and 2035
  • Figure 49: Latin America Market Y-o-Y Growth Comparison by Number of Ports, 2025 to 2035
  • Figure 50: Latin America Market Attractiveness Analysis by Number of Ports
  • Figure 51: Western Europe Market Value Share and BPS Analysis by Country, 2025 and 2035
  • Figure 52: Western Europe Market Value Share and BPS Analysis by Capacity Range , 2025 and 2035
  • Figure 53: Western Europe Market Y-o-Y Growth Comparison by Capacity Range , 2025 to 2035
  • Figure 54: Western Europe Market Attractiveness Analysis by Capacity Range
  • Figure 55: Western Europe Market Value Share and BPS Analysis by Application, 2025 and 2035
  • Figure 56: Western Europe Market Y-o-Y Growth Comparison by Application, 2025 to 2035
  • Figure 57: Western Europe Market Attractiveness Analysis by Application
  • Figure 58: Western Europe Market Value Share and BPS Analysis by Technology, 2025 and 2035
  • Figure 59: Western Europe Market Y-o-Y Growth Comparison by Technology, 2025 to 2035
  • Figure 60: Western Europe Market Attractiveness Analysis by Technology
  • Figure 61: Western Europe Market Value Share and BPS Analysis by Number of Ports, 2025 and 2035
  • Figure 62: Western Europe Market Y-o-Y Growth Comparison by Number of Ports, 2025 to 2035
  • Figure 63: Western Europe Market Attractiveness Analysis by Number of Ports
  • Figure 64: Eastern Europe Market Value Share and BPS Analysis by Country, 2025 and 2035
  • Figure 65: Eastern Europe Market Value Share and BPS Analysis by Capacity Range , 2025 and 2035
  • Figure 66: Eastern Europe Market Y-o-Y Growth Comparison by Capacity Range , 2025 to 2035
  • Figure 67: Eastern Europe Market Attractiveness Analysis by Capacity Range
  • Figure 68: Eastern Europe Market Value Share and BPS Analysis by Application, 2025 and 2035
  • Figure 69: Eastern Europe Market Y-o-Y Growth Comparison by Application, 2025 to 2035
  • Figure 70: Eastern Europe Market Attractiveness Analysis by Application
  • Figure 71: Eastern Europe Market Value Share and BPS Analysis by Technology, 2025 and 2035
  • Figure 72: Eastern Europe Market Y-o-Y Growth Comparison by Technology, 2025 to 2035
  • Figure 73: Eastern Europe Market Attractiveness Analysis by Technology
  • Figure 74: Eastern Europe Market Value Share and BPS Analysis by Number of Ports, 2025 and 2035
  • Figure 75: Eastern Europe Market Y-o-Y Growth Comparison by Number of Ports, 2025 to 2035
  • Figure 76: Eastern Europe Market Attractiveness Analysis by Number of Ports
  • Figure 77: East Asia Market Value Share and BPS Analysis by Country, 2025 and 2035
  • Figure 78: East Asia Market Value Share and BPS Analysis by Capacity Range , 2025 and 2035
  • Figure 79: East Asia Market Y-o-Y Growth Comparison by Capacity Range , 2025 to 2035
  • Figure 80: East Asia Market Attractiveness Analysis by Capacity Range
  • Figure 81: East Asia Market Value Share and BPS Analysis by Application, 2025 and 2035
  • Figure 82: East Asia Market Y-o-Y Growth Comparison by Application, 2025 to 2035
  • Figure 83: East Asia Market Attractiveness Analysis by Application
  • Figure 84: East Asia Market Value Share and BPS Analysis by Technology, 2025 and 2035
  • Figure 85: East Asia Market Y-o-Y Growth Comparison by Technology, 2025 to 2035
  • Figure 86: East Asia Market Attractiveness Analysis by Technology
  • Figure 87: East Asia Market Value Share and BPS Analysis by Number of Ports, 2025 and 2035
  • Figure 88: East Asia Market Y-o-Y Growth Comparison by Number of Ports, 2025 to 2035
  • Figure 89: East Asia Market Attractiveness Analysis by Number of Ports
  • Figure 90: South Asia and Pacific Market Value Share and BPS Analysis by Country, 2025 and 2035
  • Figure 91: South Asia and Pacific Market Value Share and BPS Analysis by Capacity Range , 2025 and 2035
  • Figure 92: South Asia and Pacific Market Y-o-Y Growth Comparison by Capacity Range , 2025 to 2035
  • Figure 93: South Asia and Pacific Market Attractiveness Analysis by Capacity Range
  • Figure 94: South Asia and Pacific Market Value Share and BPS Analysis by Application, 2025 and 2035
  • Figure 95: South Asia and Pacific Market Y-o-Y Growth Comparison by Application, 2025 to 2035
  • Figure 96: South Asia and Pacific Market Attractiveness Analysis by Application
  • Figure 97: South Asia and Pacific Market Value Share and BPS Analysis by Technology, 2025 and 2035
  • Figure 98: South Asia and Pacific Market Y-o-Y Growth Comparison by Technology, 2025 to 2035
  • Figure 99: South Asia and Pacific Market Attractiveness Analysis by Technology
  • Figure 100: South Asia and Pacific Market Value Share and BPS Analysis by Number of Ports, 2025 and 2035
  • Figure 101: South Asia and Pacific Market Y-o-Y Growth Comparison by Number of Ports, 2025 to 2035
  • Figure 102: South Asia and Pacific Market Attractiveness Analysis by Number of Ports
  • Figure 103: Middle East & Africa Market Value Share and BPS Analysis by Country, 2025 and 2035
  • Figure 104: Middle East & Africa Market Value Share and BPS Analysis by Capacity Range , 2025 and 2035
  • Figure 105: Middle East & Africa Market Y-o-Y Growth Comparison by Capacity Range , 2025 to 2035
  • Figure 106: Middle East & Africa Market Attractiveness Analysis by Capacity Range
  • Figure 107: Middle East & Africa Market Value Share and BPS Analysis by Application, 2025 and 2035
  • Figure 108: Middle East & Africa Market Y-o-Y Growth Comparison by Application, 2025 to 2035
  • Figure 109: Middle East & Africa Market Attractiveness Analysis by Application
  • Figure 110: Middle East & Africa Market Value Share and BPS Analysis by Technology, 2025 and 2035
  • Figure 111: Middle East & Africa Market Y-o-Y Growth Comparison by Technology, 2025 to 2035
  • Figure 112: Middle East & Africa Market Attractiveness Analysis by Technology
  • Figure 113: Middle East & Africa Market Value Share and BPS Analysis by Number of Ports, 2025 and 2035
  • Figure 114: Middle East & Africa Market Y-o-Y Growth Comparison by Number of Ports, 2025 to 2035
  • Figure 115: Middle East & Africa Market Attractiveness Analysis by Number of Ports
  • Figure 116: Global Market – Tier Structure Analysis
  • Figure 117: Global Market – Company Share Analysis

Frequently Asked Questions

How big is the portable charging units market in 2025?

The global portable charging units market is estimated to be valued at USD 7.5 billion in 2025.

What will be the size of portable charging units market in 2035?

The market size for the portable charging units market is projected to reach USD 19.5 billion by 2035.

How much will be the portable charging units market growth between 2025 and 2035?

The portable charging units market is expected to grow at a 10.0% CAGR between 2025 and 2035.

What are the key product types in the portable charging units market?

The key product types in portable charging units market are 1,000 mah-3,000 mah, 3,000 mah-6,000 mah, 6,000 mah-10,000 mah and above 10,000 mah.

Which application segment to contribute significant share in the portable charging units market in 2025?

In terms of application, smartphones segment to command 42.1% share in the portable charging units market in 2025.

Explore Similar Insights

Future Market Insights

Portable Charging Units Market

Chat With

MaRIA

Hi There, I am MaRIA, Your Market Research Intelligence Assistant. How may I help you?